Immigrants from China vs Immigrants from Czechoslovakia Disability
COMPARE
Immigrants from China
Immigrants from Czechoslovakia
Disability
Disability Comparison
Immigrants from China
Immigrants from Czechoslovakia
10.1%
DISABILITY
100.0/ 100
METRIC RATING
10th/ 347
METRIC RANK
11.2%
DISABILITY
97.4/ 100
METRIC RATING
99th/ 347
METRIC RANK
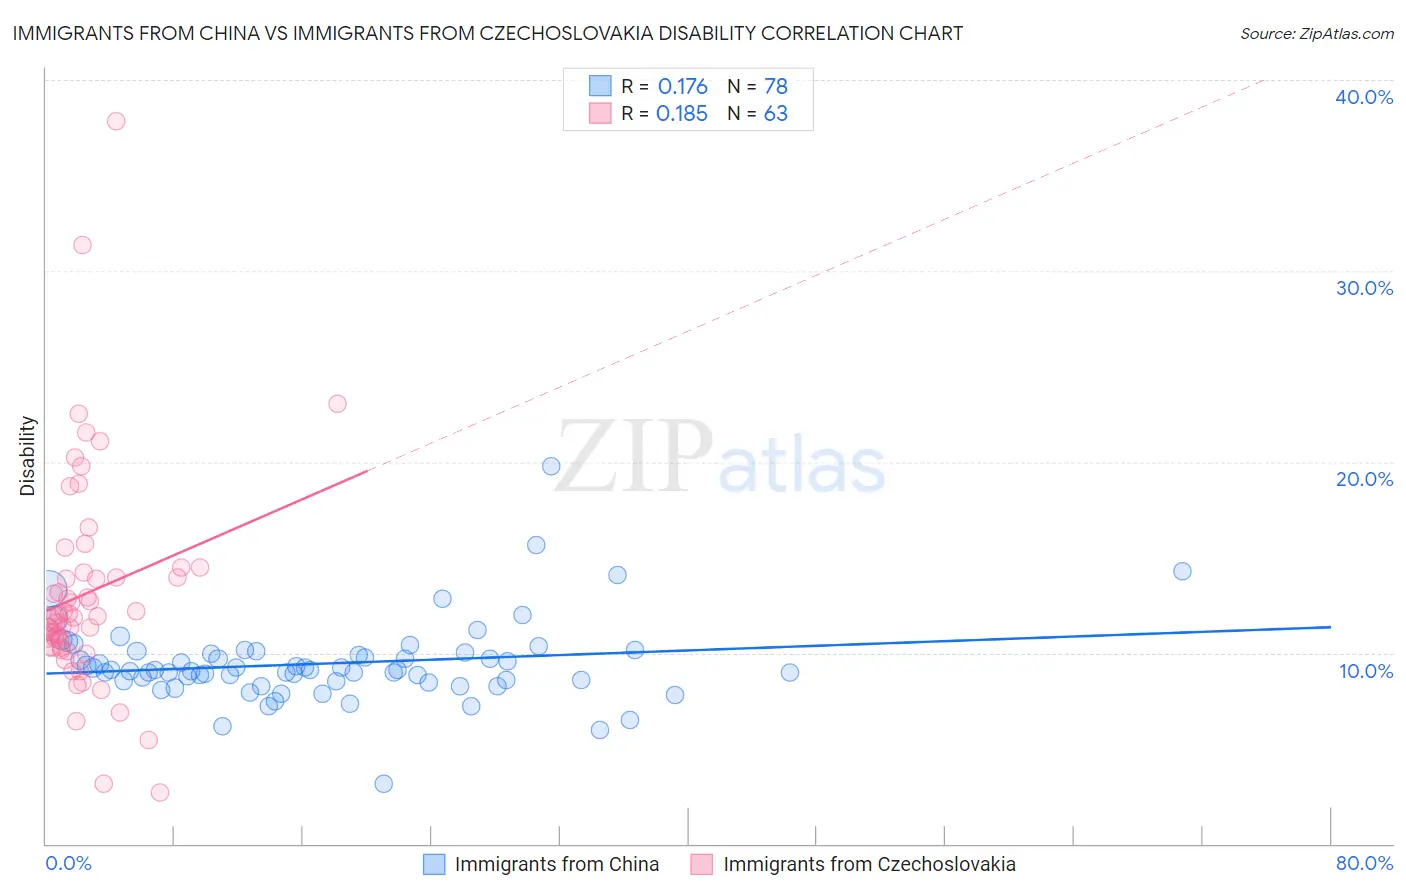
Immigrants from China vs Immigrants from Czechoslovakia Disability Correlation Chart
The statistical analysis conducted on geographies consisting of 457,054,974 people shows a poor positive correlation between the proportion of Immigrants from China and percentage of population with a disability in the United States with a correlation coefficient (R) of 0.176 and weighted average of 10.1%. Similarly, the statistical analysis conducted on geographies consisting of 195,454,618 people shows a poor positive correlation between the proportion of Immigrants from Czechoslovakia and percentage of population with a disability in the United States with a correlation coefficient (R) of 0.185 and weighted average of 11.2%, a difference of 11.1%.
Disability Correlation Summary
| Measurement | Immigrants from China | Immigrants from Czechoslovakia |
| Minimum | 3.1% | 2.7% |
| Maximum | 19.7% | 37.8% |
| Range | 16.6% | 35.2% |
| Mean | 9.4% | 13.1% |
| Median | 9.1% | 11.9% |
| Interquartile 25% (IQ1) | 8.5% | 10.3% |
| Interquartile 75% (IQ3) | 10.0% | 14.2% |
| Interquartile Range (IQR) | 1.4% | 3.9% |
| Standard Deviation (Sample) | 2.2% | 5.7% |
| Standard Deviation (Population) | 2.1% | 5.7% |
Similar Demographics by Disability
Demographics Similar to Immigrants from China by Disability
In terms of disability, the demographic groups most similar to Immigrants from China are Iranian (10.1%, a difference of 0.010%), Immigrants from Israel (10.1%, a difference of 0.26%), Immigrants from Eastern Asia (10.2%, a difference of 0.47%), Immigrants from Hong Kong (10.0%, a difference of 0.81%), and Immigrants from Korea (10.2%, a difference of 1.1%).
| Demographics | Rating | Rank | Disability |
| Immigrants | Taiwan | 100.0 /100 | #3 | Exceptional 9.6% |
| Thais | 100.0 /100 | #4 | Exceptional 9.7% |
| Immigrants | Bolivia | 100.0 /100 | #5 | Exceptional 9.9% |
| Immigrants | South Central Asia | 100.0 /100 | #6 | Exceptional 9.9% |
| Immigrants | Singapore | 100.0 /100 | #7 | Exceptional 10.0% |
| Bolivians | 100.0 /100 | #8 | Exceptional 10.0% |
| Immigrants | Hong Kong | 100.0 /100 | #9 | Exceptional 10.0% |
| Immigrants | China | 100.0 /100 | #10 | Exceptional 10.1% |
| Iranians | 100.0 /100 | #11 | Exceptional 10.1% |
| Immigrants | Israel | 100.0 /100 | #12 | Exceptional 10.1% |
| Immigrants | Eastern Asia | 100.0 /100 | #13 | Exceptional 10.2% |
| Immigrants | Korea | 100.0 /100 | #14 | Exceptional 10.2% |
| Okinawans | 100.0 /100 | #15 | Exceptional 10.3% |
| Indians (Asian) | 100.0 /100 | #16 | Exceptional 10.3% |
| Immigrants | Iran | 100.0 /100 | #17 | Exceptional 10.3% |
Demographics Similar to Immigrants from Czechoslovakia by Disability
In terms of disability, the demographic groups most similar to Immigrants from Czechoslovakia are Bhutanese (11.2%, a difference of 0.010%), Uruguayan (11.2%, a difference of 0.010%), Immigrants from Zimbabwe (11.2%, a difference of 0.15%), Immigrants from Greece (11.3%, a difference of 0.18%), and Immigrants from Morocco (11.2%, a difference of 0.22%).
| Demographics | Rating | Rank | Disability |
| Ecuadorians | 98.0 /100 | #92 | Exceptional 11.2% |
| Immigrants | Ecuador | 98.0 /100 | #93 | Exceptional 11.2% |
| Immigrants | Morocco | 97.8 /100 | #94 | Exceptional 11.2% |
| Eastern Europeans | 97.8 /100 | #95 | Exceptional 11.2% |
| Immigrants | Zimbabwe | 97.7 /100 | #96 | Exceptional 11.2% |
| Bhutanese | 97.4 /100 | #97 | Exceptional 11.2% |
| Uruguayans | 97.4 /100 | #98 | Exceptional 11.2% |
| Immigrants | Czechoslovakia | 97.4 /100 | #99 | Exceptional 11.2% |
| Immigrants | Greece | 96.9 /100 | #100 | Exceptional 11.3% |
| Immigrants | Nicaragua | 96.8 /100 | #101 | Exceptional 11.3% |
| Immigrants | Eastern Africa | 96.7 /100 | #102 | Exceptional 11.3% |
| Immigrants | Uruguay | 96.4 /100 | #103 | Exceptional 11.3% |
| Immigrants | Immigrants | 96.4 /100 | #104 | Exceptional 11.3% |
| Immigrants | Kazakhstan | 96.4 /100 | #105 | Exceptional 11.3% |
| Immigrants | Eastern Europe | 96.3 /100 | #106 | Exceptional 11.3% |