Honduran vs Ecuadorian Disability
COMPARE
Honduran
Ecuadorian
Disability
Disability Comparison
Hondurans
Ecuadorians
11.8%
DISABILITY
31.2/ 100
METRIC RATING
183rd/ 347
METRIC RANK
11.2%
DISABILITY
98.0/ 100
METRIC RATING
92nd/ 347
METRIC RANK
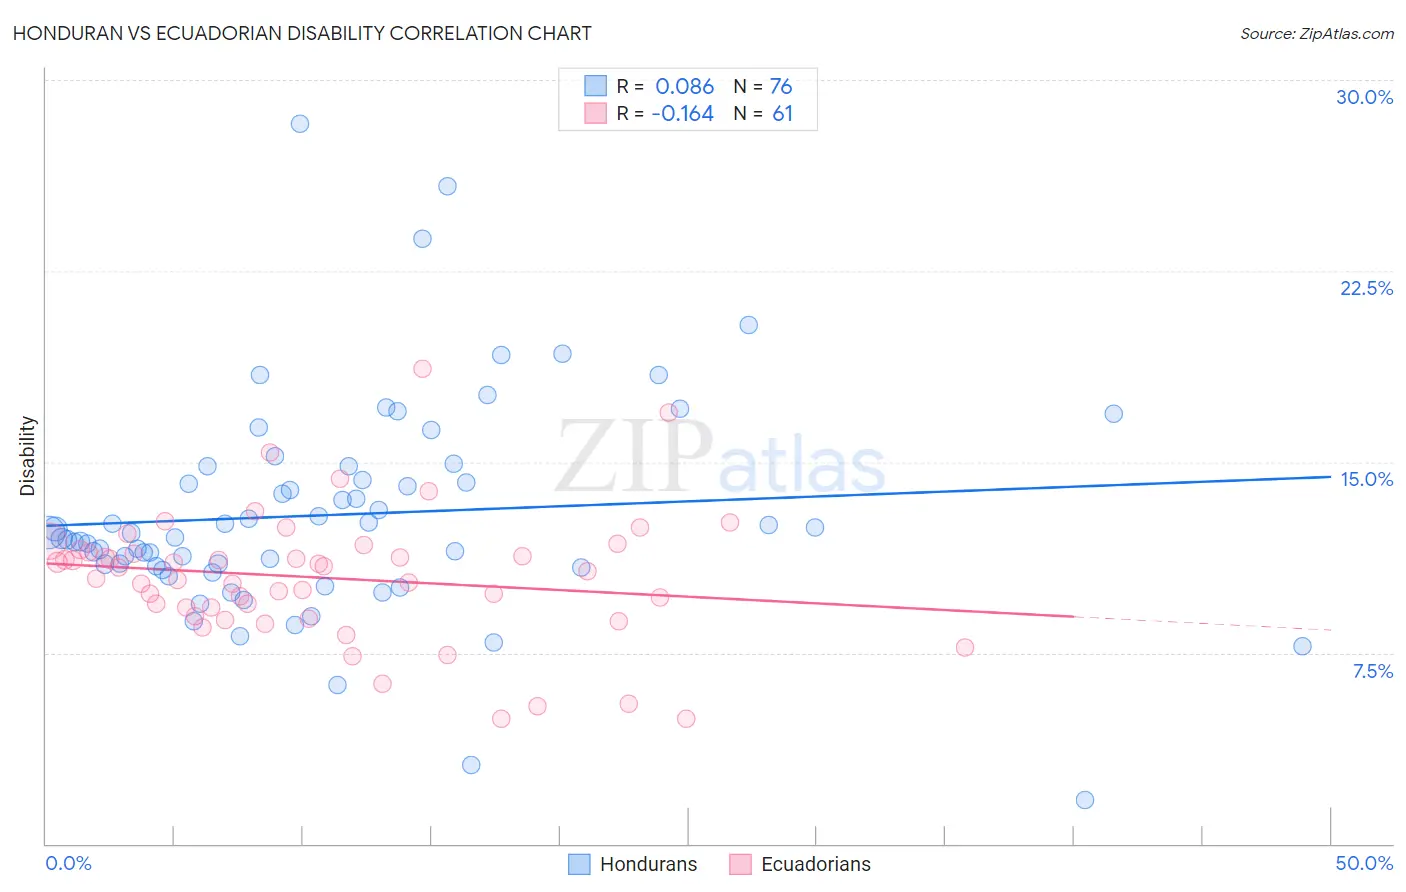
Honduran vs Ecuadorian Disability Correlation Chart
The statistical analysis conducted on geographies consisting of 357,777,033 people shows a slight positive correlation between the proportion of Hondurans and percentage of population with a disability in the United States with a correlation coefficient (R) of 0.086 and weighted average of 11.8%. Similarly, the statistical analysis conducted on geographies consisting of 317,822,544 people shows a poor negative correlation between the proportion of Ecuadorians and percentage of population with a disability in the United States with a correlation coefficient (R) of -0.164 and weighted average of 11.2%, a difference of 5.4%.
Disability Correlation Summary
| Measurement | Honduran | Ecuadorian |
| Minimum | 1.7% | 4.9% |
| Maximum | 28.3% | 18.7% |
| Range | 26.6% | 13.8% |
| Mean | 12.9% | 10.4% |
| Median | 12.1% | 10.7% |
| Interquartile 25% (IQ1) | 10.9% | 9.1% |
| Interquartile 75% (IQ3) | 14.6% | 11.5% |
| Interquartile Range (IQR) | 3.7% | 2.4% |
| Standard Deviation (Sample) | 4.3% | 2.5% |
| Standard Deviation (Population) | 4.2% | 2.5% |
Similar Demographics by Disability
Demographics Similar to Hondurans by Disability
In terms of disability, the demographic groups most similar to Hondurans are Iraqi (11.8%, a difference of 0.060%), Icelander (11.8%, a difference of 0.14%), Immigrants from Burma/Myanmar (11.8%, a difference of 0.14%), Immigrants from Oceania (11.8%, a difference of 0.15%), and Immigrants from Scotland (11.8%, a difference of 0.16%).
| Demographics | Rating | Rank | Disability |
| Immigrants | Western Africa | 47.5 /100 | #176 | Average 11.7% |
| Immigrants | Central America | 46.6 /100 | #177 | Average 11.7% |
| Greeks | 46.2 /100 | #178 | Average 11.7% |
| Immigrants | Armenia | 41.9 /100 | #179 | Average 11.7% |
| Immigrants | Honduras | 37.8 /100 | #180 | Fair 11.8% |
| Immigrants | Oceania | 34.3 /100 | #181 | Fair 11.8% |
| Icelanders | 34.0 /100 | #182 | Fair 11.8% |
| Hondurans | 31.2 /100 | #183 | Fair 11.8% |
| Iraqis | 30.0 /100 | #184 | Fair 11.8% |
| Immigrants | Burma/Myanmar | 28.5 /100 | #185 | Fair 11.8% |
| Immigrants | Scotland | 28.2 /100 | #186 | Fair 11.8% |
| Lebanese | 27.9 /100 | #187 | Fair 11.8% |
| Immigrants | Mexico | 23.8 /100 | #188 | Fair 11.9% |
| Immigrants | Zaire | 21.8 /100 | #189 | Fair 11.9% |
| Immigrants | West Indies | 21.1 /100 | #190 | Fair 11.9% |
Demographics Similar to Ecuadorians by Disability
In terms of disability, the demographic groups most similar to Ecuadorians are Immigrants from Ecuador (11.2%, a difference of 0.0%), Immigrants from Western Asia (11.2%, a difference of 0.040%), Immigrants from Brazil (11.2%, a difference of 0.060%), Immigrants from South Africa (11.2%, a difference of 0.11%), and Immigrants from Morocco (11.2%, a difference of 0.12%).
| Demographics | Rating | Rank | Disability |
| Immigrants | Belarus | 98.9 /100 | #85 | Exceptional 11.1% |
| Immigrants | Russia | 98.9 /100 | #86 | Exceptional 11.1% |
| Palestinians | 98.9 /100 | #87 | Exceptional 11.1% |
| Immigrants | Romania | 98.5 /100 | #88 | Exceptional 11.2% |
| Immigrants | South Africa | 98.2 /100 | #89 | Exceptional 11.2% |
| Immigrants | Brazil | 98.1 /100 | #90 | Exceptional 11.2% |
| Immigrants | Western Asia | 98.1 /100 | #91 | Exceptional 11.2% |
| Ecuadorians | 98.0 /100 | #92 | Exceptional 11.2% |
| Immigrants | Ecuador | 98.0 /100 | #93 | Exceptional 11.2% |
| Immigrants | Morocco | 97.8 /100 | #94 | Exceptional 11.2% |
| Eastern Europeans | 97.8 /100 | #95 | Exceptional 11.2% |
| Immigrants | Zimbabwe | 97.7 /100 | #96 | Exceptional 11.2% |
| Bhutanese | 97.4 /100 | #97 | Exceptional 11.2% |
| Uruguayans | 97.4 /100 | #98 | Exceptional 11.2% |
| Immigrants | Czechoslovakia | 97.4 /100 | #99 | Exceptional 11.2% |