Guamanian/Chamorro vs Pima Disability Age 65 to 74
COMPARE
Guamanian/Chamorro
Pima
Disability Age 65 to 74
Disability Age 65 to 74 Comparison
Guamanians/Chamorros
Pima
25.3%
DISABILITY AGE 65 TO 74
0.3/ 100
METRIC RATING
257th/ 347
METRIC RANK
38.6%
DISABILITY AGE 65 TO 74
0.0/ 100
METRIC RATING
347th/ 347
METRIC RANK
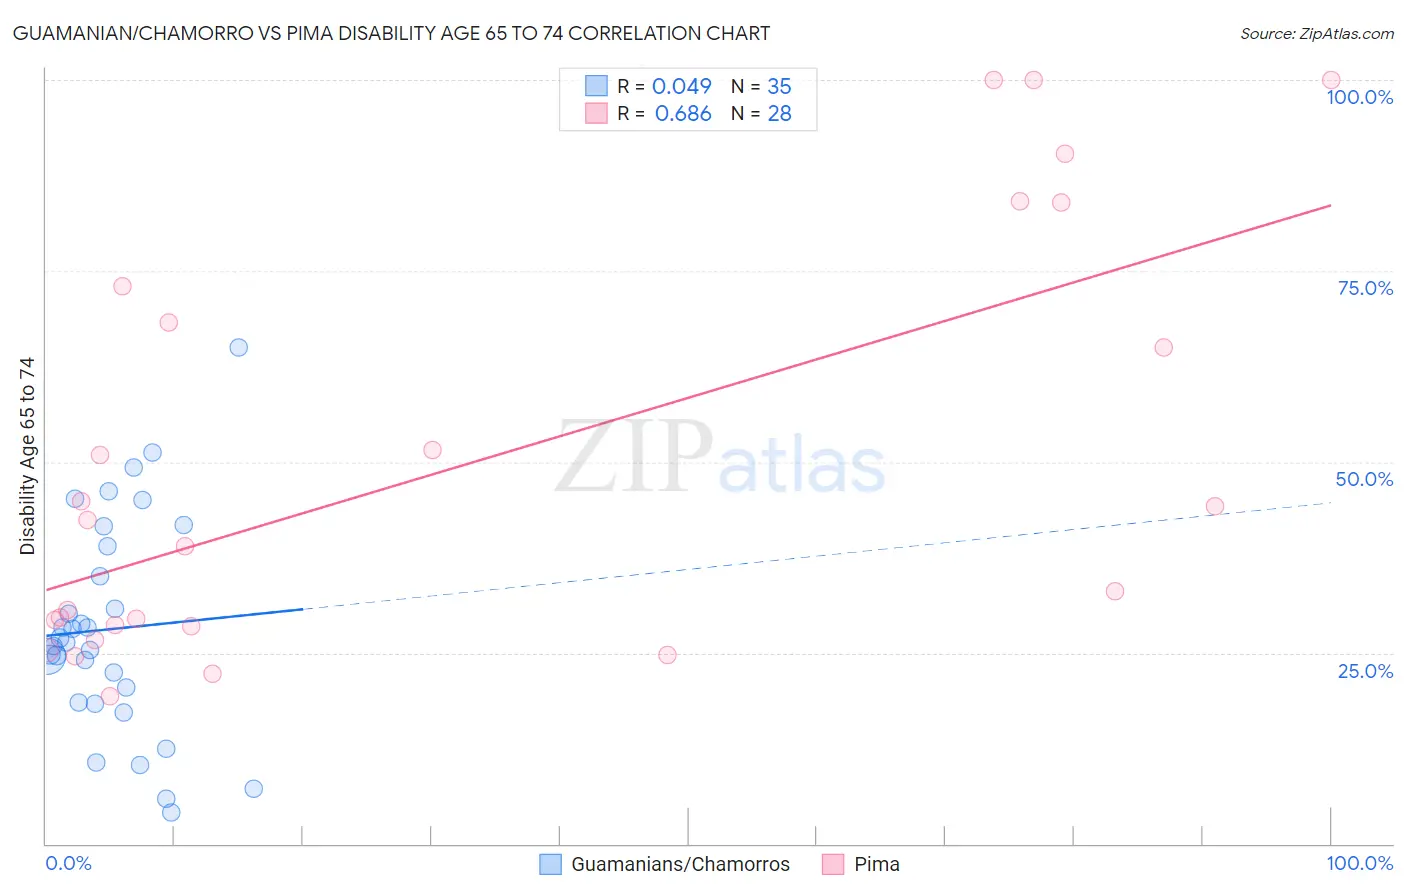
Guamanian/Chamorro vs Pima Disability Age 65 to 74 Correlation Chart
The statistical analysis conducted on geographies consisting of 221,467,649 people shows no correlation between the proportion of Guamanians/Chamorros and percentage of population with a disability between the ages 65 and 75 in the United States with a correlation coefficient (R) of 0.049 and weighted average of 25.3%. Similarly, the statistical analysis conducted on geographies consisting of 61,525,025 people shows a significant positive correlation between the proportion of Pima and percentage of population with a disability between the ages 65 and 75 in the United States with a correlation coefficient (R) of 0.686 and weighted average of 38.6%, a difference of 52.7%.
Disability Age 65 to 74 Correlation Summary
| Measurement | Guamanian/Chamorro | Pima |
| Minimum | 4.2% | 19.4% |
| Maximum | 65.0% | 100.0% |
| Range | 60.8% | 80.6% |
| Mean | 28.1% | 49.6% |
| Median | 26.4% | 40.6% |
| Interquartile 25% (IQ1) | 18.5% | 28.5% |
| Interquartile 75% (IQ3) | 39.0% | 70.6% |
| Interquartile Range (IQR) | 20.5% | 42.1% |
| Standard Deviation (Sample) | 14.0% | 27.1% |
| Standard Deviation (Population) | 13.8% | 26.6% |
Similar Demographics by Disability Age 65 to 74
Demographics Similar to Guamanians/Chamorros by Disability Age 65 to 74
In terms of disability age 65 to 74, the demographic groups most similar to Guamanians/Chamorros are Marshallese (25.3%, a difference of 0.060%), Immigrants from Cambodia (25.3%, a difference of 0.15%), Immigrants from Somalia (25.2%, a difference of 0.17%), Malaysian (25.4%, a difference of 0.47%), and Cape Verdean (25.4%, a difference of 0.55%).
| Demographics | Rating | Rank | Disability Age 65 to 74 |
| Salvadorans | 0.8 /100 | #250 | Tragic 25.0% |
| Immigrants | Nonimmigrants | 0.7 /100 | #251 | Tragic 25.0% |
| Immigrants | El Salvador | 0.6 /100 | #252 | Tragic 25.1% |
| Sub-Saharan Africans | 0.6 /100 | #253 | Tragic 25.1% |
| Somalis | 0.6 /100 | #254 | Tragic 25.1% |
| Central Americans | 0.5 /100 | #255 | Tragic 25.1% |
| Immigrants | Somalia | 0.4 /100 | #256 | Tragic 25.2% |
| Guamanians/Chamorros | 0.3 /100 | #257 | Tragic 25.3% |
| Marshallese | 0.3 /100 | #258 | Tragic 25.3% |
| Immigrants | Cambodia | 0.3 /100 | #259 | Tragic 25.3% |
| Malaysians | 0.2 /100 | #260 | Tragic 25.4% |
| Cape Verdeans | 0.2 /100 | #261 | Tragic 25.4% |
| Samoans | 0.2 /100 | #262 | Tragic 25.4% |
| Iroquois | 0.2 /100 | #263 | Tragic 25.4% |
| Hawaiians | 0.2 /100 | #264 | Tragic 25.5% |
Demographics Similar to Pima by Disability Age 65 to 74
In terms of disability age 65 to 74, the demographic groups most similar to Pima are Yup'ik (37.8%, a difference of 2.0%), Tohono O'odham (36.0%, a difference of 7.1%), Inupiat (34.5%, a difference of 11.8%), Navajo (33.3%, a difference of 15.8%), and Pueblo (33.1%, a difference of 16.7%).
| Demographics | Rating | Rank | Disability Age 65 to 74 |
| Colville | 0.0 /100 | #333 | Tragic 30.5% |
| Alaska Natives | 0.0 /100 | #334 | Tragic 30.6% |
| Cheyenne | 0.0 /100 | #335 | Tragic 31.1% |
| Yuman | 0.0 /100 | #336 | Tragic 31.5% |
| Houma | 0.0 /100 | #337 | Tragic 32.3% |
| Alaskan Athabascans | 0.0 /100 | #338 | Tragic 32.4% |
| Kiowa | 0.0 /100 | #339 | Tragic 32.6% |
| Lumbee | 0.0 /100 | #340 | Tragic 32.7% |
| Tsimshian | 0.0 /100 | #341 | Tragic 32.9% |
| Pueblo | 0.0 /100 | #342 | Tragic 33.1% |
| Navajo | 0.0 /100 | #343 | Tragic 33.3% |
| Inupiat | 0.0 /100 | #344 | Tragic 34.5% |
| Tohono O'odham | 0.0 /100 | #345 | Tragic 36.0% |
| Yup'ik | 0.0 /100 | #346 | Tragic 37.8% |
| Pima | 0.0 /100 | #347 | Tragic 38.6% |