Guamanian/Chamorro vs Scottish Disability Age 65 to 74
COMPARE
Guamanian/Chamorro
Scottish
Disability Age 65 to 74
Disability Age 65 to 74 Comparison
Guamanians/Chamorros
Scottish
25.3%
DISABILITY AGE 65 TO 74
0.3/ 100
METRIC RATING
257th/ 347
METRIC RANK
23.6%
DISABILITY AGE 65 TO 74
33.1/ 100
METRIC RATING
189th/ 347
METRIC RANK
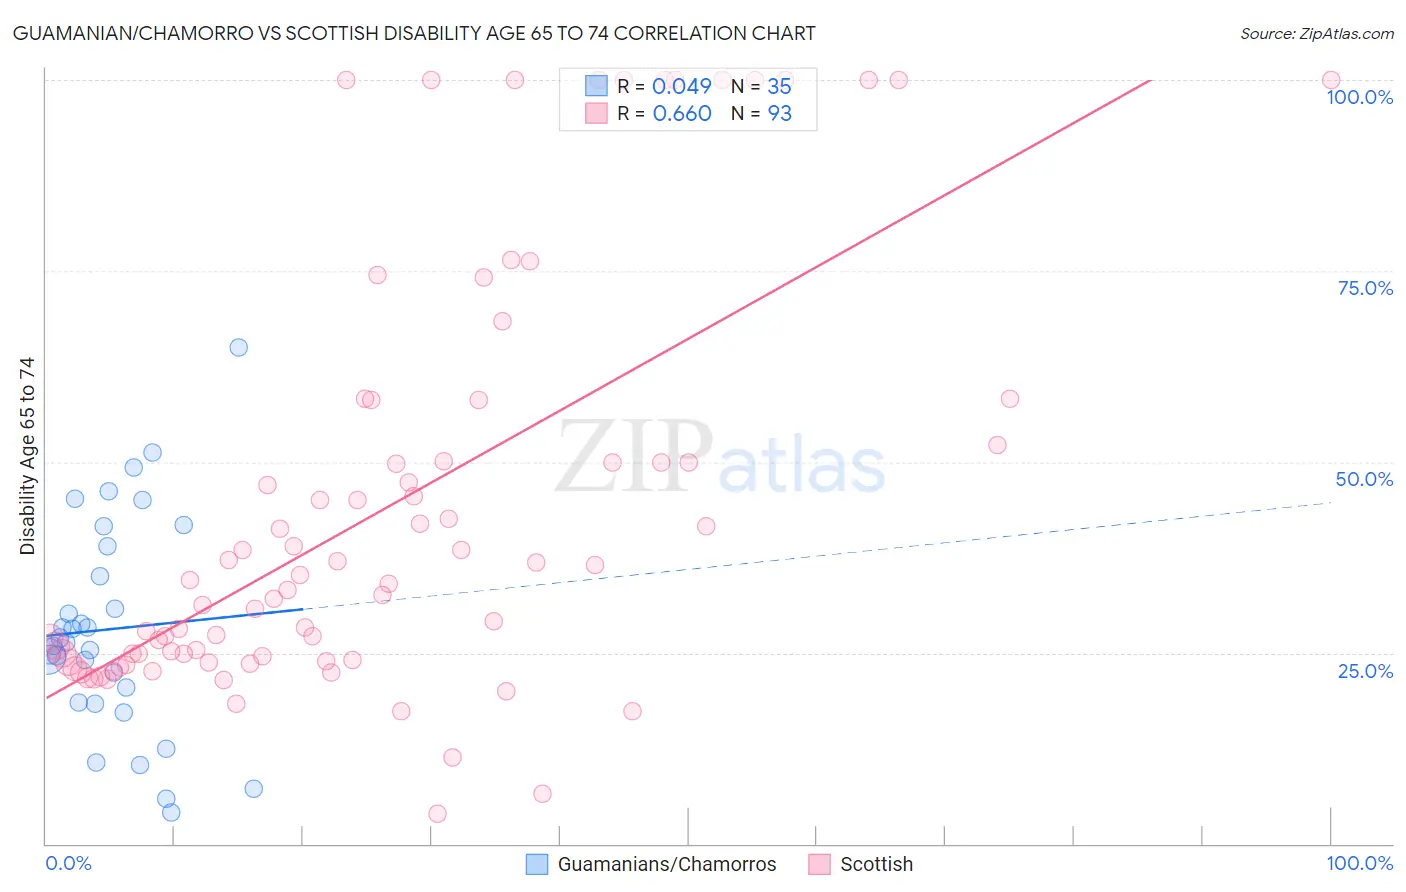
Guamanian/Chamorro vs Scottish Disability Age 65 to 74 Correlation Chart
The statistical analysis conducted on geographies consisting of 221,467,649 people shows no correlation between the proportion of Guamanians/Chamorros and percentage of population with a disability between the ages 65 and 75 in the United States with a correlation coefficient (R) of 0.049 and weighted average of 25.3%. Similarly, the statistical analysis conducted on geographies consisting of 564,724,008 people shows a significant positive correlation between the proportion of Scottish and percentage of population with a disability between the ages 65 and 75 in the United States with a correlation coefficient (R) of 0.660 and weighted average of 23.6%, a difference of 7.2%.
Disability Age 65 to 74 Correlation Summary
| Measurement | Guamanian/Chamorro | Scottish |
| Minimum | 4.2% | 4.0% |
| Maximum | 65.0% | 100.0% |
| Range | 60.8% | 96.0% |
| Mean | 28.1% | 43.7% |
| Median | 26.4% | 34.0% |
| Interquartile 25% (IQ1) | 18.5% | 24.0% |
| Interquartile 75% (IQ3) | 39.0% | 51.1% |
| Interquartile Range (IQR) | 20.5% | 27.1% |
| Standard Deviation (Sample) | 14.0% | 27.1% |
| Standard Deviation (Population) | 13.8% | 26.9% |
Similar Demographics by Disability Age 65 to 74
Demographics Similar to Guamanians/Chamorros by Disability Age 65 to 74
In terms of disability age 65 to 74, the demographic groups most similar to Guamanians/Chamorros are Marshallese (25.3%, a difference of 0.060%), Immigrants from Cambodia (25.3%, a difference of 0.15%), Immigrants from Somalia (25.2%, a difference of 0.17%), Malaysian (25.4%, a difference of 0.47%), and Cape Verdean (25.4%, a difference of 0.55%).
| Demographics | Rating | Rank | Disability Age 65 to 74 |
| Salvadorans | 0.8 /100 | #250 | Tragic 25.0% |
| Immigrants | Nonimmigrants | 0.7 /100 | #251 | Tragic 25.0% |
| Immigrants | El Salvador | 0.6 /100 | #252 | Tragic 25.1% |
| Sub-Saharan Africans | 0.6 /100 | #253 | Tragic 25.1% |
| Somalis | 0.6 /100 | #254 | Tragic 25.1% |
| Central Americans | 0.5 /100 | #255 | Tragic 25.1% |
| Immigrants | Somalia | 0.4 /100 | #256 | Tragic 25.2% |
| Guamanians/Chamorros | 0.3 /100 | #257 | Tragic 25.3% |
| Marshallese | 0.3 /100 | #258 | Tragic 25.3% |
| Immigrants | Cambodia | 0.3 /100 | #259 | Tragic 25.3% |
| Malaysians | 0.2 /100 | #260 | Tragic 25.4% |
| Cape Verdeans | 0.2 /100 | #261 | Tragic 25.4% |
| Samoans | 0.2 /100 | #262 | Tragic 25.4% |
| Iroquois | 0.2 /100 | #263 | Tragic 25.4% |
| Hawaiians | 0.2 /100 | #264 | Tragic 25.5% |
Demographics Similar to Scottish by Disability Age 65 to 74
In terms of disability age 65 to 74, the demographic groups most similar to Scottish are Immigrants from Cuba (23.6%, a difference of 0.060%), Immigrants from Guyana (23.6%, a difference of 0.12%), Immigrants from Bangladesh (23.6%, a difference of 0.19%), Ecuadorian (23.6%, a difference of 0.23%), and Portuguese (23.5%, a difference of 0.30%).
| Demographics | Rating | Rank | Disability Age 65 to 74 |
| Irish | 44.4 /100 | #182 | Average 23.4% |
| Immigrants | Eastern Africa | 42.8 /100 | #183 | Average 23.4% |
| Immigrants | Germany | 42.5 /100 | #184 | Average 23.4% |
| Haitians | 42.4 /100 | #185 | Average 23.4% |
| Basques | 38.4 /100 | #186 | Fair 23.5% |
| Portuguese | 37.8 /100 | #187 | Fair 23.5% |
| Immigrants | Cuba | 34.0 /100 | #188 | Fair 23.6% |
| Scottish | 33.1 /100 | #189 | Fair 23.6% |
| Immigrants | Guyana | 31.2 /100 | #190 | Fair 23.6% |
| Immigrants | Bangladesh | 30.2 /100 | #191 | Fair 23.6% |
| Ecuadorians | 29.7 /100 | #192 | Fair 23.6% |
| English | 28.5 /100 | #193 | Fair 23.6% |
| Sudanese | 27.8 /100 | #194 | Fair 23.7% |
| Immigrants | St. Vincent and the Grenadines | 26.1 /100 | #195 | Fair 23.7% |
| Immigrants | Trinidad and Tobago | 26.1 /100 | #196 | Fair 23.7% |