Guamanian/Chamorro vs Tongan Disability Age 65 to 74
COMPARE
Guamanian/Chamorro
Tongan
Disability Age 65 to 74
Disability Age 65 to 74 Comparison
Guamanians/Chamorros
Tongans
25.3%
DISABILITY AGE 65 TO 74
0.3/ 100
METRIC RATING
257th/ 347
METRIC RANK
23.8%
DISABILITY AGE 65 TO 74
20.8/ 100
METRIC RATING
205th/ 347
METRIC RANK
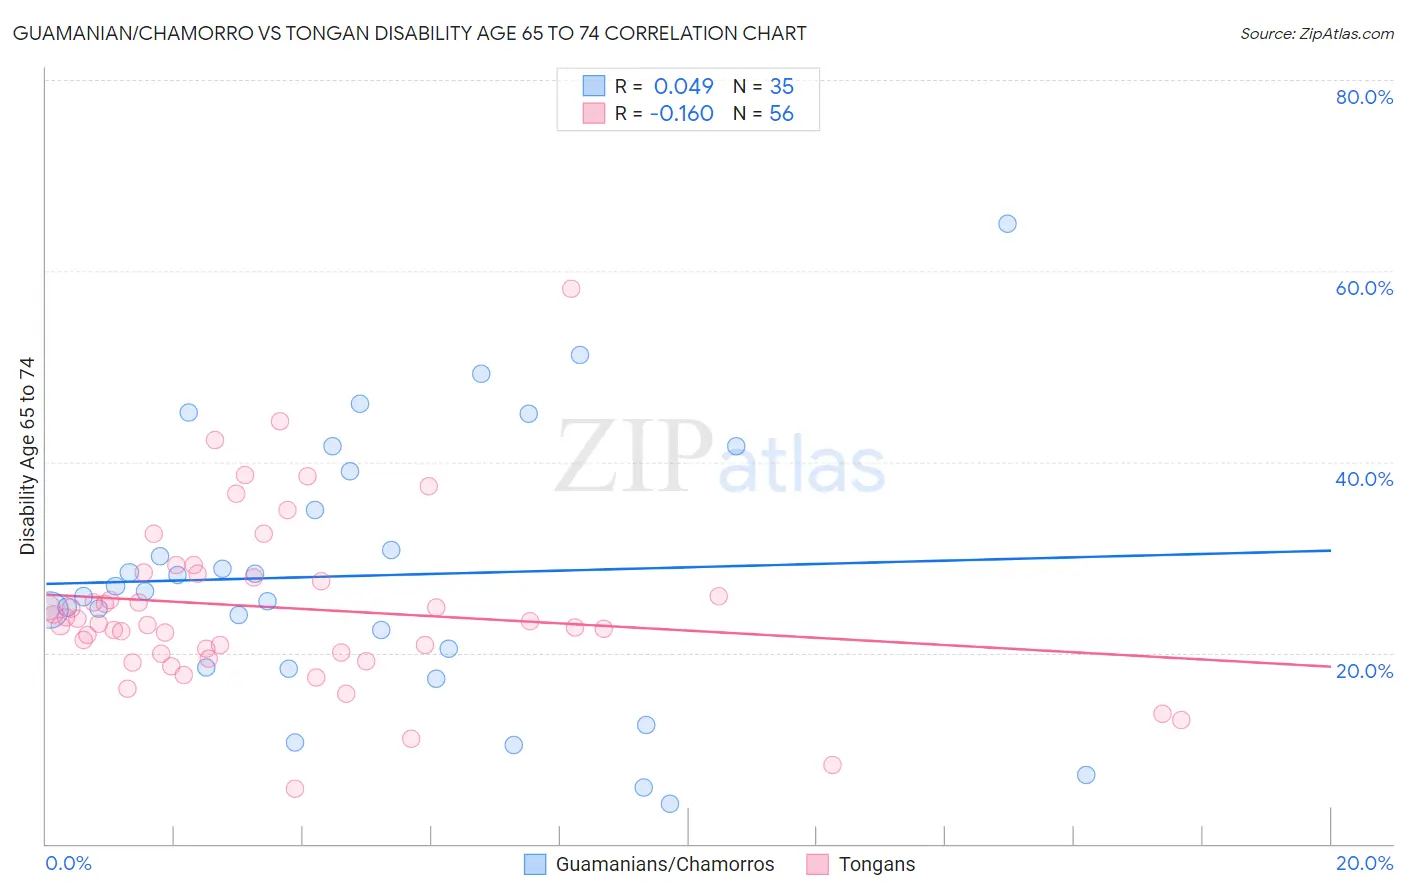
Guamanian/Chamorro vs Tongan Disability Age 65 to 74 Correlation Chart
The statistical analysis conducted on geographies consisting of 221,467,649 people shows no correlation between the proportion of Guamanians/Chamorros and percentage of population with a disability between the ages 65 and 75 in the United States with a correlation coefficient (R) of 0.049 and weighted average of 25.3%. Similarly, the statistical analysis conducted on geographies consisting of 102,809,825 people shows a poor negative correlation between the proportion of Tongans and percentage of population with a disability between the ages 65 and 75 in the United States with a correlation coefficient (R) of -0.160 and weighted average of 23.8%, a difference of 6.3%.
Disability Age 65 to 74 Correlation Summary
| Measurement | Guamanian/Chamorro | Tongan |
| Minimum | 4.2% | 5.7% |
| Maximum | 65.0% | 58.2% |
| Range | 60.8% | 52.5% |
| Mean | 28.1% | 24.7% |
| Median | 26.4% | 23.2% |
| Interquartile 25% (IQ1) | 18.5% | 20.0% |
| Interquartile 75% (IQ3) | 39.0% | 28.1% |
| Interquartile Range (IQR) | 20.5% | 8.2% |
| Standard Deviation (Sample) | 14.0% | 9.0% |
| Standard Deviation (Population) | 13.8% | 8.9% |
Similar Demographics by Disability Age 65 to 74
Demographics Similar to Guamanians/Chamorros by Disability Age 65 to 74
In terms of disability age 65 to 74, the demographic groups most similar to Guamanians/Chamorros are Marshallese (25.3%, a difference of 0.060%), Immigrants from Cambodia (25.3%, a difference of 0.15%), Immigrants from Somalia (25.2%, a difference of 0.17%), Malaysian (25.4%, a difference of 0.47%), and Cape Verdean (25.4%, a difference of 0.55%).
| Demographics | Rating | Rank | Disability Age 65 to 74 |
| Salvadorans | 0.8 /100 | #250 | Tragic 25.0% |
| Immigrants | Nonimmigrants | 0.7 /100 | #251 | Tragic 25.0% |
| Immigrants | El Salvador | 0.6 /100 | #252 | Tragic 25.1% |
| Sub-Saharan Africans | 0.6 /100 | #253 | Tragic 25.1% |
| Somalis | 0.6 /100 | #254 | Tragic 25.1% |
| Central Americans | 0.5 /100 | #255 | Tragic 25.1% |
| Immigrants | Somalia | 0.4 /100 | #256 | Tragic 25.2% |
| Guamanians/Chamorros | 0.3 /100 | #257 | Tragic 25.3% |
| Marshallese | 0.3 /100 | #258 | Tragic 25.3% |
| Immigrants | Cambodia | 0.3 /100 | #259 | Tragic 25.3% |
| Malaysians | 0.2 /100 | #260 | Tragic 25.4% |
| Cape Verdeans | 0.2 /100 | #261 | Tragic 25.4% |
| Samoans | 0.2 /100 | #262 | Tragic 25.4% |
| Iroquois | 0.2 /100 | #263 | Tragic 25.4% |
| Hawaiians | 0.2 /100 | #264 | Tragic 25.5% |
Demographics Similar to Tongans by Disability Age 65 to 74
In terms of disability age 65 to 74, the demographic groups most similar to Tongans are Immigrants from Jamaica (23.8%, a difference of 0.0%), Immigrants from Sudan (23.8%, a difference of 0.060%), Immigrants from Barbados (23.8%, a difference of 0.10%), Immigrants from Grenada (23.8%, a difference of 0.11%), and Immigrants from Kenya (23.8%, a difference of 0.11%).
| Demographics | Rating | Rank | Disability Age 65 to 74 |
| Immigrants | Africa | 24.4 /100 | #198 | Fair 23.7% |
| Welsh | 24.3 /100 | #199 | Fair 23.7% |
| French Canadians | 24.0 /100 | #200 | Fair 23.7% |
| Immigrants | Ecuador | 23.9 /100 | #201 | Fair 23.7% |
| Immigrants | Bahamas | 23.3 /100 | #202 | Fair 23.7% |
| Kenyans | 23.2 /100 | #203 | Fair 23.7% |
| Immigrants | Grenada | 22.1 /100 | #204 | Fair 23.8% |
| Tongans | 20.8 /100 | #205 | Fair 23.8% |
| Immigrants | Jamaica | 20.7 /100 | #206 | Fair 23.8% |
| Immigrants | Sudan | 20.1 /100 | #207 | Fair 23.8% |
| Immigrants | Barbados | 19.6 /100 | #208 | Poor 23.8% |
| Immigrants | Kenya | 19.6 /100 | #209 | Poor 23.8% |
| Trinidadians and Tobagonians | 16.4 /100 | #210 | Poor 23.9% |
| Immigrants | West Indies | 15.9 /100 | #211 | Poor 23.9% |
| French | 15.7 /100 | #212 | Poor 23.9% |