Guamanian/Chamorro vs New Zealander Disability Age 65 to 74
COMPARE
Guamanian/Chamorro
New Zealander
Disability Age 65 to 74
Disability Age 65 to 74 Comparison
Guamanians/Chamorros
New Zealanders
25.3%
DISABILITY AGE 65 TO 74
0.3/ 100
METRIC RATING
257th/ 347
METRIC RANK
22.9%
DISABILITY AGE 65 TO 74
79.9/ 100
METRIC RATING
148th/ 347
METRIC RANK
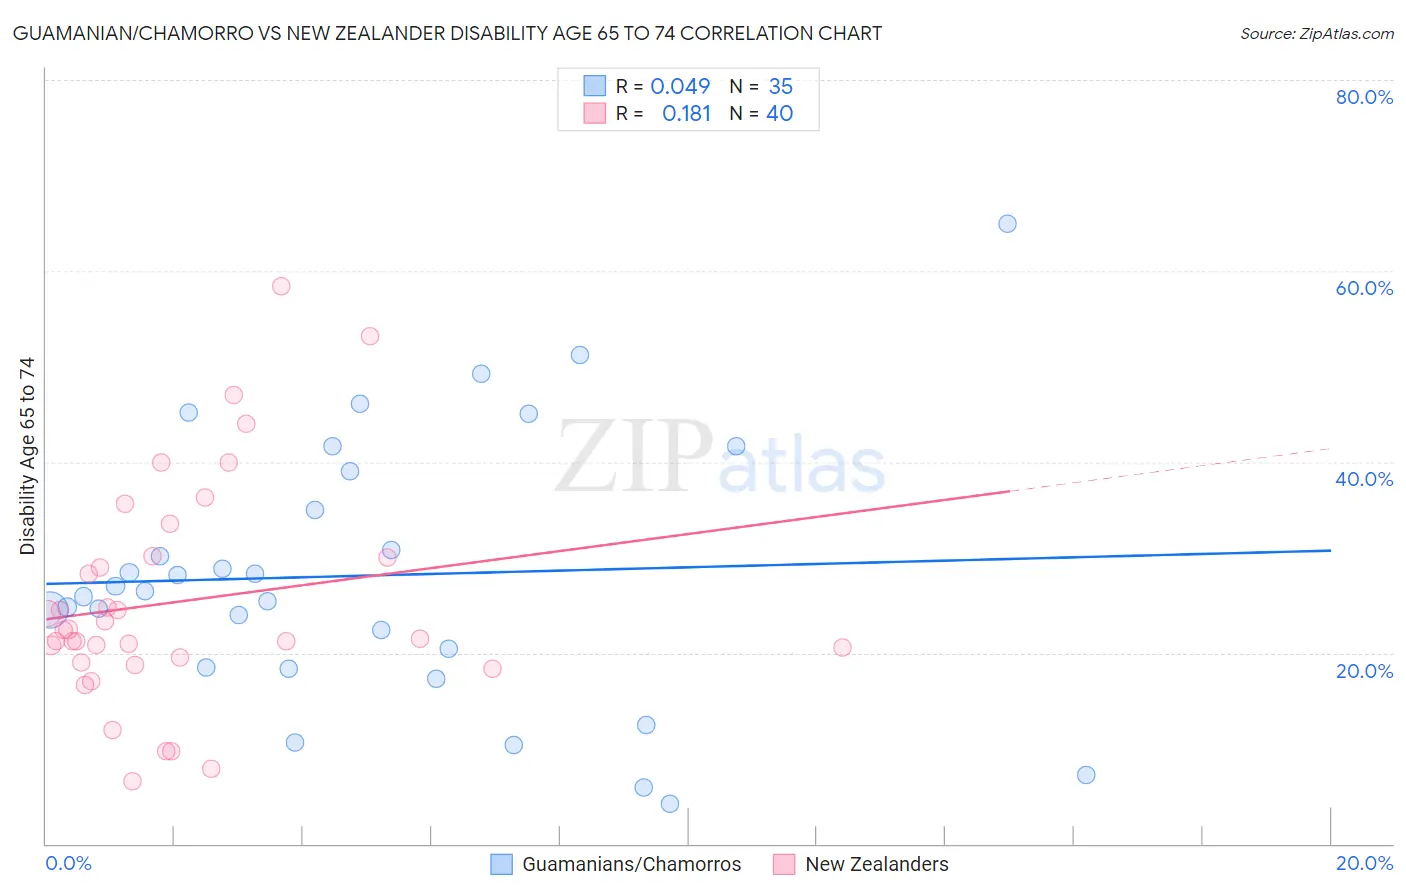
Guamanian/Chamorro vs New Zealander Disability Age 65 to 74 Correlation Chart
The statistical analysis conducted on geographies consisting of 221,467,649 people shows no correlation between the proportion of Guamanians/Chamorros and percentage of population with a disability between the ages 65 and 75 in the United States with a correlation coefficient (R) of 0.049 and weighted average of 25.3%. Similarly, the statistical analysis conducted on geographies consisting of 106,853,800 people shows a poor positive correlation between the proportion of New Zealanders and percentage of population with a disability between the ages 65 and 75 in the United States with a correlation coefficient (R) of 0.181 and weighted average of 22.9%, a difference of 10.5%.
Disability Age 65 to 74 Correlation Summary
| Measurement | Guamanian/Chamorro | New Zealander |
| Minimum | 4.2% | 6.6% |
| Maximum | 65.0% | 58.3% |
| Range | 60.8% | 51.8% |
| Mean | 28.1% | 25.4% |
| Median | 26.4% | 21.9% |
| Interquartile 25% (IQ1) | 18.5% | 19.2% |
| Interquartile 75% (IQ3) | 39.0% | 30.1% |
| Interquartile Range (IQR) | 20.5% | 10.8% |
| Standard Deviation (Sample) | 14.0% | 11.7% |
| Standard Deviation (Population) | 13.8% | 11.5% |
Similar Demographics by Disability Age 65 to 74
Demographics Similar to Guamanians/Chamorros by Disability Age 65 to 74
In terms of disability age 65 to 74, the demographic groups most similar to Guamanians/Chamorros are Marshallese (25.3%, a difference of 0.060%), Immigrants from Cambodia (25.3%, a difference of 0.15%), Immigrants from Somalia (25.2%, a difference of 0.17%), Malaysian (25.4%, a difference of 0.47%), and Cape Verdean (25.4%, a difference of 0.55%).
| Demographics | Rating | Rank | Disability Age 65 to 74 |
| Salvadorans | 0.8 /100 | #250 | Tragic 25.0% |
| Immigrants | Nonimmigrants | 0.7 /100 | #251 | Tragic 25.0% |
| Immigrants | El Salvador | 0.6 /100 | #252 | Tragic 25.1% |
| Sub-Saharan Africans | 0.6 /100 | #253 | Tragic 25.1% |
| Somalis | 0.6 /100 | #254 | Tragic 25.1% |
| Central Americans | 0.5 /100 | #255 | Tragic 25.1% |
| Immigrants | Somalia | 0.4 /100 | #256 | Tragic 25.2% |
| Guamanians/Chamorros | 0.3 /100 | #257 | Tragic 25.3% |
| Marshallese | 0.3 /100 | #258 | Tragic 25.3% |
| Immigrants | Cambodia | 0.3 /100 | #259 | Tragic 25.3% |
| Malaysians | 0.2 /100 | #260 | Tragic 25.4% |
| Cape Verdeans | 0.2 /100 | #261 | Tragic 25.4% |
| Samoans | 0.2 /100 | #262 | Tragic 25.4% |
| Iroquois | 0.2 /100 | #263 | Tragic 25.4% |
| Hawaiians | 0.2 /100 | #264 | Tragic 25.5% |
Demographics Similar to New Zealanders by Disability Age 65 to 74
In terms of disability age 65 to 74, the demographic groups most similar to New Zealanders are Swiss (22.9%, a difference of 0.020%), Canadian (22.9%, a difference of 0.20%), Immigrants from Morocco (22.9%, a difference of 0.20%), Finnish (22.9%, a difference of 0.29%), and Immigrants from Uzbekistan (22.8%, a difference of 0.32%).
| Demographics | Rating | Rank | Disability Age 65 to 74 |
| Belgians | 85.3 /100 | #141 | Excellent 22.7% |
| Immigrants | Ethiopia | 85.3 /100 | #142 | Excellent 22.7% |
| Arabs | 84.8 /100 | #143 | Excellent 22.8% |
| Danes | 84.4 /100 | #144 | Excellent 22.8% |
| Immigrants | Uganda | 84.0 /100 | #145 | Excellent 22.8% |
| Alsatians | 83.7 /100 | #146 | Excellent 22.8% |
| Immigrants | Uzbekistan | 83.1 /100 | #147 | Excellent 22.8% |
| New Zealanders | 79.9 /100 | #148 | Good 22.9% |
| Swiss | 79.7 /100 | #149 | Good 22.9% |
| Canadians | 77.7 /100 | #150 | Good 22.9% |
| Immigrants | Morocco | 77.6 /100 | #151 | Good 22.9% |
| Finns | 76.5 /100 | #152 | Good 22.9% |
| Slavs | 75.2 /100 | #153 | Good 23.0% |
| Sri Lankans | 74.0 /100 | #154 | Good 23.0% |
| British | 73.9 /100 | #155 | Good 23.0% |