Guamanian/Chamorro vs Cambodian Disability Age 65 to 74
COMPARE
Guamanian/Chamorro
Cambodian
Disability Age 65 to 74
Disability Age 65 to 74 Comparison
Guamanians/Chamorros
Cambodians
25.3%
DISABILITY AGE 65 TO 74
0.3/ 100
METRIC RATING
257th/ 347
METRIC RANK
21.8%
DISABILITY AGE 65 TO 74
99.0/ 100
METRIC RATING
74th/ 347
METRIC RANK
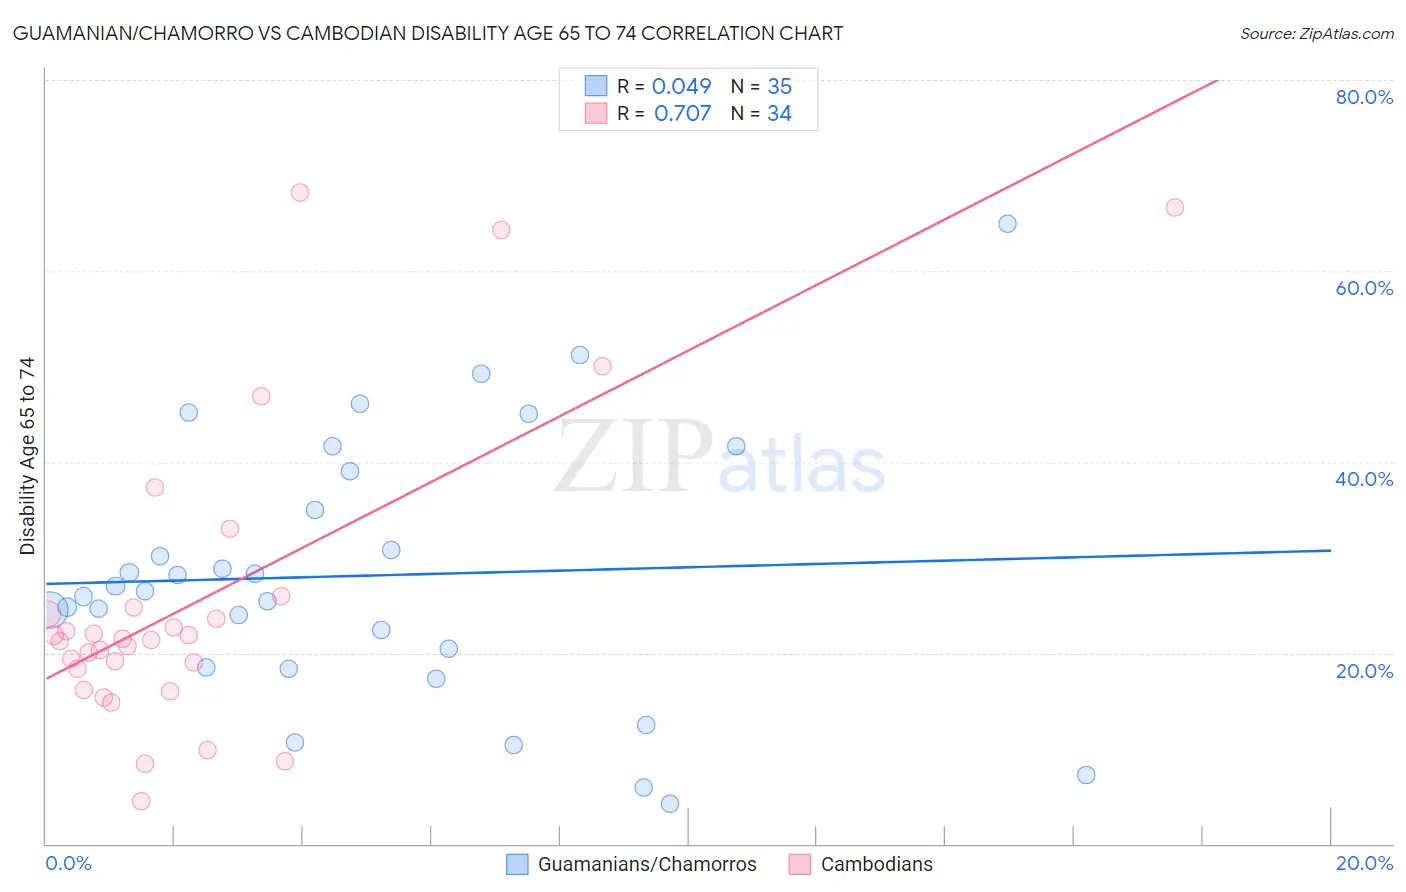
Guamanian/Chamorro vs Cambodian Disability Age 65 to 74 Correlation Chart
The statistical analysis conducted on geographies consisting of 221,467,649 people shows no correlation between the proportion of Guamanians/Chamorros and percentage of population with a disability between the ages 65 and 75 in the United States with a correlation coefficient (R) of 0.049 and weighted average of 25.3%. Similarly, the statistical analysis conducted on geographies consisting of 102,419,029 people shows a strong positive correlation between the proportion of Cambodians and percentage of population with a disability between the ages 65 and 75 in the United States with a correlation coefficient (R) of 0.707 and weighted average of 21.8%, a difference of 16.2%.
Disability Age 65 to 74 Correlation Summary
| Measurement | Guamanian/Chamorro | Cambodian |
| Minimum | 4.2% | 4.4% |
| Maximum | 65.0% | 68.2% |
| Range | 60.8% | 63.8% |
| Mean | 28.1% | 25.6% |
| Median | 26.4% | 21.4% |
| Interquartile 25% (IQ1) | 18.5% | 18.3% |
| Interquartile 75% (IQ3) | 39.0% | 24.7% |
| Interquartile Range (IQR) | 20.5% | 6.4% |
| Standard Deviation (Sample) | 14.0% | 15.9% |
| Standard Deviation (Population) | 13.8% | 15.6% |
Similar Demographics by Disability Age 65 to 74
Demographics Similar to Guamanians/Chamorros by Disability Age 65 to 74
In terms of disability age 65 to 74, the demographic groups most similar to Guamanians/Chamorros are Marshallese (25.3%, a difference of 0.060%), Immigrants from Cambodia (25.3%, a difference of 0.15%), Immigrants from Somalia (25.2%, a difference of 0.17%), Malaysian (25.4%, a difference of 0.47%), and Cape Verdean (25.4%, a difference of 0.55%).
| Demographics | Rating | Rank | Disability Age 65 to 74 |
| Salvadorans | 0.8 /100 | #250 | Tragic 25.0% |
| Immigrants | Nonimmigrants | 0.7 /100 | #251 | Tragic 25.0% |
| Immigrants | El Salvador | 0.6 /100 | #252 | Tragic 25.1% |
| Sub-Saharan Africans | 0.6 /100 | #253 | Tragic 25.1% |
| Somalis | 0.6 /100 | #254 | Tragic 25.1% |
| Central Americans | 0.5 /100 | #255 | Tragic 25.1% |
| Immigrants | Somalia | 0.4 /100 | #256 | Tragic 25.2% |
| Guamanians/Chamorros | 0.3 /100 | #257 | Tragic 25.3% |
| Marshallese | 0.3 /100 | #258 | Tragic 25.3% |
| Immigrants | Cambodia | 0.3 /100 | #259 | Tragic 25.3% |
| Malaysians | 0.2 /100 | #260 | Tragic 25.4% |
| Cape Verdeans | 0.2 /100 | #261 | Tragic 25.4% |
| Samoans | 0.2 /100 | #262 | Tragic 25.4% |
| Iroquois | 0.2 /100 | #263 | Tragic 25.4% |
| Hawaiians | 0.2 /100 | #264 | Tragic 25.5% |
Demographics Similar to Cambodians by Disability Age 65 to 74
In terms of disability age 65 to 74, the demographic groups most similar to Cambodians are Immigrants from Venezuela (21.8%, a difference of 0.010%), Mongolian (21.8%, a difference of 0.020%), Greek (21.8%, a difference of 0.030%), Immigrants from Poland (21.8%, a difference of 0.090%), and Immigrants from Eastern Europe (21.8%, a difference of 0.14%).
| Demographics | Rating | Rank | Disability Age 65 to 74 |
| Immigrants | South Africa | 99.3 /100 | #67 | Exceptional 21.7% |
| Immigrants | Scotland | 99.3 /100 | #68 | Exceptional 21.7% |
| Immigrants | Egypt | 99.2 /100 | #69 | Exceptional 21.7% |
| Chinese | 99.2 /100 | #70 | Exceptional 21.7% |
| Immigrants | Belarus | 99.2 /100 | #71 | Exceptional 21.7% |
| Immigrants | Hungary | 99.2 /100 | #72 | Exceptional 21.7% |
| Immigrants | Venezuela | 99.0 /100 | #73 | Exceptional 21.8% |
| Cambodians | 99.0 /100 | #74 | Exceptional 21.8% |
| Mongolians | 99.0 /100 | #75 | Exceptional 21.8% |
| Greeks | 99.0 /100 | #76 | Exceptional 21.8% |
| Immigrants | Poland | 99.0 /100 | #77 | Exceptional 21.8% |
| Immigrants | Eastern Europe | 99.0 /100 | #78 | Exceptional 21.8% |
| Venezuelans | 99.0 /100 | #79 | Exceptional 21.8% |
| Immigrants | Norway | 98.9 /100 | #80 | Exceptional 21.8% |
| Croatians | 98.9 /100 | #81 | Exceptional 21.8% |