Guamanian/Chamorro vs Immigrants from Korea Disability Age 65 to 74
COMPARE
Guamanian/Chamorro
Immigrants from Korea
Disability Age 65 to 74
Disability Age 65 to 74 Comparison
Guamanians/Chamorros
Immigrants from Korea
25.3%
DISABILITY AGE 65 TO 74
0.3/ 100
METRIC RATING
257th/ 347
METRIC RANK
20.4%
DISABILITY AGE 65 TO 74
100.0/ 100
METRIC RATING
12th/ 347
METRIC RANK
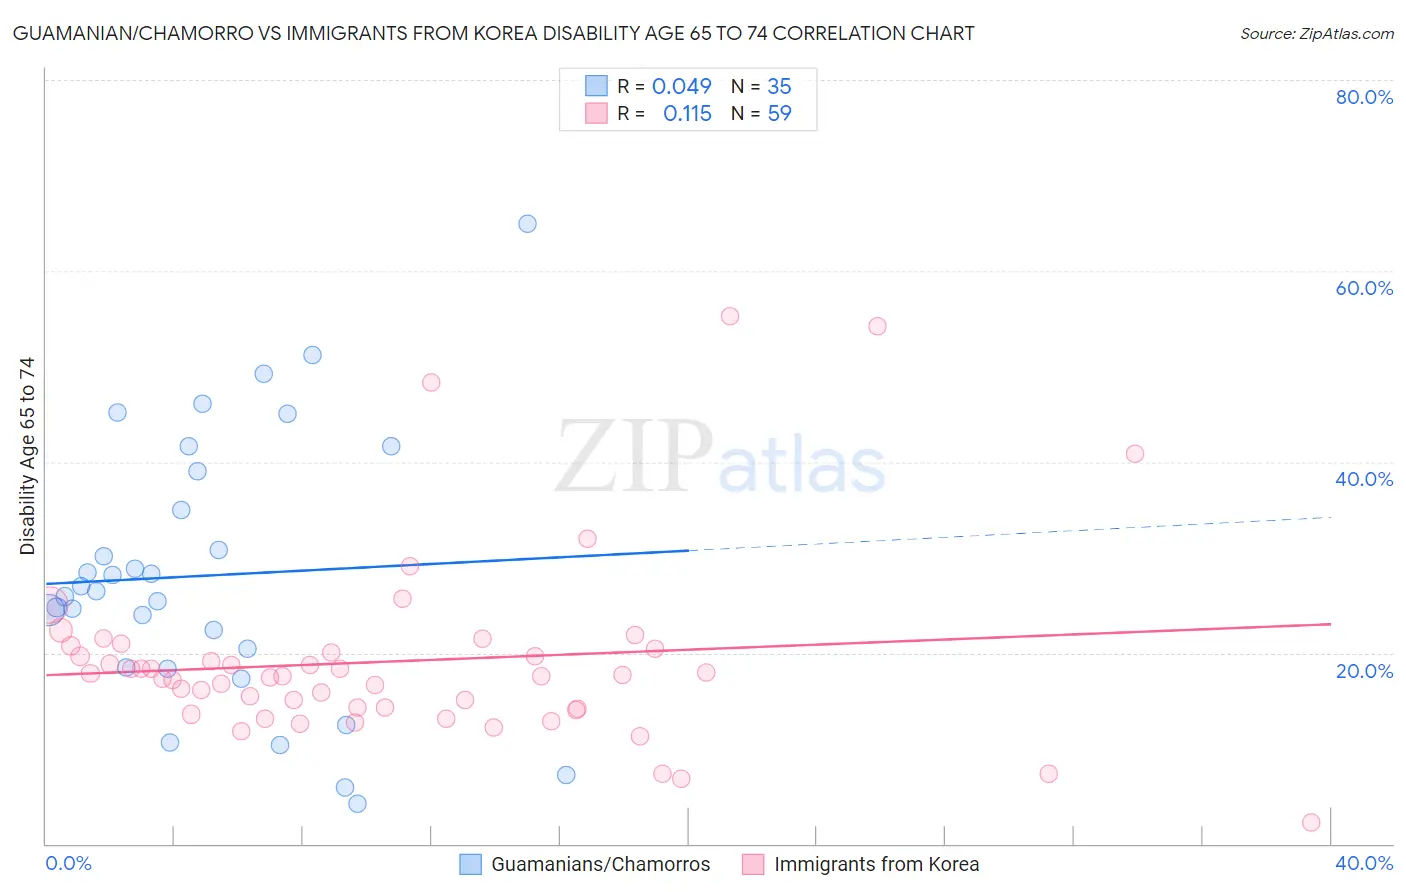
Guamanian/Chamorro vs Immigrants from Korea Disability Age 65 to 74 Correlation Chart
The statistical analysis conducted on geographies consisting of 221,467,649 people shows no correlation between the proportion of Guamanians/Chamorros and percentage of population with a disability between the ages 65 and 75 in the United States with a correlation coefficient (R) of 0.049 and weighted average of 25.3%. Similarly, the statistical analysis conducted on geographies consisting of 415,254,221 people shows a poor positive correlation between the proportion of Immigrants from Korea and percentage of population with a disability between the ages 65 and 75 in the United States with a correlation coefficient (R) of 0.115 and weighted average of 20.4%, a difference of 24.2%.
Disability Age 65 to 74 Correlation Summary
| Measurement | Guamanian/Chamorro | Immigrants from Korea |
| Minimum | 4.2% | 2.2% |
| Maximum | 65.0% | 55.2% |
| Range | 60.8% | 53.1% |
| Mean | 28.1% | 19.1% |
| Median | 26.4% | 17.5% |
| Interquartile 25% (IQ1) | 18.5% | 14.2% |
| Interquartile 75% (IQ3) | 39.0% | 20.4% |
| Interquartile Range (IQR) | 20.5% | 6.2% |
| Standard Deviation (Sample) | 14.0% | 9.8% |
| Standard Deviation (Population) | 13.8% | 9.7% |
Similar Demographics by Disability Age 65 to 74
Demographics Similar to Guamanians/Chamorros by Disability Age 65 to 74
In terms of disability age 65 to 74, the demographic groups most similar to Guamanians/Chamorros are Marshallese (25.3%, a difference of 0.060%), Immigrants from Cambodia (25.3%, a difference of 0.15%), Immigrants from Somalia (25.2%, a difference of 0.17%), Malaysian (25.4%, a difference of 0.47%), and Cape Verdean (25.4%, a difference of 0.55%).
| Demographics | Rating | Rank | Disability Age 65 to 74 |
| Salvadorans | 0.8 /100 | #250 | Tragic 25.0% |
| Immigrants | Nonimmigrants | 0.7 /100 | #251 | Tragic 25.0% |
| Immigrants | El Salvador | 0.6 /100 | #252 | Tragic 25.1% |
| Sub-Saharan Africans | 0.6 /100 | #253 | Tragic 25.1% |
| Somalis | 0.6 /100 | #254 | Tragic 25.1% |
| Central Americans | 0.5 /100 | #255 | Tragic 25.1% |
| Immigrants | Somalia | 0.4 /100 | #256 | Tragic 25.2% |
| Guamanians/Chamorros | 0.3 /100 | #257 | Tragic 25.3% |
| Marshallese | 0.3 /100 | #258 | Tragic 25.3% |
| Immigrants | Cambodia | 0.3 /100 | #259 | Tragic 25.3% |
| Malaysians | 0.2 /100 | #260 | Tragic 25.4% |
| Cape Verdeans | 0.2 /100 | #261 | Tragic 25.4% |
| Samoans | 0.2 /100 | #262 | Tragic 25.4% |
| Iroquois | 0.2 /100 | #263 | Tragic 25.4% |
| Hawaiians | 0.2 /100 | #264 | Tragic 25.5% |
Demographics Similar to Immigrants from Korea by Disability Age 65 to 74
In terms of disability age 65 to 74, the demographic groups most similar to Immigrants from Korea are Immigrants from Ireland (20.3%, a difference of 0.21%), Immigrants from Eastern Asia (20.3%, a difference of 0.37%), Immigrants from Singapore (20.4%, a difference of 0.38%), Immigrants from China (20.3%, a difference of 0.45%), and Indian (Asian) (20.5%, a difference of 0.86%).
| Demographics | Rating | Rank | Disability Age 65 to 74 |
| Immigrants | Israel | 100.0 /100 | #5 | Exceptional 19.9% |
| Iranians | 100.0 /100 | #6 | Exceptional 19.9% |
| Cypriots | 100.0 /100 | #7 | Exceptional 20.1% |
| Thais | 100.0 /100 | #8 | Exceptional 20.1% |
| Immigrants | China | 100.0 /100 | #9 | Exceptional 20.3% |
| Immigrants | Eastern Asia | 100.0 /100 | #10 | Exceptional 20.3% |
| Immigrants | Ireland | 100.0 /100 | #11 | Exceptional 20.3% |
| Immigrants | Korea | 100.0 /100 | #12 | Exceptional 20.4% |
| Immigrants | Singapore | 100.0 /100 | #13 | Exceptional 20.4% |
| Indians (Asian) | 100.0 /100 | #14 | Exceptional 20.5% |
| Paraguayans | 100.0 /100 | #15 | Exceptional 20.5% |
| Immigrants | Lithuania | 100.0 /100 | #16 | Exceptional 20.5% |
| Immigrants | South Central Asia | 100.0 /100 | #17 | Exceptional 20.6% |
| Eastern Europeans | 100.0 /100 | #18 | Exceptional 20.6% |
| Burmese | 100.0 /100 | #19 | Exceptional 20.6% |