Guamanian/Chamorro vs Arapaho Disability Age 65 to 74
COMPARE
Guamanian/Chamorro
Arapaho
Disability Age 65 to 74
Disability Age 65 to 74 Comparison
Guamanians/Chamorros
Arapaho
25.3%
DISABILITY AGE 65 TO 74
0.3/ 100
METRIC RATING
257th/ 347
METRIC RANK
28.1%
DISABILITY AGE 65 TO 74
0.0/ 100
METRIC RATING
319th/ 347
METRIC RANK
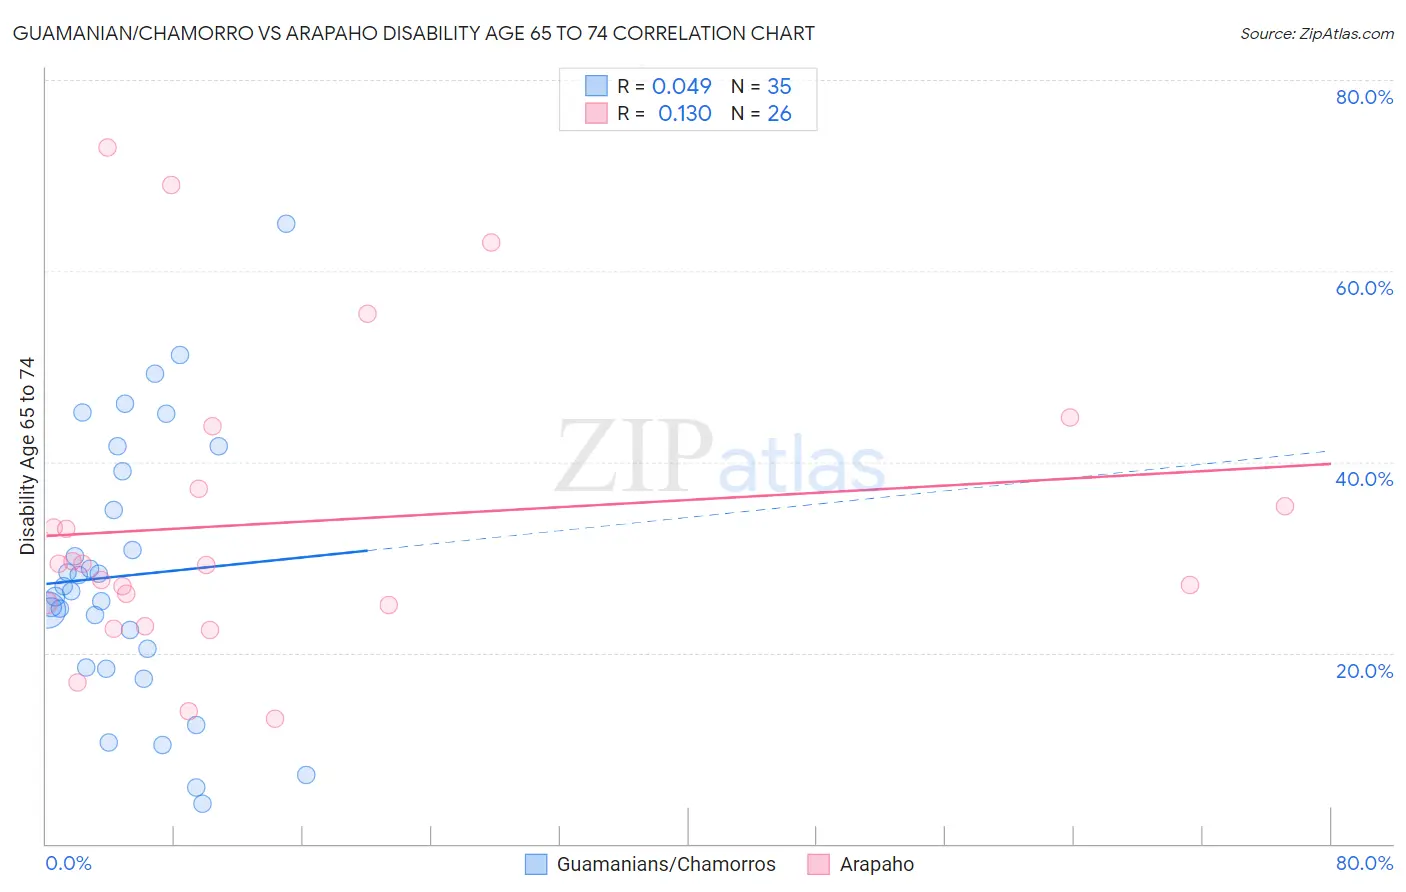
Guamanian/Chamorro vs Arapaho Disability Age 65 to 74 Correlation Chart
The statistical analysis conducted on geographies consisting of 221,467,649 people shows no correlation between the proportion of Guamanians/Chamorros and percentage of population with a disability between the ages 65 and 75 in the United States with a correlation coefficient (R) of 0.049 and weighted average of 25.3%. Similarly, the statistical analysis conducted on geographies consisting of 29,768,926 people shows a poor positive correlation between the proportion of Arapaho and percentage of population with a disability between the ages 65 and 75 in the United States with a correlation coefficient (R) of 0.130 and weighted average of 28.1%, a difference of 11.1%.
Disability Age 65 to 74 Correlation Summary
| Measurement | Guamanian/Chamorro | Arapaho |
| Minimum | 4.2% | 13.0% |
| Maximum | 65.0% | 72.9% |
| Range | 60.8% | 59.9% |
| Mean | 28.1% | 33.6% |
| Median | 26.4% | 29.2% |
| Interquartile 25% (IQ1) | 18.5% | 25.0% |
| Interquartile 75% (IQ3) | 39.0% | 37.2% |
| Interquartile Range (IQR) | 20.5% | 12.2% |
| Standard Deviation (Sample) | 14.0% | 15.8% |
| Standard Deviation (Population) | 13.8% | 15.5% |
Similar Demographics by Disability Age 65 to 74
Demographics Similar to Guamanians/Chamorros by Disability Age 65 to 74
In terms of disability age 65 to 74, the demographic groups most similar to Guamanians/Chamorros are Marshallese (25.3%, a difference of 0.060%), Immigrants from Cambodia (25.3%, a difference of 0.15%), Immigrants from Somalia (25.2%, a difference of 0.17%), Malaysian (25.4%, a difference of 0.47%), and Cape Verdean (25.4%, a difference of 0.55%).
| Demographics | Rating | Rank | Disability Age 65 to 74 |
| Salvadorans | 0.8 /100 | #250 | Tragic 25.0% |
| Immigrants | Nonimmigrants | 0.7 /100 | #251 | Tragic 25.0% |
| Immigrants | El Salvador | 0.6 /100 | #252 | Tragic 25.1% |
| Sub-Saharan Africans | 0.6 /100 | #253 | Tragic 25.1% |
| Somalis | 0.6 /100 | #254 | Tragic 25.1% |
| Central Americans | 0.5 /100 | #255 | Tragic 25.1% |
| Immigrants | Somalia | 0.4 /100 | #256 | Tragic 25.2% |
| Guamanians/Chamorros | 0.3 /100 | #257 | Tragic 25.3% |
| Marshallese | 0.3 /100 | #258 | Tragic 25.3% |
| Immigrants | Cambodia | 0.3 /100 | #259 | Tragic 25.3% |
| Malaysians | 0.2 /100 | #260 | Tragic 25.4% |
| Cape Verdeans | 0.2 /100 | #261 | Tragic 25.4% |
| Samoans | 0.2 /100 | #262 | Tragic 25.4% |
| Iroquois | 0.2 /100 | #263 | Tragic 25.4% |
| Hawaiians | 0.2 /100 | #264 | Tragic 25.5% |
Demographics Similar to Arapaho by Disability Age 65 to 74
In terms of disability age 65 to 74, the demographic groups most similar to Arapaho are Nepalese (28.0%, a difference of 0.23%), Cherokee (28.2%, a difference of 0.39%), Immigrants from Armenia (28.0%, a difference of 0.45%), Crow (27.9%, a difference of 0.54%), and Cajun (27.9%, a difference of 0.58%).
| Demographics | Rating | Rank | Disability Age 65 to 74 |
| Osage | 0.0 /100 | #312 | Tragic 27.5% |
| Paiute | 0.0 /100 | #313 | Tragic 27.8% |
| Chippewa | 0.0 /100 | #314 | Tragic 27.8% |
| Cajuns | 0.0 /100 | #315 | Tragic 27.9% |
| Crow | 0.0 /100 | #316 | Tragic 27.9% |
| Immigrants | Armenia | 0.0 /100 | #317 | Tragic 28.0% |
| Nepalese | 0.0 /100 | #318 | Tragic 28.0% |
| Arapaho | 0.0 /100 | #319 | Tragic 28.1% |
| Cherokee | 0.0 /100 | #320 | Tragic 28.2% |
| Comanche | 0.0 /100 | #321 | Tragic 28.3% |
| Aleuts | 0.0 /100 | #322 | Tragic 28.4% |
| Puerto Ricans | 0.0 /100 | #323 | Tragic 29.1% |
| Seminole | 0.0 /100 | #324 | Tragic 29.4% |
| Dutch West Indians | 0.0 /100 | #325 | Tragic 29.6% |
| Yakama | 0.0 /100 | #326 | Tragic 29.6% |