Cherokee vs Australian Disability
COMPARE
Cherokee
Australian
Disability
Disability Comparison
Cherokee
Australians
14.8%
DISABILITY
0.0/ 100
METRIC RATING
336th/ 347
METRIC RANK
11.5%
DISABILITY
82.5/ 100
METRIC RATING
144th/ 347
METRIC RANK
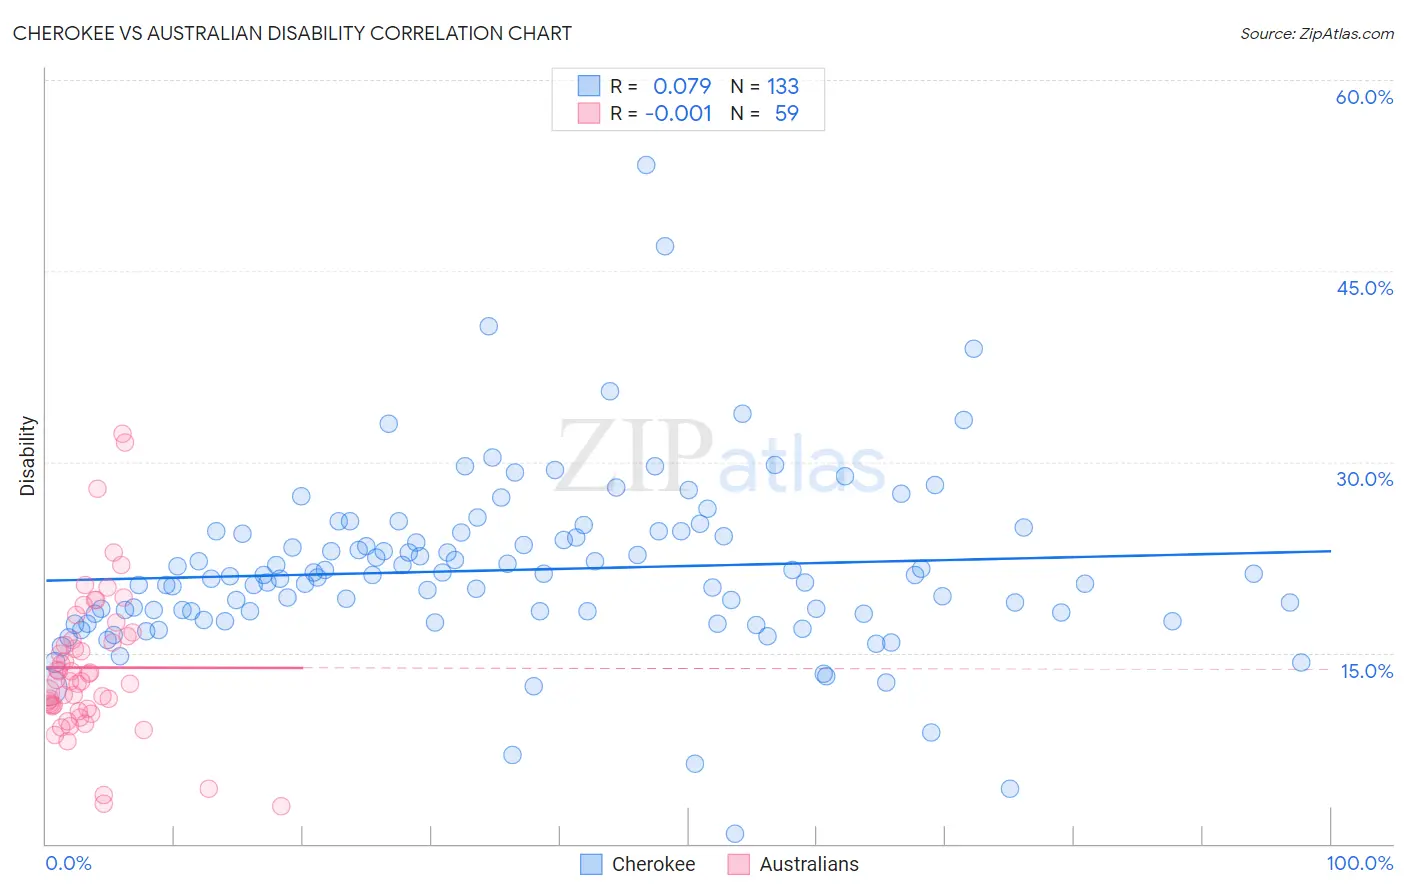
Cherokee vs Australian Disability Correlation Chart
The statistical analysis conducted on geographies consisting of 493,590,600 people shows a slight positive correlation between the proportion of Cherokee and percentage of population with a disability in the United States with a correlation coefficient (R) of 0.079 and weighted average of 14.8%. Similarly, the statistical analysis conducted on geographies consisting of 224,142,596 people shows no correlation between the proportion of Australians and percentage of population with a disability in the United States with a correlation coefficient (R) of -0.001 and weighted average of 11.5%, a difference of 29.1%.
Disability Correlation Summary
| Measurement | Cherokee | Australian |
| Minimum | 0.80% | 2.9% |
| Maximum | 53.3% | 32.3% |
| Range | 52.5% | 29.3% |
| Mean | 21.5% | 13.8% |
| Median | 21.0% | 12.8% |
| Interquartile 25% (IQ1) | 18.0% | 10.6% |
| Interquartile 75% (IQ3) | 24.4% | 16.3% |
| Interquartile Range (IQR) | 6.4% | 5.7% |
| Standard Deviation (Sample) | 6.9% | 5.8% |
| Standard Deviation (Population) | 6.9% | 5.8% |
Similar Demographics by Disability
Demographics Similar to Cherokee by Disability
In terms of disability, the demographic groups most similar to Cherokee are Seminole (14.9%, a difference of 0.090%), Dutch West Indian (14.9%, a difference of 0.39%), Tohono O'odham (14.8%, a difference of 0.51%), Yuman (14.6%, a difference of 1.5%), and Cajun (14.6%, a difference of 1.7%).
| Demographics | Rating | Rank | Disability |
| Potawatomi | 0.0 /100 | #329 | Tragic 14.2% |
| Navajo | 0.0 /100 | #330 | Tragic 14.3% |
| Alaskan Athabascans | 0.0 /100 | #331 | Tragic 14.4% |
| Pueblo | 0.0 /100 | #332 | Tragic 14.4% |
| Cajuns | 0.0 /100 | #333 | Tragic 14.6% |
| Yuman | 0.0 /100 | #334 | Tragic 14.6% |
| Tohono O'odham | 0.0 /100 | #335 | Tragic 14.8% |
| Cherokee | 0.0 /100 | #336 | Tragic 14.8% |
| Seminole | 0.0 /100 | #337 | Tragic 14.9% |
| Dutch West Indians | 0.0 /100 | #338 | Tragic 14.9% |
| Chickasaw | 0.0 /100 | #339 | Tragic 15.2% |
| Choctaw | 0.0 /100 | #340 | Tragic 15.4% |
| Lumbee | 0.0 /100 | #341 | Tragic 15.5% |
| Kiowa | 0.0 /100 | #342 | Tragic 15.6% |
| Creek | 0.0 /100 | #343 | Tragic 15.6% |
Demographics Similar to Australians by Disability
In terms of disability, the demographic groups most similar to Australians are Moroccan (11.5%, a difference of 0.070%), Nigerian (11.5%, a difference of 0.090%), Immigrants from Sudan (11.5%, a difference of 0.24%), Immigrants from Hungary (11.5%, a difference of 0.25%), and Immigrants from Grenada (11.5%, a difference of 0.31%).
| Demographics | Rating | Rank | Disability |
| Kenyans | 87.1 /100 | #137 | Excellent 11.5% |
| New Zealanders | 87.0 /100 | #138 | Excellent 11.5% |
| Ghanaians | 87.0 /100 | #139 | Excellent 11.5% |
| Russians | 86.8 /100 | #140 | Excellent 11.5% |
| Immigrants | Grenada | 86.1 /100 | #141 | Excellent 11.5% |
| Immigrants | Sudan | 85.3 /100 | #142 | Excellent 11.5% |
| Moroccans | 83.3 /100 | #143 | Excellent 11.5% |
| Australians | 82.5 /100 | #144 | Excellent 11.5% |
| Nigerians | 81.3 /100 | #145 | Excellent 11.5% |
| Immigrants | Hungary | 79.0 /100 | #146 | Good 11.5% |
| Immigrants | Ukraine | 77.6 /100 | #147 | Good 11.5% |
| Sudanese | 77.1 /100 | #148 | Good 11.5% |
| Immigrants | Norway | 73.2 /100 | #149 | Good 11.6% |
| Romanians | 72.7 /100 | #150 | Good 11.6% |
| Immigrants | Kenya | 72.1 /100 | #151 | Good 11.6% |