Cherokee vs Immigrants from Fiji Disability
COMPARE
Cherokee
Immigrants from Fiji
Disability
Disability Comparison
Cherokee
Immigrants from Fiji
14.8%
DISABILITY
0.0/ 100
METRIC RATING
336th/ 347
METRIC RANK
11.6%
DISABILITY
69.5/ 100
METRIC RATING
156th/ 347
METRIC RANK
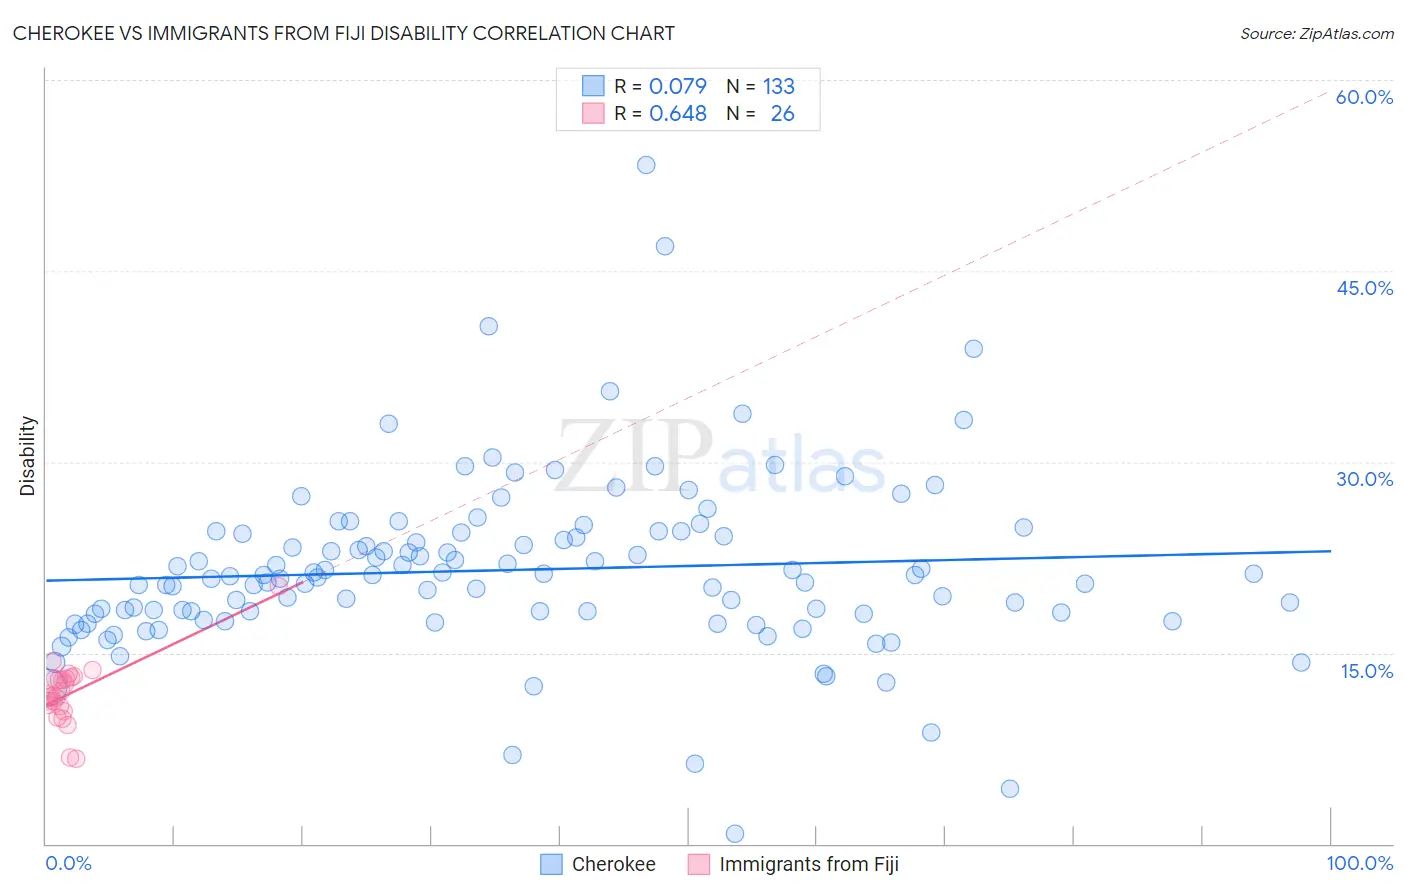
Cherokee vs Immigrants from Fiji Disability Correlation Chart
The statistical analysis conducted on geographies consisting of 493,590,600 people shows a slight positive correlation between the proportion of Cherokee and percentage of population with a disability in the United States with a correlation coefficient (R) of 0.079 and weighted average of 14.8%. Similarly, the statistical analysis conducted on geographies consisting of 93,755,847 people shows a significant positive correlation between the proportion of Immigrants from Fiji and percentage of population with a disability in the United States with a correlation coefficient (R) of 0.648 and weighted average of 11.6%, a difference of 28.1%.
Disability Correlation Summary
| Measurement | Cherokee | Immigrants from Fiji |
| Minimum | 0.80% | 6.6% |
| Maximum | 53.3% | 20.2% |
| Range | 52.5% | 13.6% |
| Mean | 21.5% | 11.8% |
| Median | 21.0% | 11.6% |
| Interquartile 25% (IQ1) | 18.0% | 10.8% |
| Interquartile 75% (IQ3) | 24.4% | 13.0% |
| Interquartile Range (IQR) | 6.4% | 2.2% |
| Standard Deviation (Sample) | 6.9% | 2.5% |
| Standard Deviation (Population) | 6.9% | 2.5% |
Similar Demographics by Disability
Demographics Similar to Cherokee by Disability
In terms of disability, the demographic groups most similar to Cherokee are Seminole (14.9%, a difference of 0.090%), Dutch West Indian (14.9%, a difference of 0.39%), Tohono O'odham (14.8%, a difference of 0.51%), Yuman (14.6%, a difference of 1.5%), and Cajun (14.6%, a difference of 1.7%).
| Demographics | Rating | Rank | Disability |
| Potawatomi | 0.0 /100 | #329 | Tragic 14.2% |
| Navajo | 0.0 /100 | #330 | Tragic 14.3% |
| Alaskan Athabascans | 0.0 /100 | #331 | Tragic 14.4% |
| Pueblo | 0.0 /100 | #332 | Tragic 14.4% |
| Cajuns | 0.0 /100 | #333 | Tragic 14.6% |
| Yuman | 0.0 /100 | #334 | Tragic 14.6% |
| Tohono O'odham | 0.0 /100 | #335 | Tragic 14.8% |
| Cherokee | 0.0 /100 | #336 | Tragic 14.8% |
| Seminole | 0.0 /100 | #337 | Tragic 14.9% |
| Dutch West Indians | 0.0 /100 | #338 | Tragic 14.9% |
| Chickasaw | 0.0 /100 | #339 | Tragic 15.2% |
| Choctaw | 0.0 /100 | #340 | Tragic 15.4% |
| Lumbee | 0.0 /100 | #341 | Tragic 15.5% |
| Kiowa | 0.0 /100 | #342 | Tragic 15.6% |
| Creek | 0.0 /100 | #343 | Tragic 15.6% |
Demographics Similar to Immigrants from Fiji by Disability
In terms of disability, the demographic groups most similar to Immigrants from Fiji are Immigrants from Middle Africa (11.6%, a difference of 0.0%), Immigrants from Netherlands (11.6%, a difference of 0.010%), Immigrants from Ghana (11.6%, a difference of 0.090%), Immigrants from Guatemala (11.6%, a difference of 0.090%), and Immigrants from Kenya (11.6%, a difference of 0.14%).
| Demographics | Rating | Rank | Disability |
| Immigrants | Norway | 73.2 /100 | #149 | Good 11.6% |
| Romanians | 72.7 /100 | #150 | Good 11.6% |
| Immigrants | Kenya | 72.1 /100 | #151 | Good 11.6% |
| Immigrants | Moldova | 72.0 /100 | #152 | Good 11.6% |
| Immigrants | Ghana | 71.2 /100 | #153 | Good 11.6% |
| Immigrants | Guatemala | 71.1 /100 | #154 | Good 11.6% |
| Immigrants | Netherlands | 69.8 /100 | #155 | Good 11.6% |
| Immigrants | Fiji | 69.5 /100 | #156 | Good 11.6% |
| Immigrants | Middle Africa | 69.5 /100 | #157 | Good 11.6% |
| Armenians | 65.9 /100 | #158 | Good 11.6% |
| Guatemalans | 65.1 /100 | #159 | Good 11.6% |
| Immigrants | Barbados | 64.2 /100 | #160 | Good 11.6% |
| Immigrants | Cuba | 62.8 /100 | #161 | Good 11.6% |
| Immigrants | Haiti | 59.2 /100 | #162 | Average 11.7% |
| Immigrants | Trinidad and Tobago | 58.9 /100 | #163 | Average 11.7% |