Zip Codes with the Highest Percentage of Population Employed in Sales & Related in Brighton, CO
RELATED REPORTS & OPTIONS
Sales & Related
Brighton
Compare Zip Codes
Map of Zip Codes with the Highest Percentage of Population Employed in Sales & Related in Brighton
10.1%
11.2%
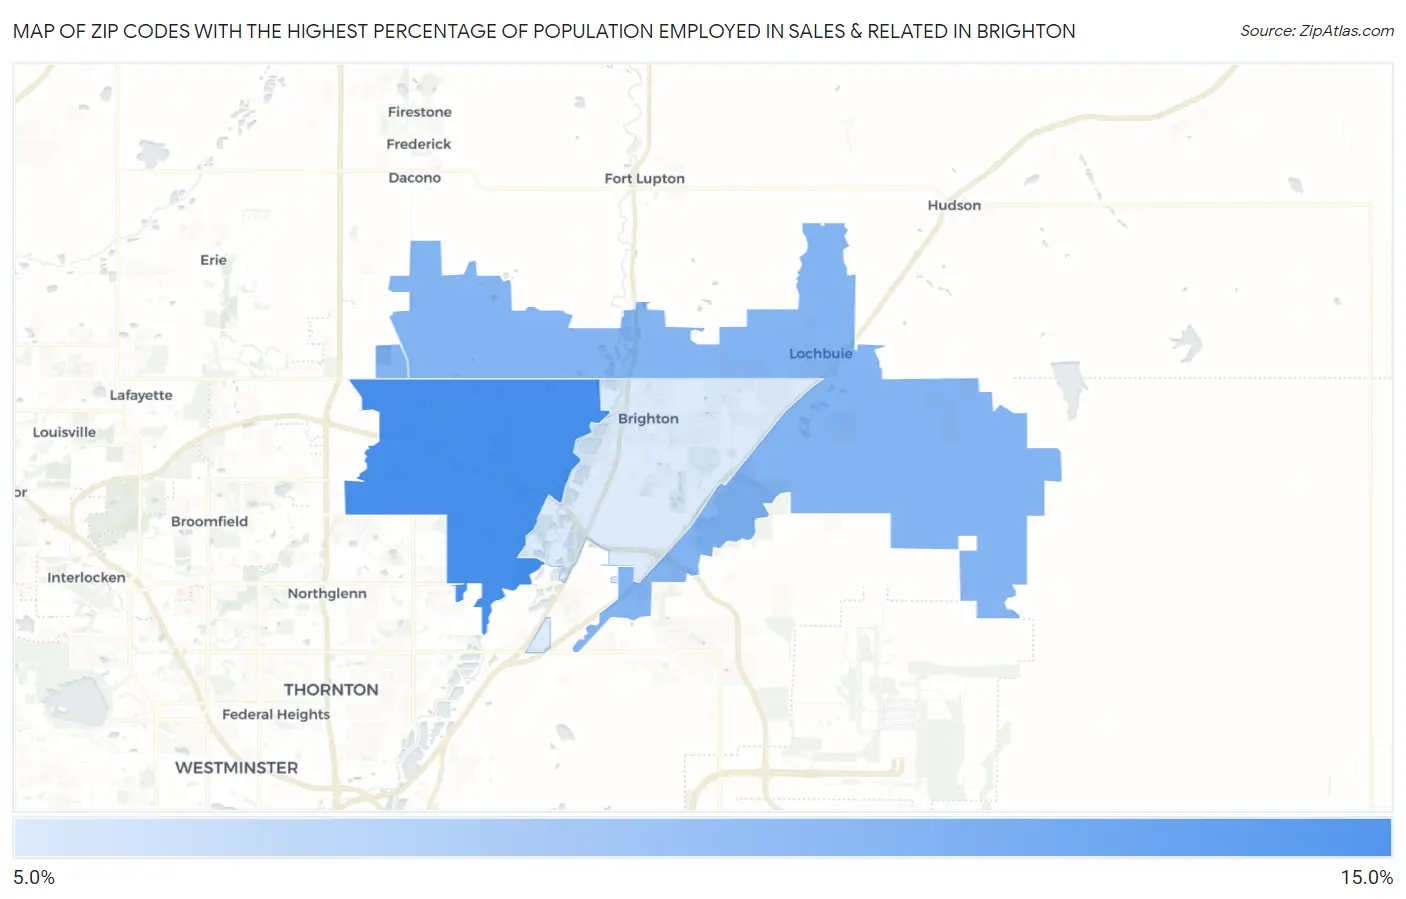
Zip Codes with the Highest Percentage of Population Employed in Sales & Related in Brighton, CO
| Zip Code | % Employed | vs State | vs National | |
| 1. | 80602 | 11.2% | 9.9%(+1.28)#132 | 9.6%(+1.56)#7,820 |
| 2. | 80603 | 10.7% | 9.9%(+0.872)#147 | 9.6%(+1.15)#8,852 |
| 3. | 80601 | 10.1% | 9.9%(+0.258)#183 | 9.6%(+0.537)#10,619 |
1
Common Questions
What are the Top Zip Codes with the Highest Percentage of Population Employed in Sales & Related in Brighton, CO?
Top Zip Codes with the Highest Percentage of Population Employed in Sales & Related in Brighton, CO are:
What zip code has the Highest Percentage of Population Employed in Sales & Related in Brighton, CO?
80602 has the Highest Percentage of Population Employed in Sales & Related in Brighton, CO with 11.2%.
What is the Percentage of Population Employed in Sales & Related in Brighton, CO?
Percentage of Population Employed in Sales & Related in Brighton is 10.0%.
What is the Percentage of Population Employed in Sales & Related in Colorado?
Percentage of Population Employed in Sales & Related in Colorado is 9.9%.
What is the Percentage of Population Employed in Sales & Related in the United States?
Percentage of Population Employed in Sales & Related in the United States is 9.6%.