Zip Codes with the Highest Percentage of Population Employed in Administrative & Support Services in Brighton, CO
RELATED REPORTS & OPTIONS
Administrative & Support Services
Brighton
Compare Zip Codes
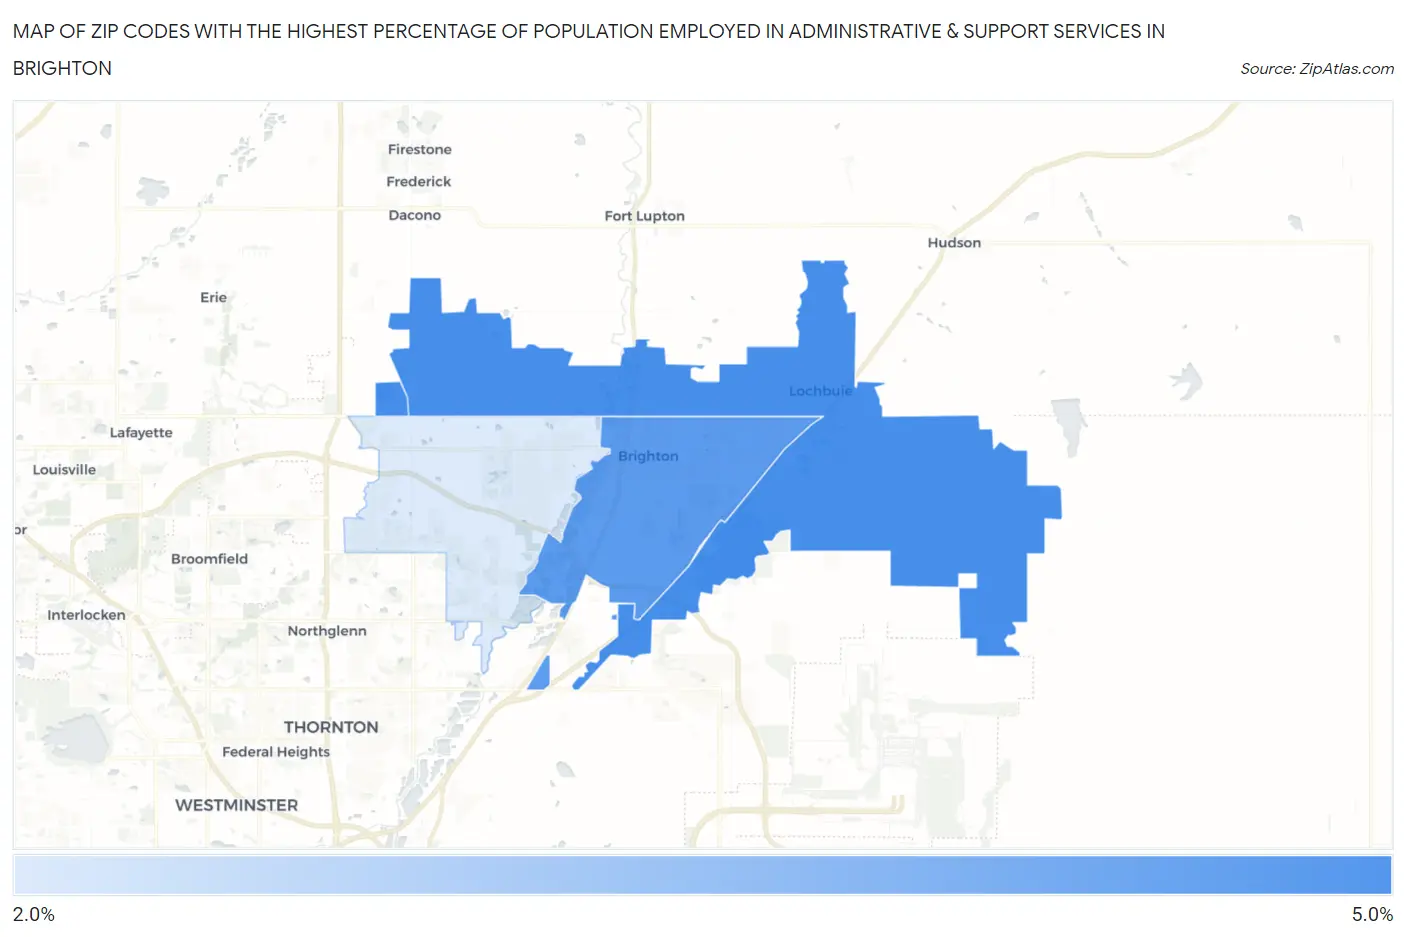
Map of Zip Codes with the Highest Percentage of Population Employed in Administrative & Support Services in Brighton
2.6%
4.5%
Zip Codes with the Highest Percentage of Population Employed in Administrative & Support Services in Brighton, CO
| Zip Code | % Employed | vs State | vs National | |
| 1. | 80603 | 4.5% | 4.1%(+0.451)#136 | 4.1%(+0.393)#8,578 |
| 2. | 80601 | 4.3% | 4.1%(+0.189)#150 | 4.1%(+0.131)#9,521 |
| 3. | 80602 | 2.6% | 4.1%(-1.47)#274 | 4.1%(-1.53)#17,503 |
1
Common Questions
What are the Top Zip Codes with the Highest Percentage of Population Employed in Administrative & Support Services in Brighton, CO?
Top Zip Codes with the Highest Percentage of Population Employed in Administrative & Support Services in Brighton, CO are:
What zip code has the Highest Percentage of Population Employed in Administrative & Support Services in Brighton, CO?
80603 has the Highest Percentage of Population Employed in Administrative & Support Services in Brighton, CO with 4.5%.
What is the Percentage of Population Employed in Administrative & Support Services in Brighton, CO?
Percentage of Population Employed in Administrative & Support Services in Brighton is 4.3%.
What is the Percentage of Population Employed in Administrative & Support Services in Colorado?
Percentage of Population Employed in Administrative & Support Services in Colorado is 4.1%.
What is the Percentage of Population Employed in Administrative & Support Services in the United States?
Percentage of Population Employed in Administrative & Support Services in the United States is 4.1%.