Zip Codes with the Highest Percentage of Population Employed in Business & Financial in Brighton, CO
RELATED REPORTS & OPTIONS
Business & Financial
Brighton
Compare Zip Codes
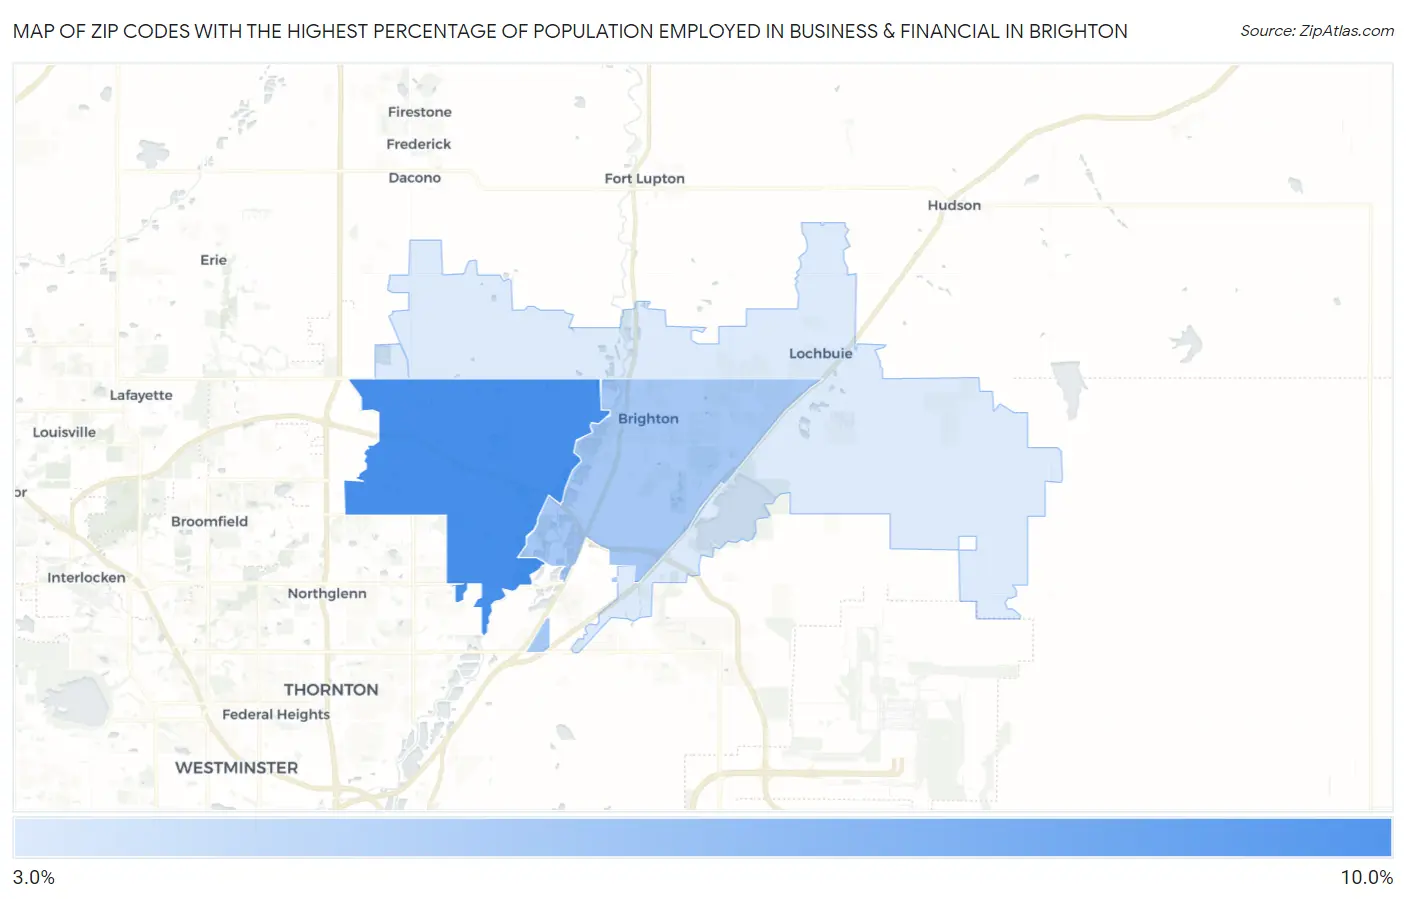
Map of Zip Codes with the Highest Percentage of Population Employed in Business & Financial in Brighton
3.8%
8.1%
Zip Codes with the Highest Percentage of Population Employed in Business & Financial in Brighton, CO
| Zip Code | % Employed | vs State | vs National | |
| 1. | 80602 | 8.1% | 6.7%(+1.43)#98 | 5.8%(+2.35)#4,086 |
| 2. | 80601 | 5.3% | 6.7%(-1.34)#202 | 5.8%(-0.415)#9,447 |
| 3. | 80603 | 3.8% | 6.7%(-2.92)#271 | 5.8%(-2.00)#14,739 |
1
Common Questions
What are the Top Zip Codes with the Highest Percentage of Population Employed in Business & Financial in Brighton, CO?
Top Zip Codes with the Highest Percentage of Population Employed in Business & Financial in Brighton, CO are:
What zip code has the Highest Percentage of Population Employed in Business & Financial in Brighton, CO?
80602 has the Highest Percentage of Population Employed in Business & Financial in Brighton, CO with 8.1%.
What is the Percentage of Population Employed in Business & Financial in Brighton, CO?
Percentage of Population Employed in Business & Financial in Brighton is 5.3%.
What is the Percentage of Population Employed in Business & Financial in Colorado?
Percentage of Population Employed in Business & Financial in Colorado is 6.7%.
What is the Percentage of Population Employed in Business & Financial in the United States?
Percentage of Population Employed in Business & Financial in the United States is 5.8%.