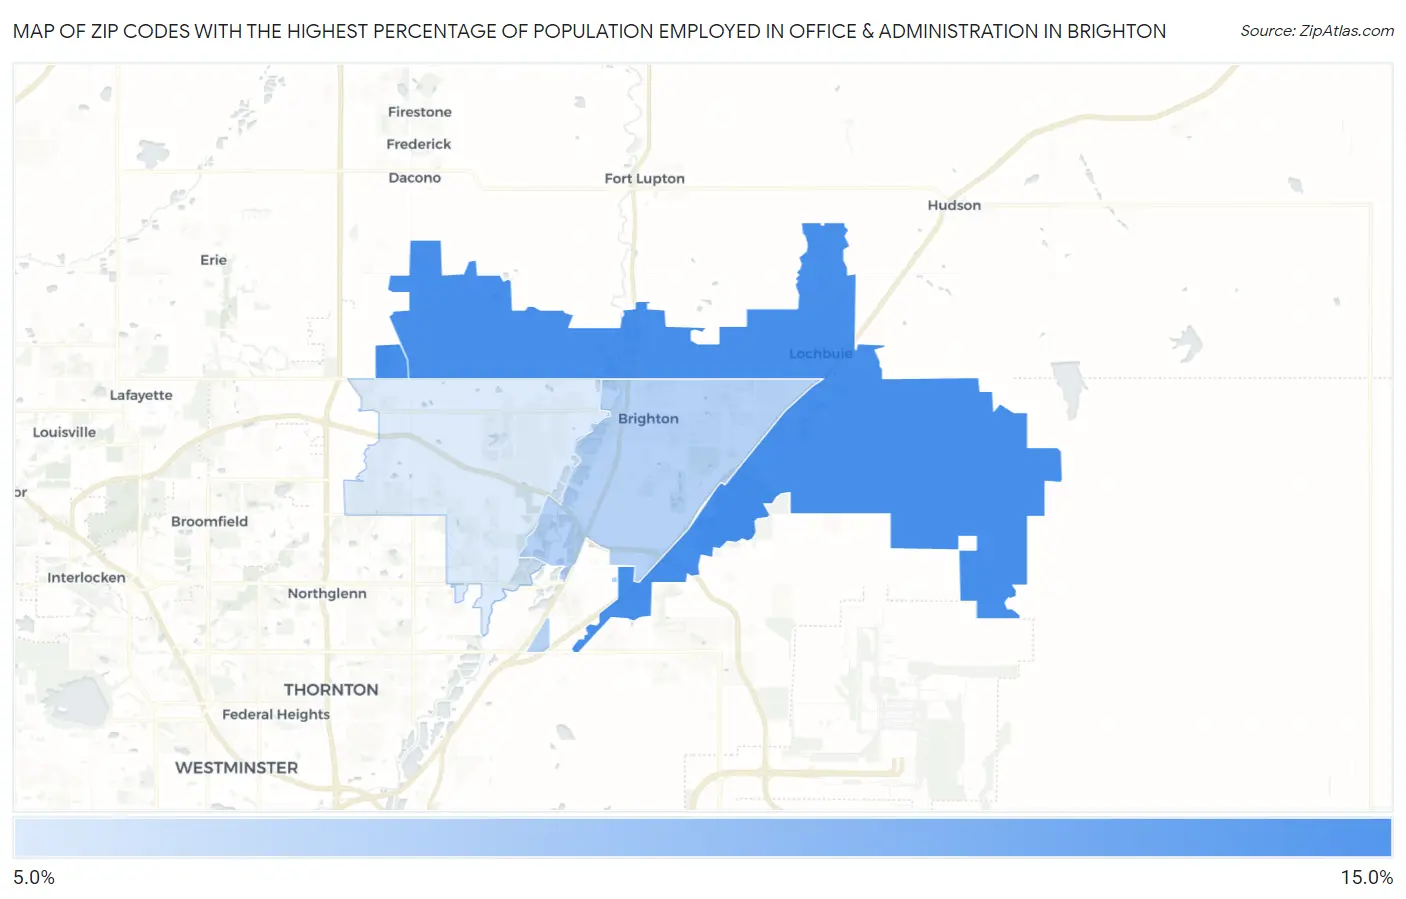
Zip Codes with the Highest Percentage of Population Employed in Office & Administration in Brighton, CO
RELATED REPORTS & OPTIONS
Office & Administration
Brighton
Compare Zip Codes
Map of Zip Codes with the Highest Percentage of Population Employed in Office & Administration in Brighton
10.9%
12.3%
Zip Codes with the Highest Percentage of Population Employed in Office & Administration in Brighton, CO
| Zip Code | % Employed | vs State | vs National | |
| 1. | 80603 | 12.3% | 10.1%(+2.18)#125 | 10.9%(+1.45)#9,831 |
| 2. | 80601 | 11.3% | 10.1%(+1.15)#156 | 10.9%(+0.425)#12,941 |
| 3. | 80602 | 10.9% | 10.1%(+0.801)#174 | 10.9%(+0.076)#14,056 |
1
Common Questions
What are the Top Zip Codes with the Highest Percentage of Population Employed in Office & Administration in Brighton, CO?
Top Zip Codes with the Highest Percentage of Population Employed in Office & Administration in Brighton, CO are:
What zip code has the Highest Percentage of Population Employed in Office & Administration in Brighton, CO?
80603 has the Highest Percentage of Population Employed in Office & Administration in Brighton, CO with 12.3%.
What is the Percentage of Population Employed in Office & Administration in Brighton, CO?
Percentage of Population Employed in Office & Administration in Brighton is 11.9%.
What is the Percentage of Population Employed in Office & Administration in Colorado?
Percentage of Population Employed in Office & Administration in Colorado is 10.1%.
What is the Percentage of Population Employed in Office & Administration in the United States?
Percentage of Population Employed in Office & Administration in the United States is 10.9%.