Zip Codes with the Highest Percentage of Population Employed in Farming, Fishing & Forestry in Brighton, CO
RELATED REPORTS & OPTIONS
Farming, Fishing & Forestry
Brighton
Compare Zip Codes
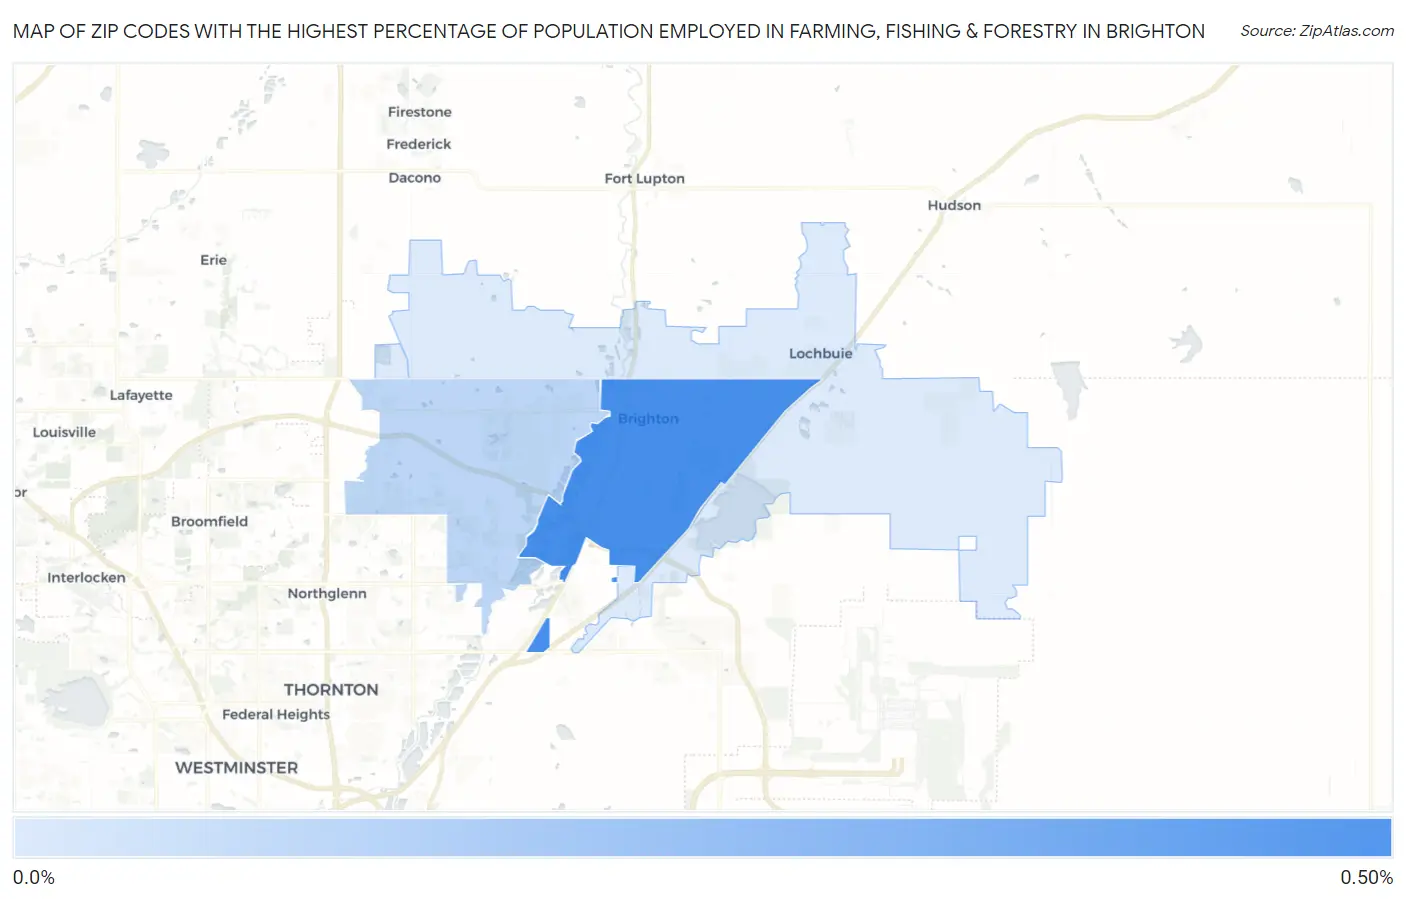
Map of Zip Codes with the Highest Percentage of Population Employed in Farming, Fishing & Forestry in Brighton
0.090%
0.49%
Zip Codes with the Highest Percentage of Population Employed in Farming, Fishing & Forestry in Brighton, CO
| Zip Code | % Employed | vs State | vs National | |
| 1. | 80601 | 0.49% | 0.49%(+0.002)#204 | 0.61%(-0.116)#12,939 |
| 2. | 80602 | 0.18% | 0.49%(-0.309)#272 | 0.61%(-0.427)#16,448 |
| 3. | 80603 | 0.090% | 0.49%(-0.397)#301 | 0.61%(-0.515)#17,918 |
1
Common Questions
What are the Top Zip Codes with the Highest Percentage of Population Employed in Farming, Fishing & Forestry in Brighton, CO?
Top Zip Codes with the Highest Percentage of Population Employed in Farming, Fishing & Forestry in Brighton, CO are:
What zip code has the Highest Percentage of Population Employed in Farming, Fishing & Forestry in Brighton, CO?
80601 has the Highest Percentage of Population Employed in Farming, Fishing & Forestry in Brighton, CO with 0.49%.
What is the Percentage of Population Employed in Farming, Fishing & Forestry in Brighton, CO?
Percentage of Population Employed in Farming, Fishing & Forestry in Brighton is 0.49%.
What is the Percentage of Population Employed in Farming, Fishing & Forestry in Colorado?
Percentage of Population Employed in Farming, Fishing & Forestry in Colorado is 0.49%.
What is the Percentage of Population Employed in Farming, Fishing & Forestry in the United States?
Percentage of Population Employed in Farming, Fishing & Forestry in the United States is 0.61%.