Zip Codes with the Highest Percentage of Population with a Degree in Liberal Arts and History in Brighton, CO
RELATED REPORTS & OPTIONS
Liberal Arts and History
Brighton
Compare Zip Codes
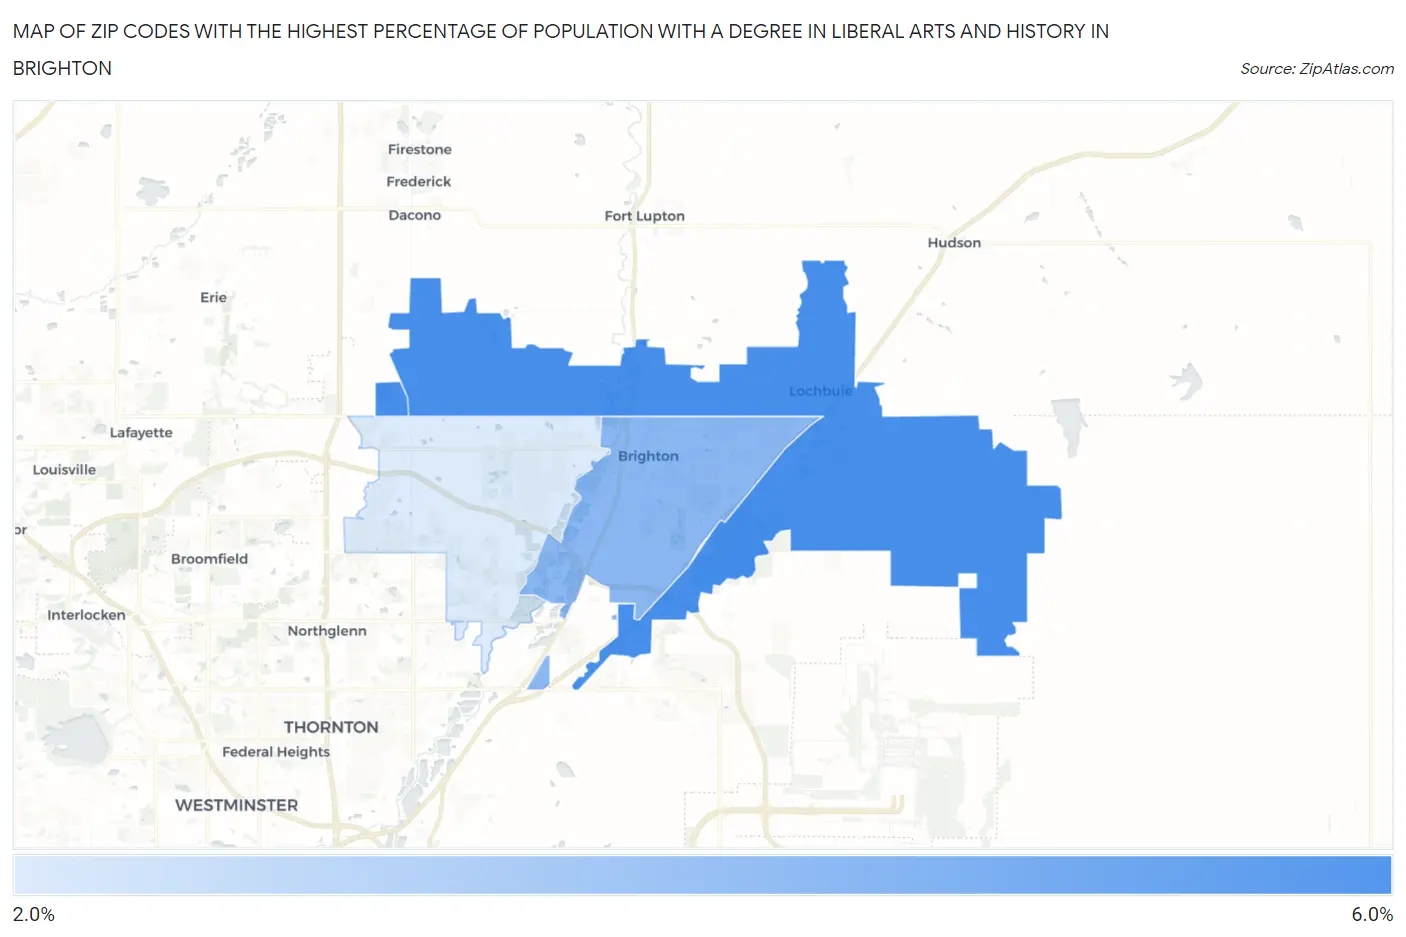
Map of Zip Codes with the Highest Percentage of Population with a Degree in Liberal Arts and History in Brighton
2.7%
5.5%
Zip Codes with the Highest Percentage of Population with a Degree in Liberal Arts and History in Brighton, CO
| Zip Code | % Graduates | vs State | vs National | |
| 1. | 80603 | 5.5% | 4.6%(+0.828)#130 | 4.9%(+0.586)#9,978 |
| 2. | 80601 | 4.2% | 4.6%(-0.450)#209 | 4.9%(-0.691)#14,091 |
| 3. | 80602 | 2.7% | 4.6%(-1.98)#317 | 4.9%(-2.22)#19,493 |
1
Common Questions
What are the Top Zip Codes with the Highest Percentage of Population with a Degree in Liberal Arts and History in Brighton, CO?
Top Zip Codes with the Highest Percentage of Population with a Degree in Liberal Arts and History in Brighton, CO are:
What zip code has the Highest Percentage of Population with a Degree in Liberal Arts and History in Brighton, CO?
80603 has the Highest Percentage of Population with a Degree in Liberal Arts and History in Brighton, CO with 5.5%.
What is the Percentage of Population with a Degree in Liberal Arts and History in Brighton, CO?
Percentage of Population with a Degree in Liberal Arts and History in Brighton is 4.3%.
What is the Percentage of Population with a Degree in Liberal Arts and History in Colorado?
Percentage of Population with a Degree in Liberal Arts and History in Colorado is 4.6%.
What is the Percentage of Population with a Degree in Liberal Arts and History in the United States?
Percentage of Population with a Degree in Liberal Arts and History in the United States is 4.9%.