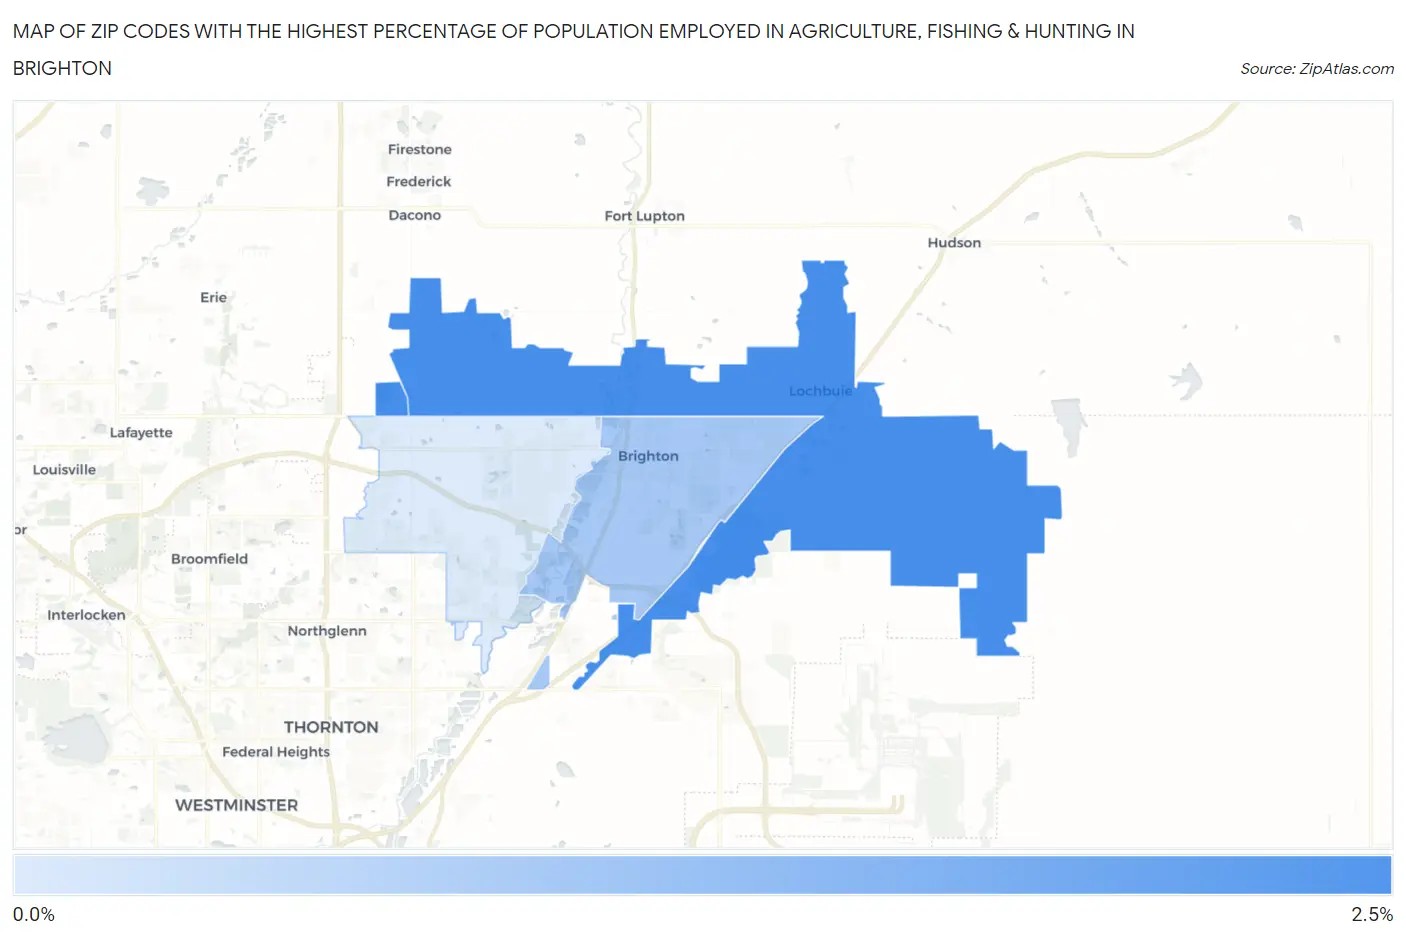
Zip Codes with the Highest Percentage of Population Employed in Agriculture, Fishing & Hunting in Brighton, CO
RELATED REPORTS & OPTIONS
Agriculture, Fishing & Hunting
Brighton
Compare Zip Codes
Map of Zip Codes with the Highest Percentage of Population Employed in Agriculture, Fishing & Hunting in Brighton
0.31%
2.2%
Zip Codes with the Highest Percentage of Population Employed in Agriculture, Fishing & Hunting in Brighton, CO
| Zip Code | % Employed | vs State | vs National | |
| 1. | 80603 | 2.2% | 1.1%(+1.01)#222 | 1.2%(+0.959)#12,356 |
| 2. | 80601 | 0.99% | 1.1%(-0.159)#284 | 1.2%(-0.210)#16,282 |
| 3. | 80602 | 0.31% | 1.1%(-0.840)#375 | 1.2%(-0.892)#21,093 |
1
Common Questions
What are the Top Zip Codes with the Highest Percentage of Population Employed in Agriculture, Fishing & Hunting in Brighton, CO?
Top Zip Codes with the Highest Percentage of Population Employed in Agriculture, Fishing & Hunting in Brighton, CO are:
What zip code has the Highest Percentage of Population Employed in Agriculture, Fishing & Hunting in Brighton, CO?
80603 has the Highest Percentage of Population Employed in Agriculture, Fishing & Hunting in Brighton, CO with 2.2%.
What is the Percentage of Population Employed in Agriculture, Fishing & Hunting in Brighton, CO?
Percentage of Population Employed in Agriculture, Fishing & Hunting in Brighton is 1.0%.
What is the Percentage of Population Employed in Agriculture, Fishing & Hunting in Colorado?
Percentage of Population Employed in Agriculture, Fishing & Hunting in Colorado is 1.1%.
What is the Percentage of Population Employed in Agriculture, Fishing & Hunting in the United States?
Percentage of Population Employed in Agriculture, Fishing & Hunting in the United States is 1.2%.