Zip Codes with the Highest Percentage of Population Employed in Community & Social Service in Brighton, CO
RELATED REPORTS & OPTIONS
Community & Social Service
Brighton
Compare Zip Codes
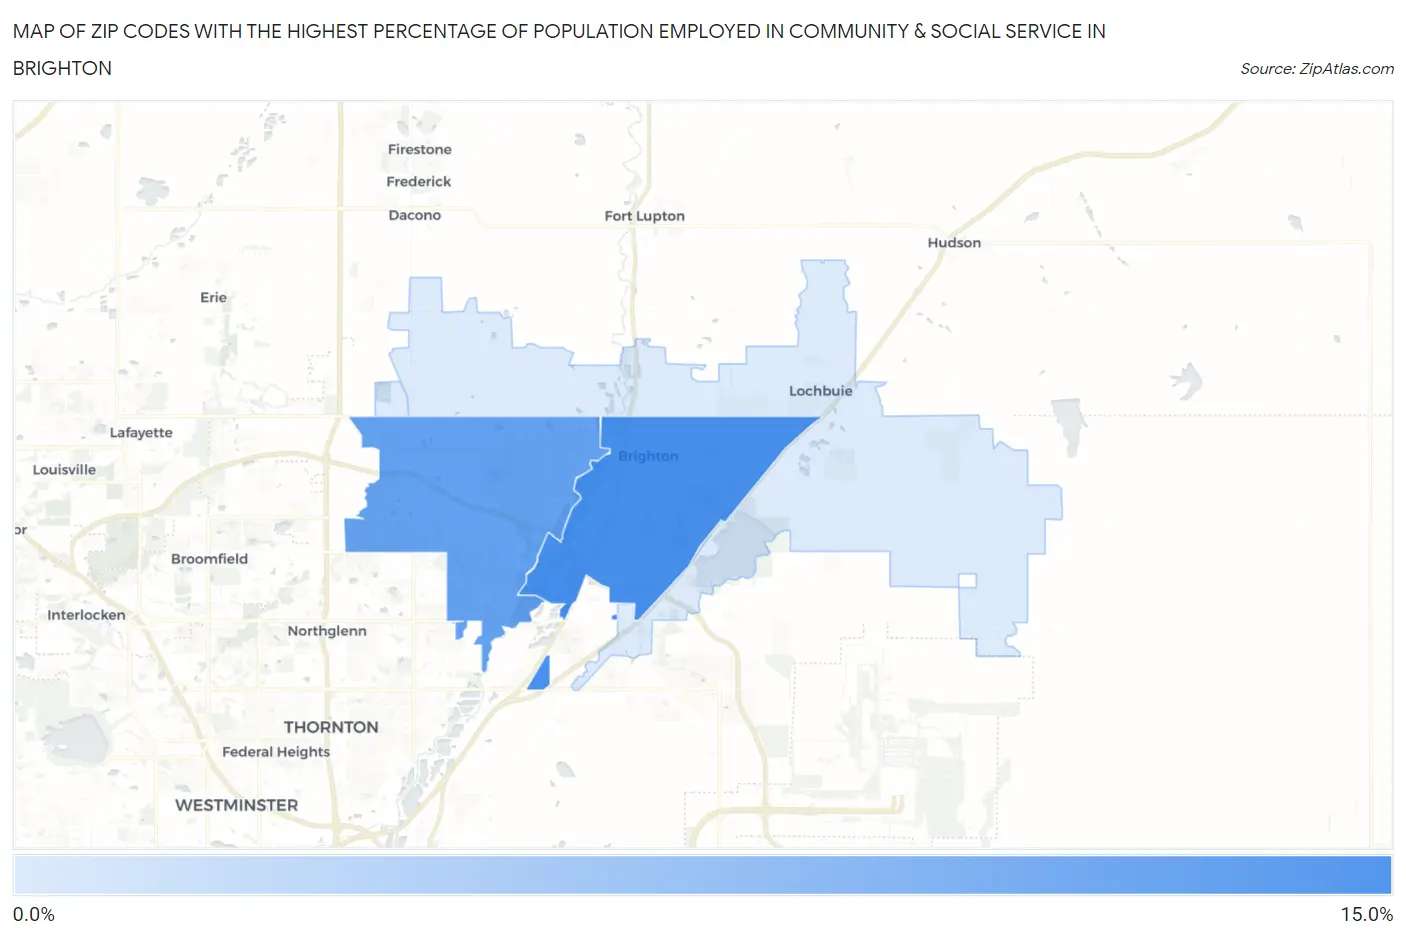
Map of Zip Codes with the Highest Percentage of Population Employed in Community & Social Service in Brighton
3.0%
10.4%
Zip Codes with the Highest Percentage of Population Employed in Community & Social Service in Brighton, CO
| Zip Code | % Employed | vs State | vs National | |
| 1. | 80601 | 10.4% | 11.2%(-0.836)#237 | 11.2%(-0.810)#13,098 |
| 2. | 80602 | 9.0% | 11.2%(-2.21)#291 | 11.2%(-2.19)#16,738 |
| 3. | 80603 | 3.0% | 11.2%(-8.24)#441 | 11.2%(-8.22)#28,560 |
1
Common Questions
What are the Top Zip Codes with the Highest Percentage of Population Employed in Community & Social Service in Brighton, CO?
Top Zip Codes with the Highest Percentage of Population Employed in Community & Social Service in Brighton, CO are:
What zip code has the Highest Percentage of Population Employed in Community & Social Service in Brighton, CO?
80601 has the Highest Percentage of Population Employed in Community & Social Service in Brighton, CO with 10.4%.
What is the Percentage of Population Employed in Community & Social Service in Brighton, CO?
Percentage of Population Employed in Community & Social Service in Brighton is 10.2%.
What is the Percentage of Population Employed in Community & Social Service in Colorado?
Percentage of Population Employed in Community & Social Service in Colorado is 11.2%.
What is the Percentage of Population Employed in Community & Social Service in the United States?
Percentage of Population Employed in Community & Social Service in the United States is 11.2%.