Zip Codes with the Highest Percentage of Households Heated by Utility Gas in Brighton, CO
RELATED REPORTS & OPTIONS
Utility Gas Heating
Brighton
Compare Zip Codes
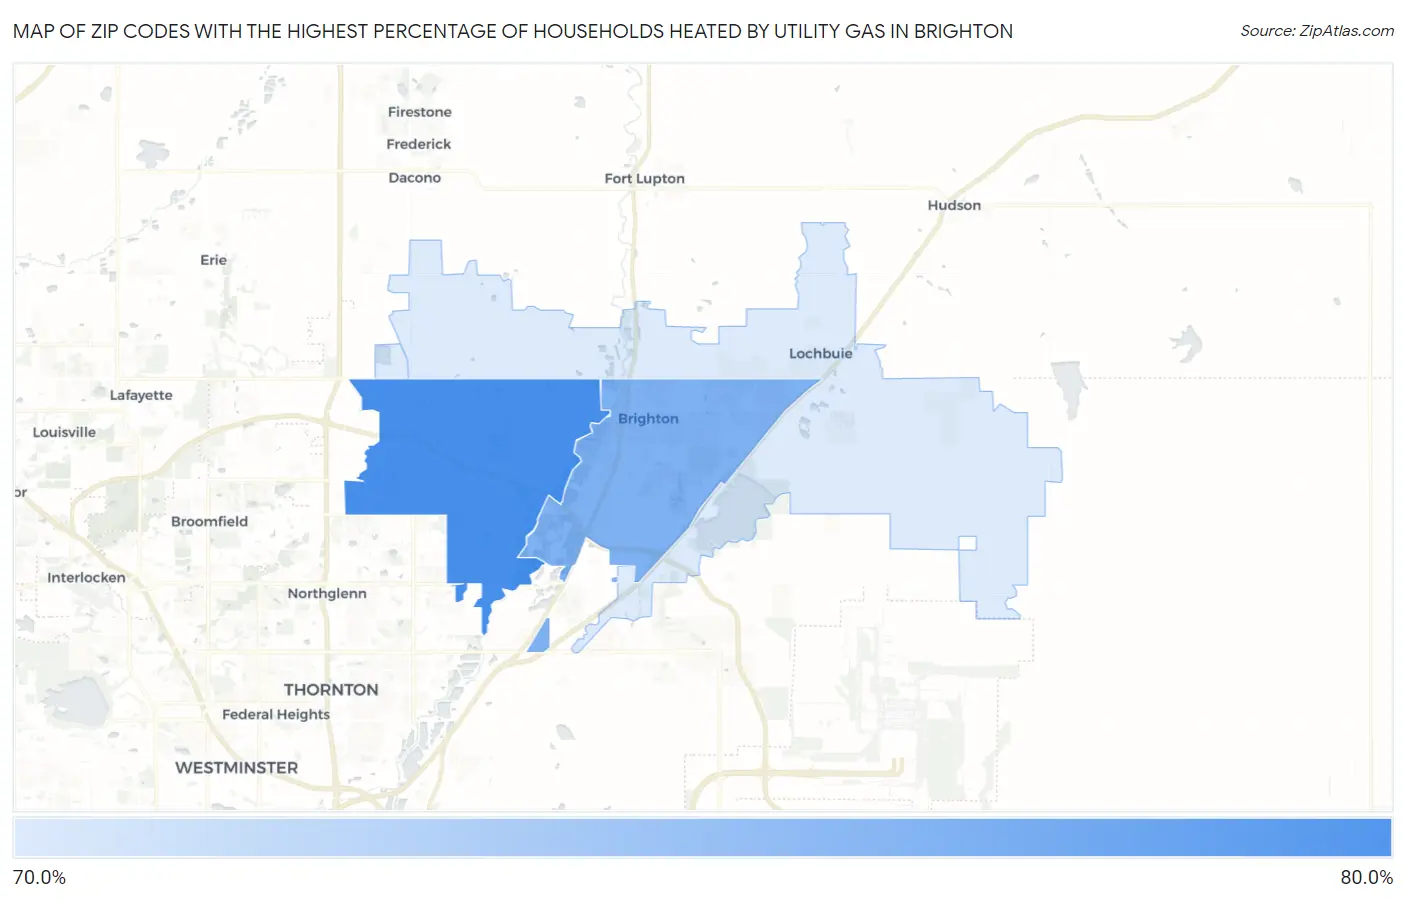
Map of Zip Codes with the Highest Percentage of Households Heated by Utility Gas in Brighton
70.9%
79.8%
Zip Codes with the Highest Percentage of Households Heated by Utility Gas in Brighton, CO
| Zip Code | Utility Gas Heating | vs State | vs National | |
| 1. | 80602 | 79.8% | 67.2%(+12.6)#45 | 47.1%(+32.7)#2,318 |
| 2. | 80601 | 76.5% | 67.2%(+9.30)#66 | 47.1%(+29.4)#3,051 |
| 3. | 80603 | 70.9% | 67.2%(+3.70)#124 | 47.1%(+23.8)#4,396 |
1
Common Questions
What are the Top Zip Codes with the Highest Percentage of Households Heated by Utility Gas in Brighton, CO?
Top Zip Codes with the Highest Percentage of Households Heated by Utility Gas in Brighton, CO are:
What zip code has the Highest Percentage of Households Heated by Utility Gas in Brighton, CO?
80602 has the Highest Percentage of Households Heated by Utility Gas in Brighton, CO with 79.8%.
What is the Percentage of Households Heated by Utility Gas in Brighton, CO?
Percentage of Households Heated by Utility Gas in Brighton is 76.9%.
What is the Percentage of Households Heated by Utility Gas in Colorado?
Percentage of Households Heated by Utility Gas in Colorado is 67.2%.
What is the Percentage of Households Heated by Utility Gas in the United States?
Percentage of Households Heated by Utility Gas in the United States is 47.1%.