Zip Codes with the Highest Percentage of Population Employed in Accommodation & Food Services in Brighton, CO
RELATED REPORTS & OPTIONS
Accommodation & Food Services
Brighton
Compare Zip Codes
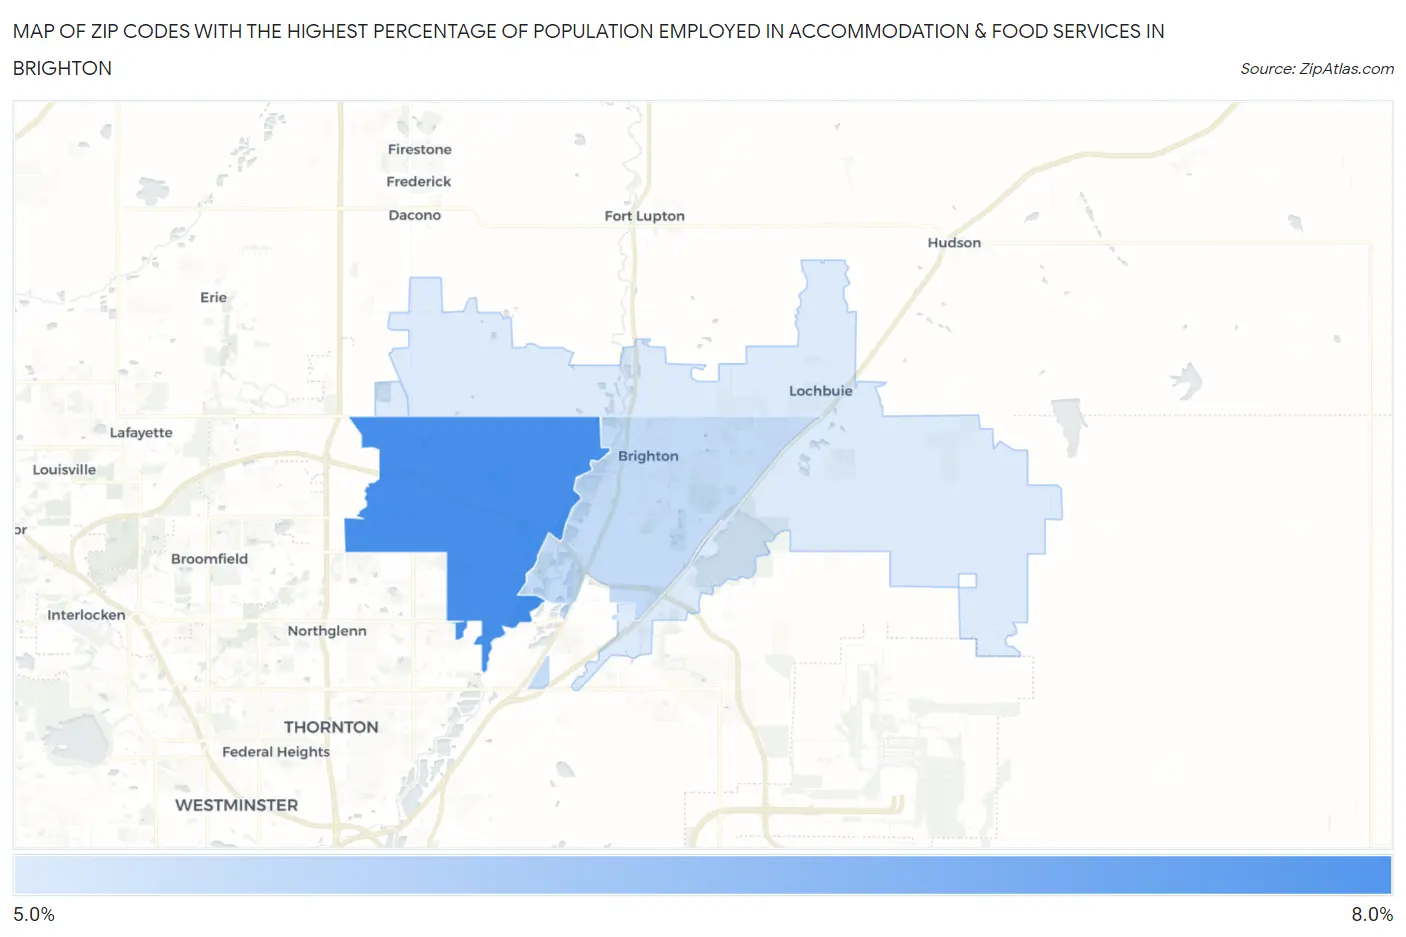
Map of Zip Codes with the Highest Percentage of Population Employed in Accommodation & Food Services in Brighton
5.1%
6.1%
Zip Codes with the Highest Percentage of Population Employed in Accommodation & Food Services in Brighton, CO
| Zip Code | % Employed | vs State | vs National | |
| 1. | 80602 | 6.1% | 6.9%(-0.820)#219 | 6.9%(-0.800)#13,200 |
| 2. | 80601 | 5.2% | 6.9%(-1.68)#264 | 6.9%(-1.66)#16,032 |
| 3. | 80603 | 5.1% | 6.9%(-1.85)#276 | 6.9%(-1.83)#16,642 |
1
Common Questions
What are the Top Zip Codes with the Highest Percentage of Population Employed in Accommodation & Food Services in Brighton, CO?
Top Zip Codes with the Highest Percentage of Population Employed in Accommodation & Food Services in Brighton, CO are:
What zip code has the Highest Percentage of Population Employed in Accommodation & Food Services in Brighton, CO?
80602 has the Highest Percentage of Population Employed in Accommodation & Food Services in Brighton, CO with 6.1%.
What is the Percentage of Population Employed in Accommodation & Food Services in Brighton, CO?
Percentage of Population Employed in Accommodation & Food Services in Brighton is 5.3%.
What is the Percentage of Population Employed in Accommodation & Food Services in Colorado?
Percentage of Population Employed in Accommodation & Food Services in Colorado is 6.9%.
What is the Percentage of Population Employed in Accommodation & Food Services in the United States?
Percentage of Population Employed in Accommodation & Food Services in the United States is 6.9%.