Zip Codes with the Highest Percentage of Population Employed in Cleaning & Maintenance in Porterville, CA
RELATED REPORTS & OPTIONS
Cleaning & Maintenance
Porterville
Compare Zip Codes
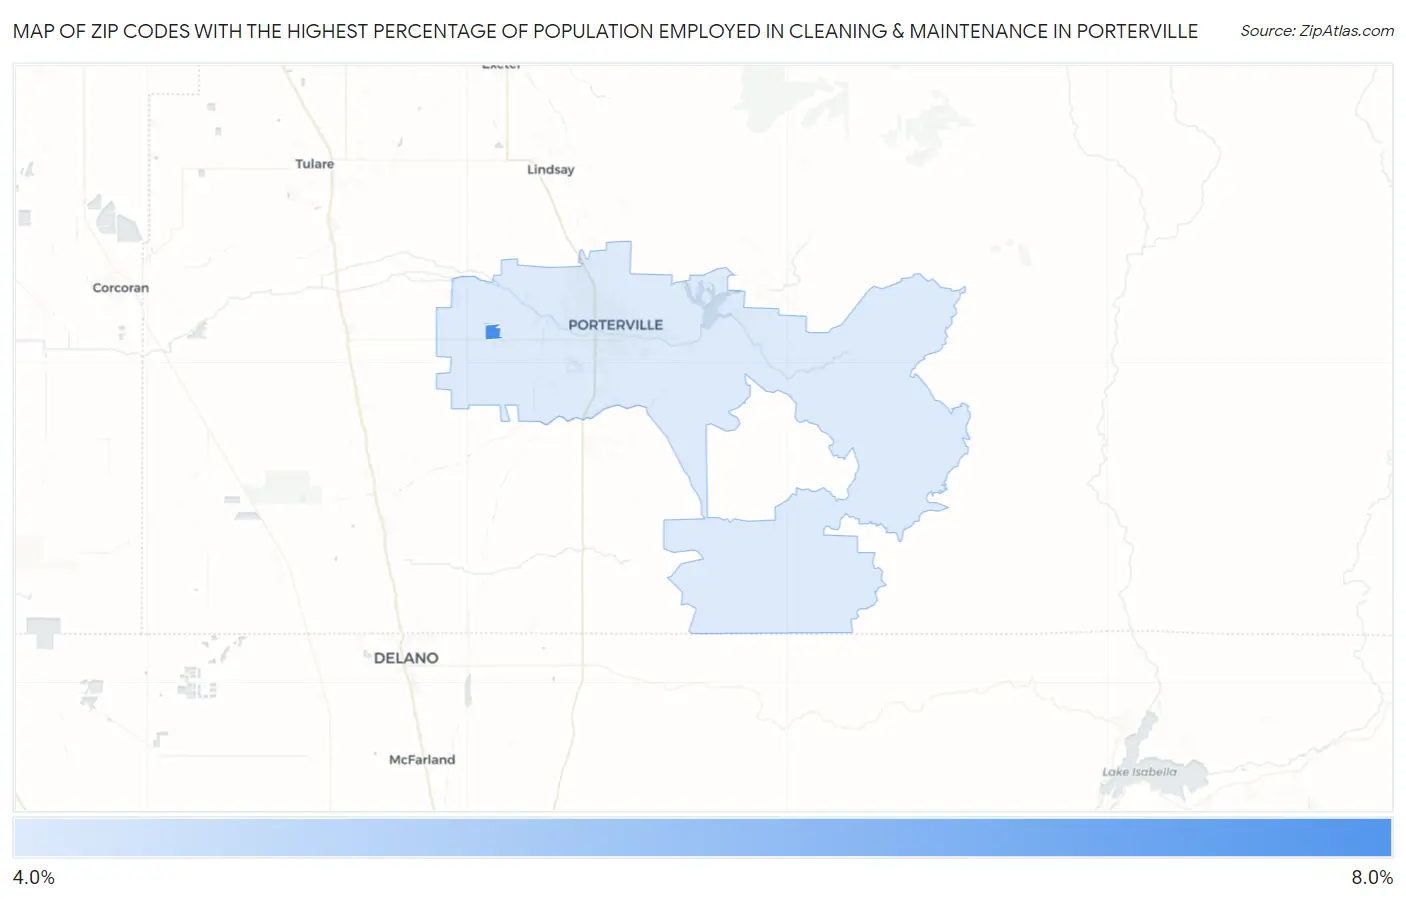
Map of Zip Codes with the Highest Percentage of Population Employed in Cleaning & Maintenance in Porterville
4.2%
6.7%
Zip Codes with the Highest Percentage of Population Employed in Cleaning & Maintenance in Porterville, CA
| Zip Code | % Employed | vs State | vs National | |
| 1. | 93258 | 6.7% | 3.7%(+3.01)#278 | 3.5%(+3.24)#4,449 |
| 2. | 93257 | 4.2% | 3.7%(+0.445)#620 | 3.5%(+0.681)#10,697 |
1
Common Questions
What are the Top Zip Codes with the Highest Percentage of Population Employed in Cleaning & Maintenance in Porterville, CA?
Top Zip Codes with the Highest Percentage of Population Employed in Cleaning & Maintenance in Porterville, CA are:
What zip code has the Highest Percentage of Population Employed in Cleaning & Maintenance in Porterville, CA?
93258 has the Highest Percentage of Population Employed in Cleaning & Maintenance in Porterville, CA with 6.7%.
What is the Percentage of Population Employed in Cleaning & Maintenance in Porterville, CA?
Percentage of Population Employed in Cleaning & Maintenance in Porterville is 4.8%.
What is the Percentage of Population Employed in Cleaning & Maintenance in California?
Percentage of Population Employed in Cleaning & Maintenance in California is 3.7%.
What is the Percentage of Population Employed in Cleaning & Maintenance in the United States?
Percentage of Population Employed in Cleaning & Maintenance in the United States is 3.5%.