Zip Codes with the Highest Percentage of Population Employed in Architecture & Engineering in San Luis, AZ
RELATED REPORTS & OPTIONS
Architecture & Engineering
San Luis
Compare Zip Codes
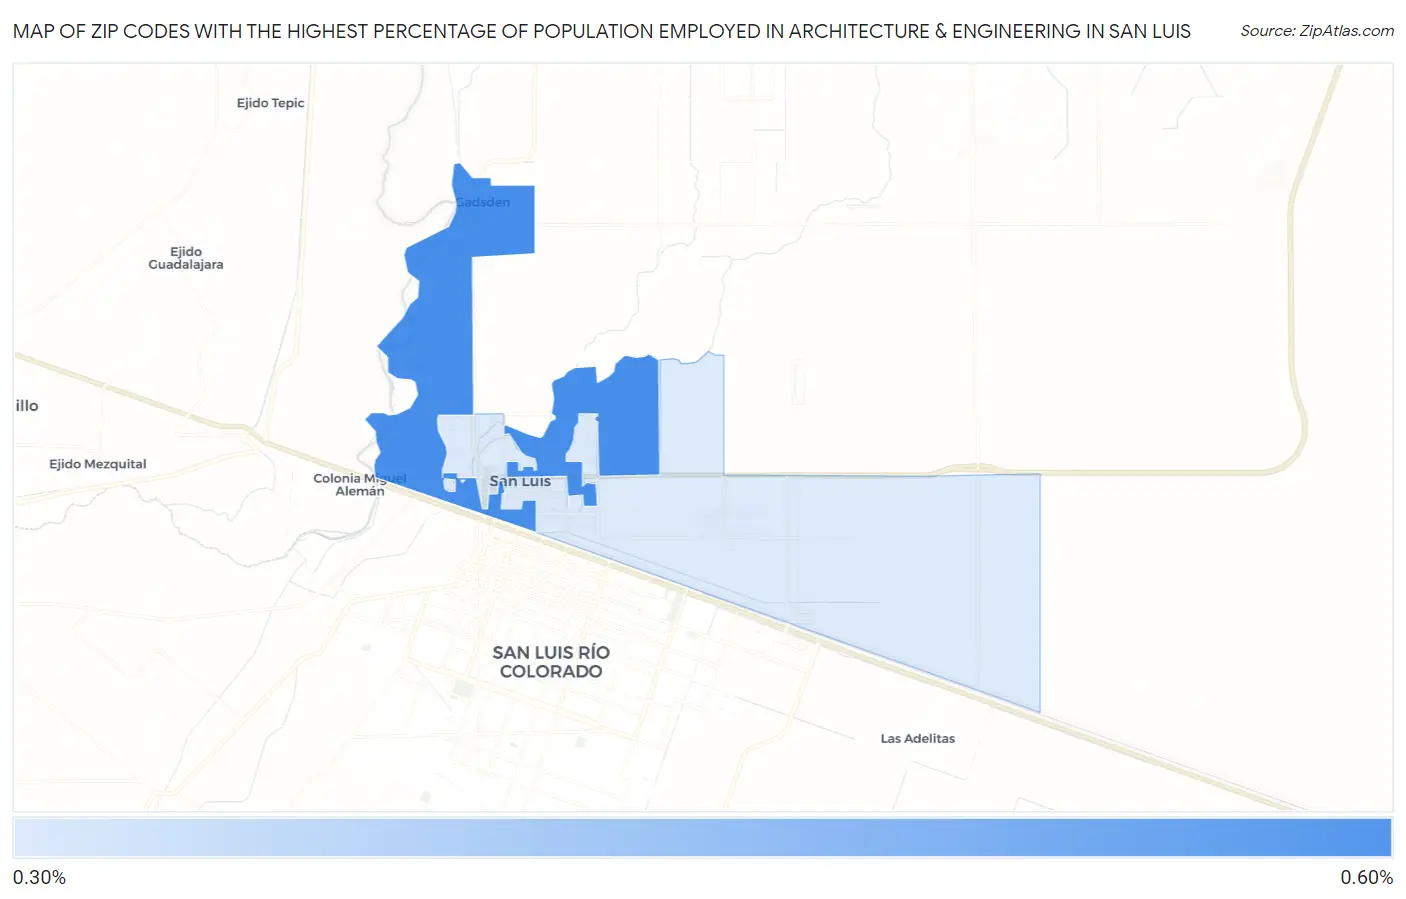
Map of Zip Codes with the Highest Percentage of Population Employed in Architecture & Engineering in San Luis
0.32%
0.54%
Zip Codes with the Highest Percentage of Population Employed in Architecture & Engineering in San Luis, AZ
| Zip Code | % Employed | vs State | vs National | |
| 1. | 85336 | 0.54% | 2.4%(-1.85)#263 | 2.1%(-1.61)#20,040 |
| 2. | 85349 | 0.32% | 2.4%(-2.07)#278 | 2.1%(-1.83)#21,441 |
1
Common Questions
What are the Top Zip Codes with the Highest Percentage of Population Employed in Architecture & Engineering in San Luis, AZ?
Top Zip Codes with the Highest Percentage of Population Employed in Architecture & Engineering in San Luis, AZ are:
What zip code has the Highest Percentage of Population Employed in Architecture & Engineering in San Luis, AZ?
85336 has the Highest Percentage of Population Employed in Architecture & Engineering in San Luis, AZ with 0.54%.
What is the Percentage of Population Employed in Architecture & Engineering in San Luis, AZ?
Percentage of Population Employed in Architecture & Engineering in San Luis is 0.23%.
What is the Percentage of Population Employed in Architecture & Engineering in Arizona?
Percentage of Population Employed in Architecture & Engineering in Arizona is 2.4%.
What is the Percentage of Population Employed in Architecture & Engineering in the United States?
Percentage of Population Employed in Architecture & Engineering in the United States is 2.1%.