Zip Codes with the Most Immigrants from Mexico in San Luis, AZ
RELATED REPORTS & OPTIONS
Mexico
San Luis
Compare Zip Codes
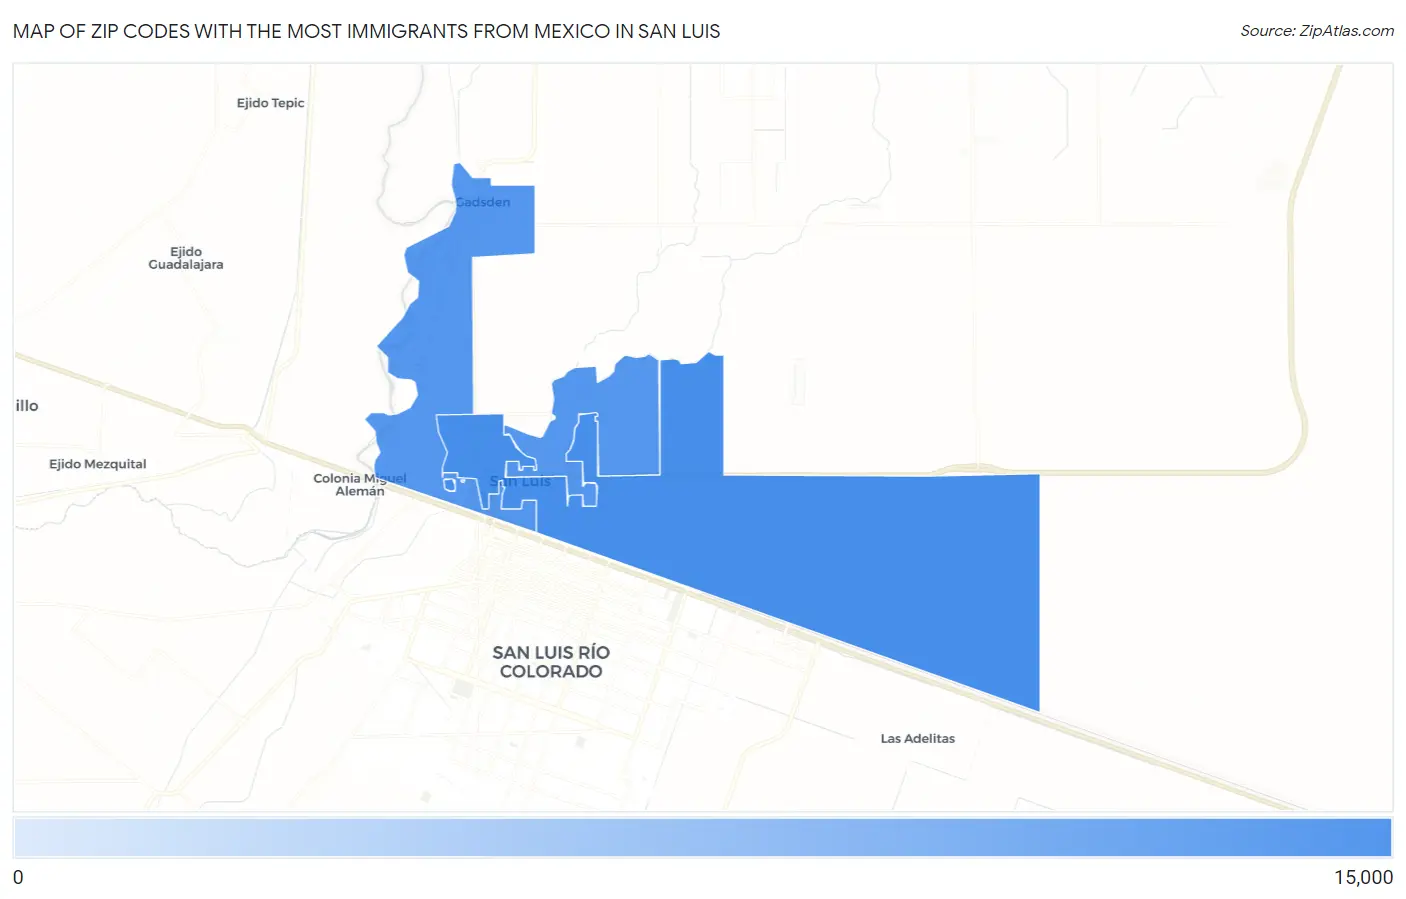
Map of Zip Codes with the Most Immigrants from Mexico in San Luis
4,764
11,224
Zip Codes with the Most Immigrants from Mexico in San Luis, AZ
| Zip Code | Mexico | vs State | vs National | |
| 1. | 85349 | 11,224 | 500,086(2.24%)#9 | 10,767,104(0.10%)#135 |
| 2. | 85336 | 4,764 | 500,086(0.95%)#34 | 10,767,104(0.04%)#529 |
1
Common Questions
What are the Top Zip Codes with the Most Immigrants from Mexico in San Luis, AZ?
Top Zip Codes with the Most Immigrants from Mexico in San Luis, AZ are:
What zip code has the Most Immigrants from Mexico in San Luis, AZ?
85349 has the Most Immigrants from Mexico in San Luis, AZ with 11,224.
What is the Total Immigrants from Mexico in San Luis, AZ?
Total Immigrants from Mexico in San Luis is 15,621.
What is the Total Immigrants from Mexico in Arizona?
Total Immigrants from Mexico in Arizona is 500,086.
What is the Total Immigrants from Mexico in the United States?
Total Immigrants from Mexico in the United States is 10,767,104.