Zip Codes with the Highest Percentage of Population Employed in Arts, Entertainment & Recreation in Maricopa, AZ
RELATED REPORTS & OPTIONS
Arts, Entertainment & Recreation
Maricopa
Compare Zip Codes
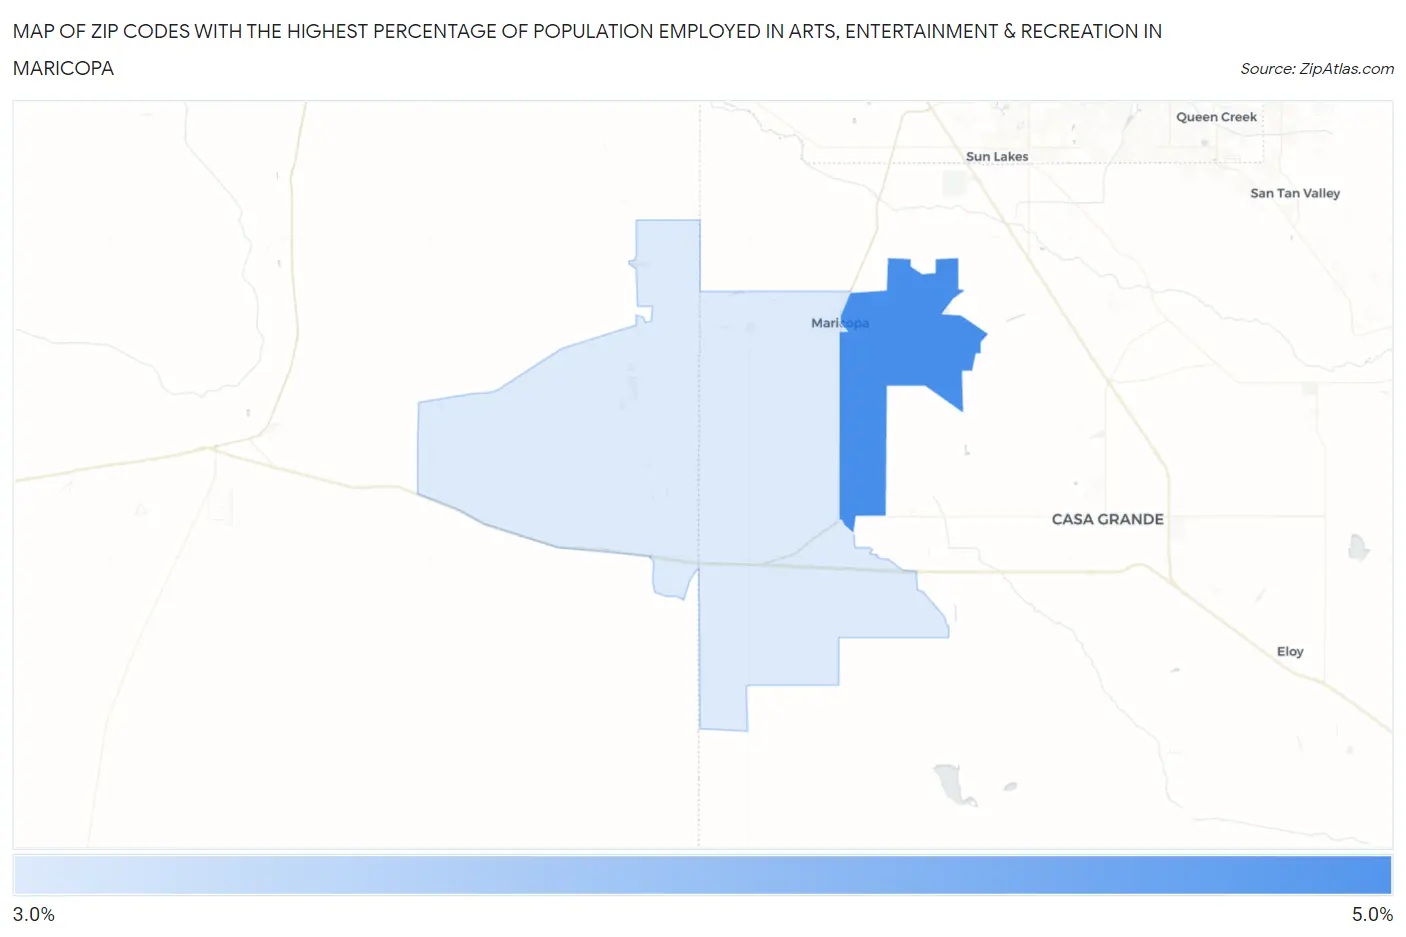
Map of Zip Codes with the Highest Percentage of Population Employed in Arts, Entertainment & Recreation in Maricopa
3.1%
4.8%
Zip Codes with the Highest Percentage of Population Employed in Arts, Entertainment & Recreation in Maricopa, AZ
| Zip Code | % Employed | vs State | vs National | |
| 1. | 85138 | 4.8% | 2.3%(+2.46)#48 | 2.1%(+2.69)#2,463 |
| 2. | 85139 | 3.1% | 2.3%(+0.836)#89 | 2.1%(+1.06)#4,936 |
1
Common Questions
What are the Top Zip Codes with the Highest Percentage of Population Employed in Arts, Entertainment & Recreation in Maricopa, AZ?
Top Zip Codes with the Highest Percentage of Population Employed in Arts, Entertainment & Recreation in Maricopa, AZ are:
What zip code has the Highest Percentage of Population Employed in Arts, Entertainment & Recreation in Maricopa, AZ?
85138 has the Highest Percentage of Population Employed in Arts, Entertainment & Recreation in Maricopa, AZ with 4.8%.
What is the Percentage of Population Employed in Arts, Entertainment & Recreation in Maricopa, AZ?
Percentage of Population Employed in Arts, Entertainment & Recreation in Maricopa is 4.0%.
What is the Percentage of Population Employed in Arts, Entertainment & Recreation in Arizona?
Percentage of Population Employed in Arts, Entertainment & Recreation in Arizona is 2.3%.
What is the Percentage of Population Employed in Arts, Entertainment & Recreation in the United States?
Percentage of Population Employed in Arts, Entertainment & Recreation in the United States is 2.1%.