Zip Codes with the Highest Percentage of Population Employed in Installation, Maintenance & Repair in Maricopa, AZ
RELATED REPORTS & OPTIONS
Installation, Maintenance & Repair
Maricopa
Compare Zip Codes
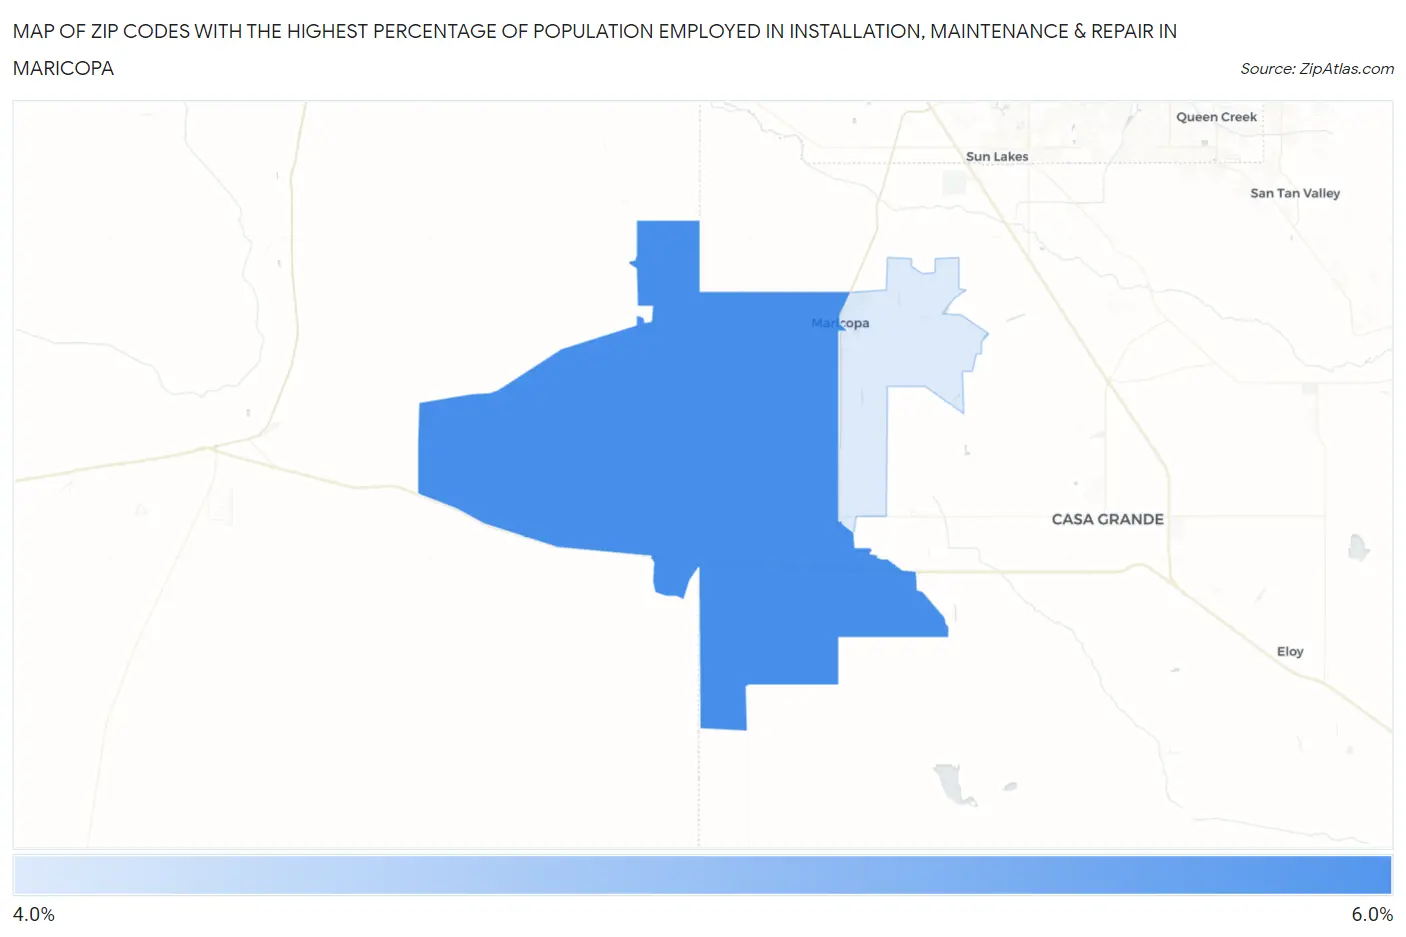
Map of Zip Codes with the Highest Percentage of Population Employed in Installation, Maintenance & Repair in Maricopa
4.0%
5.7%
Zip Codes with the Highest Percentage of Population Employed in Installation, Maintenance & Repair in Maricopa, AZ
| Zip Code | % Employed | vs State | vs National | |
| 1. | 85139 | 5.7% | 3.3%(+2.41)#49 | 3.1%(+2.60)#6,858 |
| 2. | 85138 | 4.0% | 3.3%(+0.778)#111 | 3.1%(+0.968)#12,207 |
1
Common Questions
What are the Top Zip Codes with the Highest Percentage of Population Employed in Installation, Maintenance & Repair in Maricopa, AZ?
Top Zip Codes with the Highest Percentage of Population Employed in Installation, Maintenance & Repair in Maricopa, AZ are:
What zip code has the Highest Percentage of Population Employed in Installation, Maintenance & Repair in Maricopa, AZ?
85139 has the Highest Percentage of Population Employed in Installation, Maintenance & Repair in Maricopa, AZ with 5.7%.
What is the Percentage of Population Employed in Installation, Maintenance & Repair in Maricopa, AZ?
Percentage of Population Employed in Installation, Maintenance & Repair in Maricopa is 4.4%.
What is the Percentage of Population Employed in Installation, Maintenance & Repair in Arizona?
Percentage of Population Employed in Installation, Maintenance & Repair in Arizona is 3.3%.
What is the Percentage of Population Employed in Installation, Maintenance & Repair in the United States?
Percentage of Population Employed in Installation, Maintenance & Repair in the United States is 3.1%.