Zip Codes with the Highest Percentage of Population Employed in Legal Services & Support in Maricopa, AZ
RELATED REPORTS & OPTIONS
Legal Services & Support
Maricopa
Compare Zip Codes
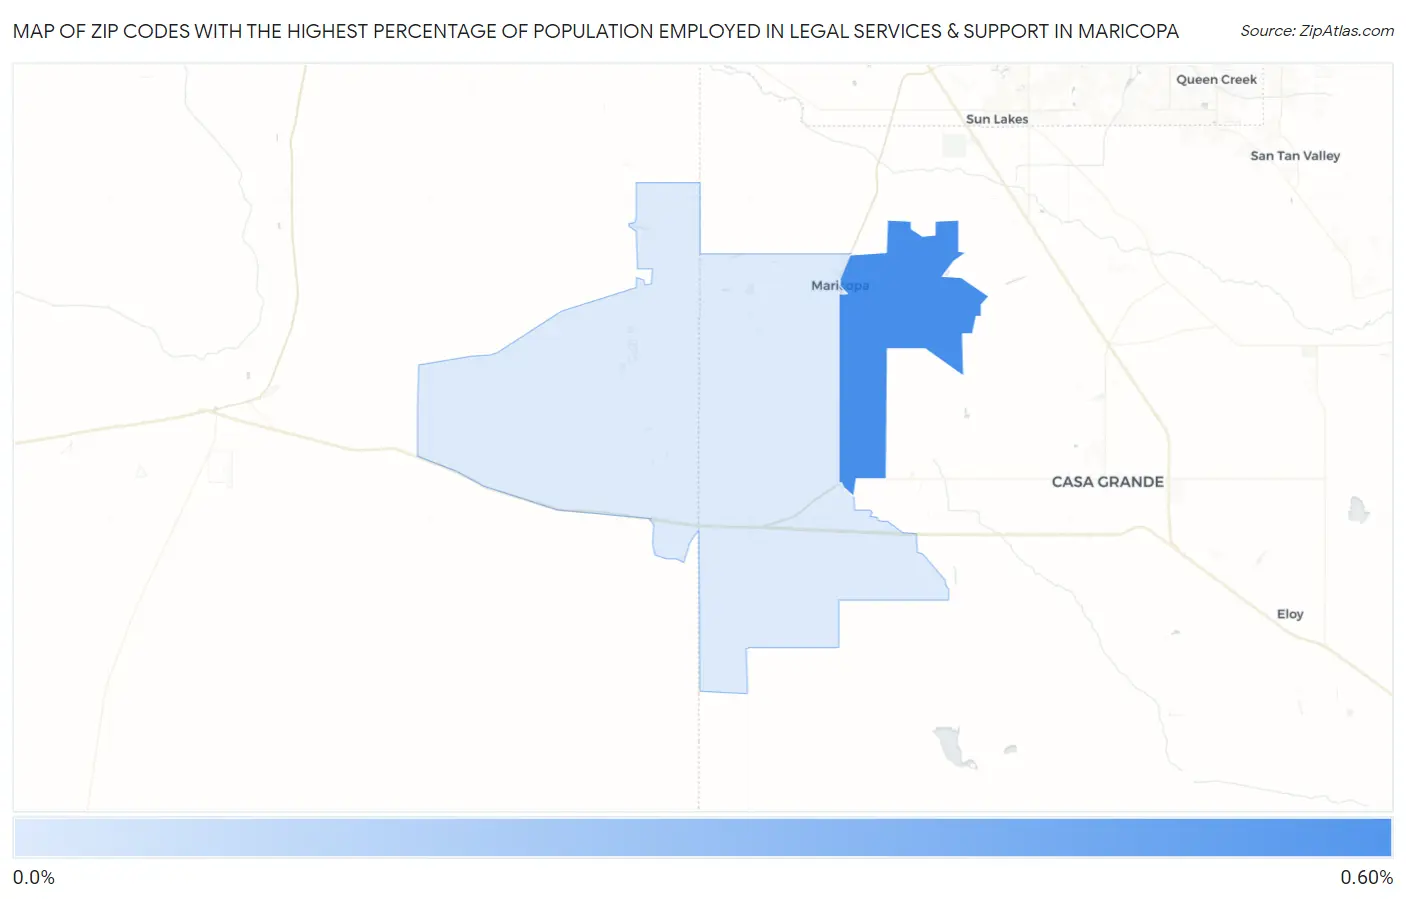
Map of Zip Codes with the Highest Percentage of Population Employed in Legal Services & Support in Maricopa
0.057%
0.51%
Zip Codes with the Highest Percentage of Population Employed in Legal Services & Support in Maricopa, AZ
| Zip Code | % Employed | vs State | vs National | |
| 1. | 85138 | 0.51% | 0.99%(-0.473)#178 | 1.2%(-0.671)#12,452 |
| 2. | 85139 | 0.057% | 0.99%(-0.929)#234 | 1.2%(-1.13)#17,403 |
1
Common Questions
What are the Top Zip Codes with the Highest Percentage of Population Employed in Legal Services & Support in Maricopa, AZ?
Top Zip Codes with the Highest Percentage of Population Employed in Legal Services & Support in Maricopa, AZ are:
What zip code has the Highest Percentage of Population Employed in Legal Services & Support in Maricopa, AZ?
85138 has the Highest Percentage of Population Employed in Legal Services & Support in Maricopa, AZ with 0.51%.
What is the Percentage of Population Employed in Legal Services & Support in Maricopa, AZ?
Percentage of Population Employed in Legal Services & Support in Maricopa is 0.44%.
What is the Percentage of Population Employed in Legal Services & Support in Arizona?
Percentage of Population Employed in Legal Services & Support in Arizona is 0.99%.
What is the Percentage of Population Employed in Legal Services & Support in the United States?
Percentage of Population Employed in Legal Services & Support in the United States is 1.2%.