Zip Codes with the Highest Percentage of Population Employed in Security & Protection in Little Rock, AR
RELATED REPORTS & OPTIONS
Security & Protection
Little Rock
Compare Zip Codes
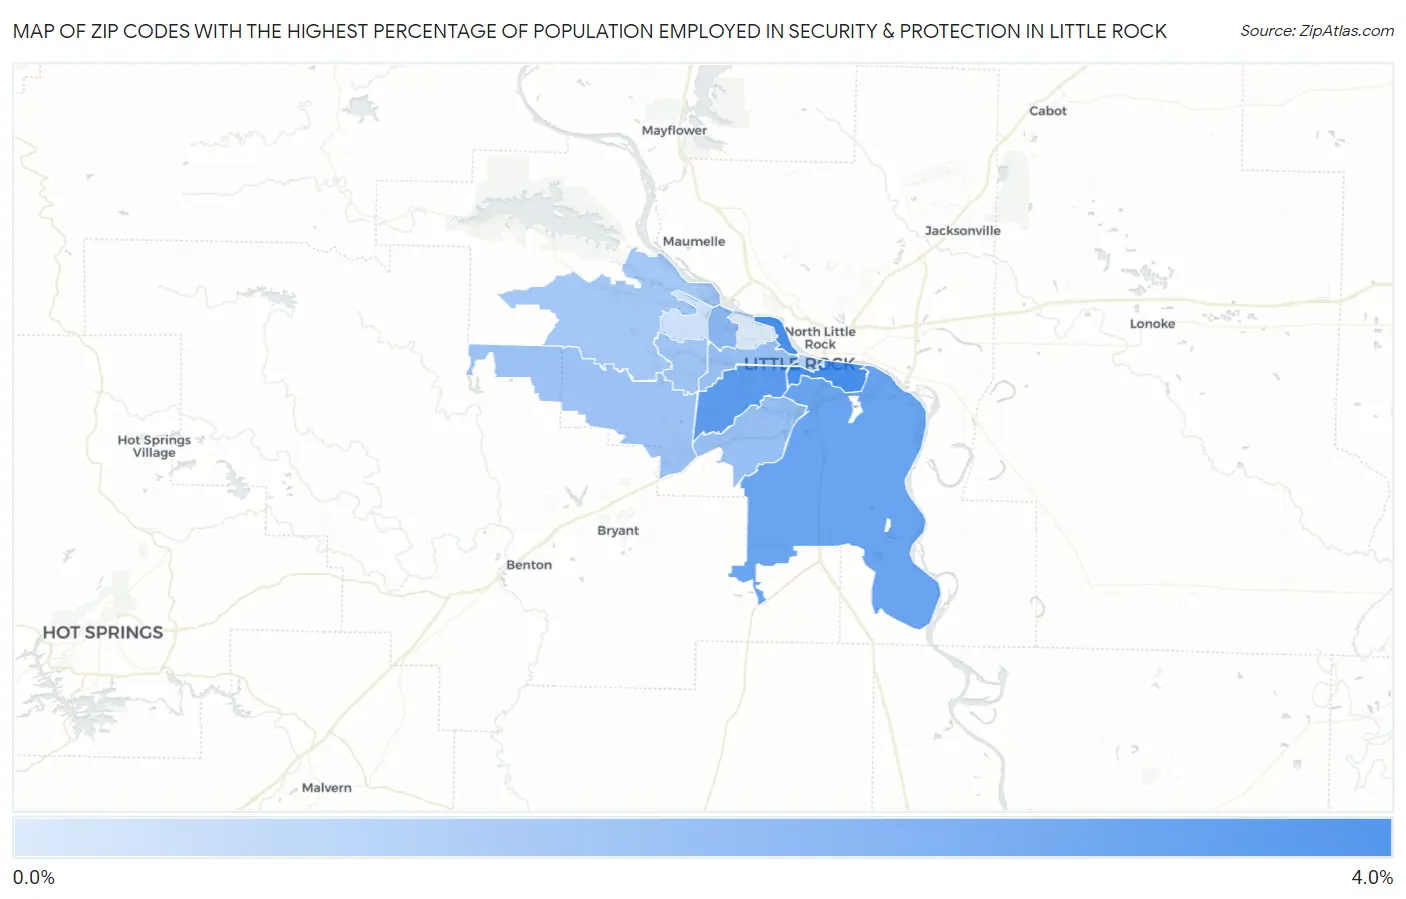
Map of Zip Codes with the Highest Percentage of Population Employed in Security & Protection in Little Rock
0.29%
3.2%
Zip Codes with the Highest Percentage of Population Employed in Security & Protection in Little Rock, AR
| Zip Code | % Employed | vs State | vs National | |
| 1. | 72202 | 3.2% | 2.0%(+1.15)#111 | 2.1%(+1.01)#6,673 |
| 2. | 72204 | 2.8% | 2.0%(+0.808)#135 | 2.1%(+0.663)#8,065 |
| 3. | 72206 | 2.5% | 2.0%(+0.500)#164 | 2.1%(+0.355)#9,491 |
| 4. | 72227 | 1.9% | 2.0%(-0.152)#212 | 2.1%(-0.297)#13,540 |
| 5. | 72209 | 1.6% | 2.0%(-0.396)#234 | 2.1%(-0.540)#15,351 |
| 6. | 72205 | 1.6% | 2.0%(-0.401)#236 | 2.1%(-0.546)#15,396 |
| 7. | 72210 | 1.5% | 2.0%(-0.500)#247 | 2.1%(-0.645)#16,158 |
| 8. | 72211 | 1.5% | 2.0%(-0.514)#251 | 2.1%(-0.659)#16,292 |
| 9. | 72223 | 1.4% | 2.0%(-0.602)#261 | 2.1%(-0.746)#16,930 |
| 10. | 72201 | 1.1% | 2.0%(-0.927)#293 | 2.1%(-1.07)#19,452 |
| 11. | 72212 | 0.55% | 2.0%(-1.45)#337 | 2.1%(-1.60)#22,965 |
| 12. | 72207 | 0.29% | 2.0%(-1.71)#363 | 2.1%(-1.86)#24,210 |
1
Common Questions
What are the Top 10 Zip Codes with the Highest Percentage of Population Employed in Security & Protection in Little Rock, AR?
Top 10 Zip Codes with the Highest Percentage of Population Employed in Security & Protection in Little Rock, AR are:
What zip code has the Highest Percentage of Population Employed in Security & Protection in Little Rock, AR?
72202 has the Highest Percentage of Population Employed in Security & Protection in Little Rock, AR with 3.2%.
What is the Percentage of Population Employed in Security & Protection in Little Rock, AR?
Percentage of Population Employed in Security & Protection in Little Rock is 1.7%.
What is the Percentage of Population Employed in Security & Protection in Arkansas?
Percentage of Population Employed in Security & Protection in Arkansas is 2.0%.
What is the Percentage of Population Employed in Security & Protection in the United States?
Percentage of Population Employed in Security & Protection in the United States is 2.1%.