Zip Codes with the Highest Percentage of Families with Income Above $200,000 in Little Rock, AR

RELATED REPORTS & OPTIONS

Family Income | $200k+
Population
Families and Households
Female Fertility
Female Fertility (Unmarried)
Race (Community Size)
Race (Percentage)
Ancestry (Community Size)
AfricanAmericanApacheArabArgentineanArmenianAssyrian / Chaldean / SyriacAustrianBelgianBhutaneseBlackfeetBritishBurmeseCajunCanadianCelticCentral AmericanCherokeeChileanChoctawColombianCroatianCubanCzechCzechoslovakianDanishDutchEastern EuropeanEgyptianEnglishEuropeanFinnishFrenchFrench CanadianGermanGhanaianGreekGuatemalanGuyaneseHonduranHungarianIndian (Asian)InupiatIranianIrishIroquoisIsraeliItalianJamaicanKoreanLaotianLebaneseLithuanianMalaysianMexicanMexican American IndianMoroccanNative HawaiianNicaraguanNigerianNorthern EuropeanNorwegianOsagePakistaniPanamanianPolishPortuguesePuerto RicanRomanianRussianSalvadoranScandinavianScotch-IrishScottishSiouxSlavicSlovakSouth AmericanSpaniardSpanishSri LankanSubsaharan AfricanSwedishSwissSyrianThaiTrinidadian and TobagonianTurkishUkrainianVenezuelanVietnameseWelshWest IndianYugoslavian
Ancestry (Percentage)
AfricanAmericanApacheArabArgentineanArmenianAssyrian / Chaldean / SyriacAustrianBelgianBhutaneseBlackfeetBritishBurmeseCajunCanadianCelticCentral AmericanCherokeeChileanChoctawColombianCroatianCubanCzechCzechoslovakianDanishDutchEastern EuropeanEgyptianEnglishEuropeanFinnishFrenchFrench CanadianGermanGhanaianGreekGuatemalanGuyaneseHonduranHungarianIndian (Asian)InupiatIranianIrishIroquoisIsraeliItalianJamaicanKoreanLaotianLebaneseLithuanianMalaysianMexicanMexican American IndianMoroccanNative HawaiianNicaraguanNigerianNorthern EuropeanNorwegianOsagePakistaniPanamanianPolishPortuguesePuerto RicanRomanianRussianSalvadoranScandinavianScotch-IrishScottishSiouxSlavicSlovakSouth AmericanSpaniardSpanishSri LankanSubsaharan AfricanSwedishSwissSyrianThaiTrinidadian and TobagonianTurkishUkrainianVenezuelanVietnameseWelshWest IndianYugoslavian
Immigrant Origin (Total)
Immigrant Origin (Percentage)
Income
Income (Families)
Income (Households)
Poverty
Poverty (Families)
Unemployment
Employment Occupations
Employment Industries
Employer Class
Commute Time
Commute Means
School Enrollment
Education by Degree Field
Occupancy
Finances
Physical Characteristics
Little Rock
Compare Zip Codes
Comparison Subject

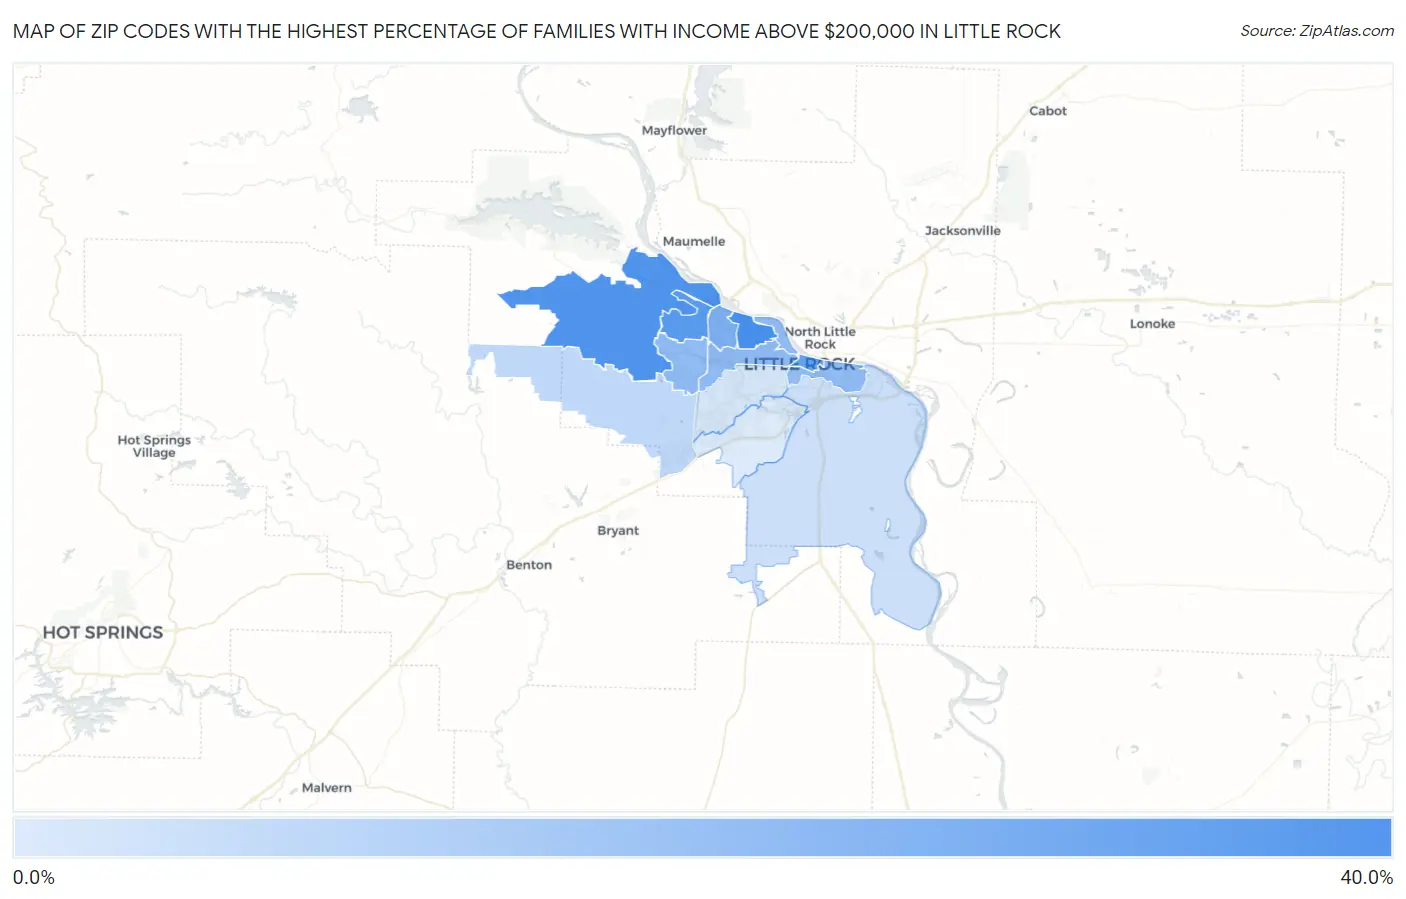
Map of Zip Codes with the Highest Percentage of Families with Income Above $200,000 in Little Rock

0.0%
40.0%
Zip Codes with the Highest Percentage of Families with Income Above $200,000 in Little Rock Map

Zip Codes with the Highest Percentage of Families with Income Above $200,000 in Little Rock, AR

Zip Code Families with Income > $200k vs State vs National
1.7220735.7%7.7%(+28.0)#914.8%(+20.9)#1,759
2.7222333.2%7.7%(+25.5)#1114.8%(+18.4)#2,081
3.7221231.3%7.7%(+23.6)#1314.8%(+16.5)#2,329
4.7220128.2%7.7%(+20.5)#1514.8%(+13.4)#2,845
5.7222721.8%7.7%(+14.1)#2414.8%(+7.00)#4,276
6.7221117.8%7.7%(+10.1)#3114.8%(+3.00)#5,640
7.7220517.8%7.7%(+10.1)#3214.8%(+3.00)#5,641
8.7220217.6%7.7%(+9.90)#3414.8%(+2.80)#5,738
9.722107.0%7.7%(-0.700)#11214.8%(-7.80)#14,709
10.722064.2%7.7%(-3.50)#20614.8%(-10.6)#20,004
11.722042.4%7.7%(-5.30)#28114.8%(-12.4)#23,695
12.722091.1%7.7%(-6.60)#34714.8%(-13.7)#25,914

Common Questions

What are the Top 10 Zip Codes with the Highest Percentage of Families with Income Above $200,000 in Little Rock, AR?
Top 10 Zip Codes with the Highest Percentage of Families with Income Above $200,000 in Little Rock, AR are:
#1
35.7%
#2
33.2%
#3
31.3%
#4
28.2%
#5
21.8%
#6
17.8%
#7
17.8%
#8
17.6%
#9
7.0%
#10
4.2%
What zip code has the Highest Percentage of Families with Income Above $200,000 in Little Rock, AR?
72207 has the Highest Percentage of Families with Income Above $200,000 in Little Rock, AR with 35.7%.
What is the Percentage of Families with Income Above $200,000 in Little Rock, AR?
Percentage of Families with Income Above $200,000 in Little Rock is 15.9%.
What is the Percentage of Families with Income Above $200,000 in Arkansas?
Percentage of Families with Income Above $200,000 in Arkansas is 7.7%.
What is the Percentage of Families with Income Above $200,000 in the United States?
Percentage of Families with Income Above $200,000 in the United States is 14.8%.