Zip Codes with the Lowest Births per 1,000 Women in Labor Force in Little Rock, AR

RELATED REPORTS & OPTIONS

Lowest Birth Rate | In Labor Force
Population
Families and Households
Female Fertility
Female Fertility (Unmarried)
Race (Community Size)
Race (Percentage)
Ancestry (Community Size)
AfricanAmericanApacheArabArgentineanArmenianAssyrian / Chaldean / SyriacAustrianBelgianBhutaneseBlackfeetBritishBurmeseCajunCanadianCelticCentral AmericanCherokeeChileanChoctawColombianCroatianCubanCzechCzechoslovakianDanishDutchEastern EuropeanEgyptianEnglishEuropeanFinnishFrenchFrench CanadianGermanGhanaianGreekGuatemalanGuyaneseHonduranHungarianIndian (Asian)InupiatIranianIrishIroquoisIsraeliItalianJamaicanKoreanLaotianLebaneseLithuanianMalaysianMexicanMexican American IndianMoroccanNative HawaiianNicaraguanNigerianNorthern EuropeanNorwegianOsagePakistaniPanamanianPolishPortuguesePuerto RicanRomanianRussianSalvadoranScandinavianScotch-IrishScottishSiouxSlavicSlovakSouth AmericanSpaniardSpanishSri LankanSubsaharan AfricanSwedishSwissSyrianThaiTrinidadian and TobagonianTurkishUkrainianVenezuelanVietnameseWelshWest IndianYugoslavian
Ancestry (Percentage)
AfricanAmericanApacheArabArgentineanArmenianAssyrian / Chaldean / SyriacAustrianBelgianBhutaneseBlackfeetBritishBurmeseCajunCanadianCelticCentral AmericanCherokeeChileanChoctawColombianCroatianCubanCzechCzechoslovakianDanishDutchEastern EuropeanEgyptianEnglishEuropeanFinnishFrenchFrench CanadianGermanGhanaianGreekGuatemalanGuyaneseHonduranHungarianIndian (Asian)InupiatIranianIrishIroquoisIsraeliItalianJamaicanKoreanLaotianLebaneseLithuanianMalaysianMexicanMexican American IndianMoroccanNative HawaiianNicaraguanNigerianNorthern EuropeanNorwegianOsagePakistaniPanamanianPolishPortuguesePuerto RicanRomanianRussianSalvadoranScandinavianScotch-IrishScottishSiouxSlavicSlovakSouth AmericanSpaniardSpanishSri LankanSubsaharan AfricanSwedishSwissSyrianThaiTrinidadian and TobagonianTurkishUkrainianVenezuelanVietnameseWelshWest IndianYugoslavian
Immigrant Origin (Total)
Immigrant Origin (Percentage)
Income
Income (Families)
Income (Households)
Poverty
Poverty (Families)
Unemployment
Employment Occupations
Employment Industries
Employer Class
Commute Time
Commute Means
School Enrollment
Education by Degree Field
Occupancy
Finances
Physical Characteristics
Little Rock
Compare Zip Codes
Comparison Subject

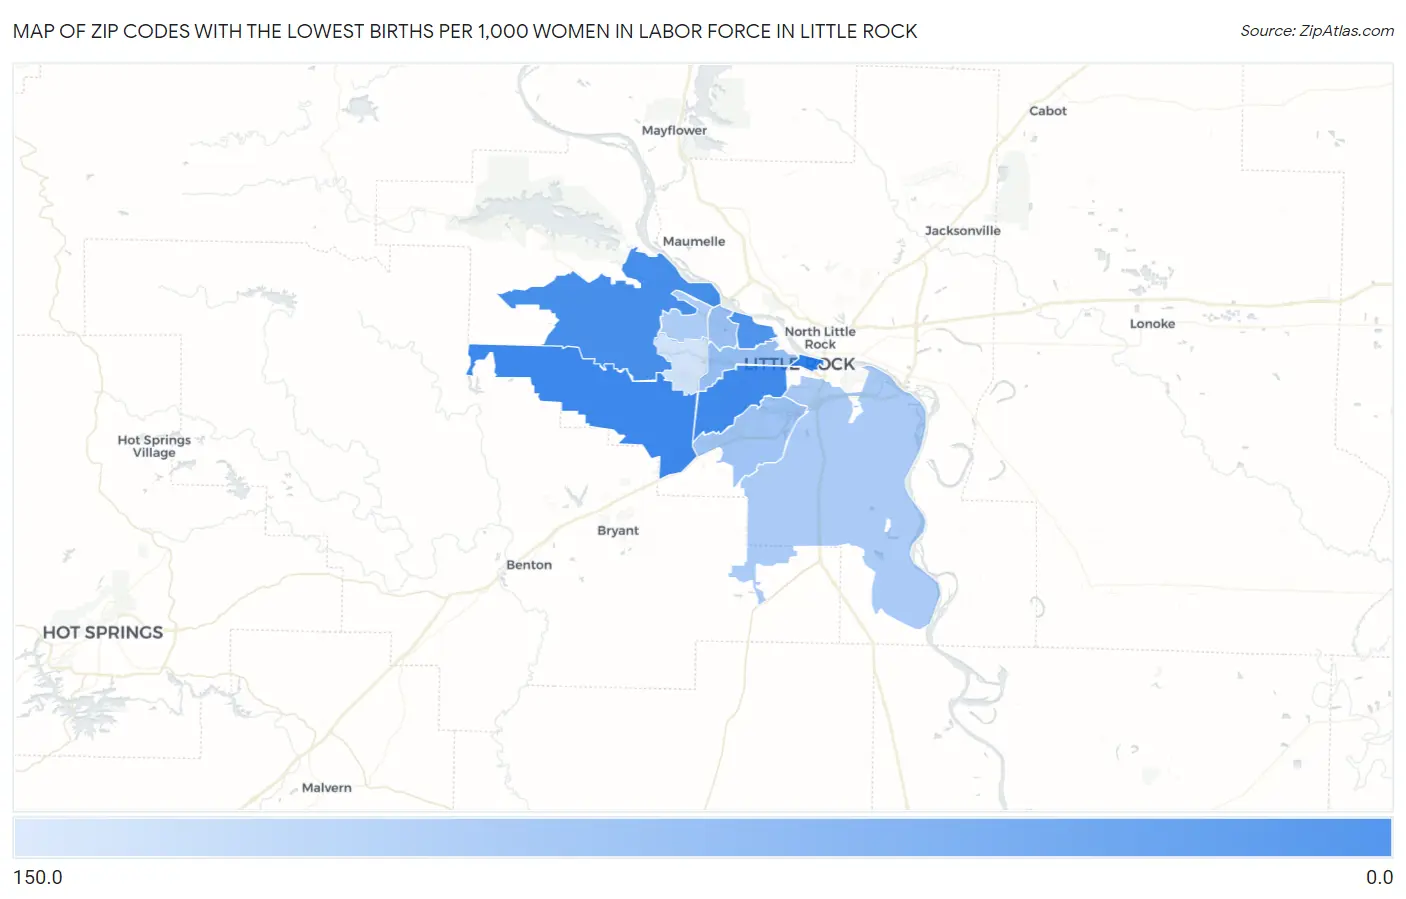
Map of Zip Codes with the Lowest Births per 1,000 Women in Labor Force in Little Rock

150.0
0.0
Zip Codes with the Lowest Births per 1,000 Women in Labor Force in Little Rock Map

Zip Codes with the Lowest Births per 1,000 Women in Labor Force in Little Rock, AR

Zip Code Births / 1,000 Women vs State vs National
1.7221022.051.0(-29.0)#5348.0(-26.0)#3,142
2.7220423.051.0(-28.0)#5648.0(-25.0)#3,342
3.7222325.051.0(-26.0)#6348.0(-23.0)#3,918
4.7220727.051.0(-24.0)#7648.0(-21.0)#4,574
5.7220559.051.0(+8.00)#17348.0(+11.0)#14,202
6.7222763.051.0(+12.0)#18348.0(+15.0)#15,119
7.7220968.051.0(+17.0)#19648.0(+20.0)#16,083
8.7220675.051.0(+24.0)#21248.0(+27.0)#17,277
9.7221276.051.0(+25.0)#21548.0(+28.0)#17,434
10.72211115.051.0(+64.0)#26848.0(+67.0)#20,509

Common Questions

What are the Top 10 Zip Codes with the Lowest Births per 1,000 Women in Labor Force in Little Rock, AR?
Top 10 Zip Codes with the Lowest Births per 1,000 Women in Labor Force in Little Rock, AR are:
#1
0.0
#2
22.0
#3
23.0
#4
25.0
#5
27.0
#6
59.0
#7
63.0
#8
68.0
#9
75.0
#10
76.0
What zip code has the Lowest Births per 1,000 Women in Labor Force in Little Rock, AR?
72210 has the Lowest Births per 1,000 Women in Labor Force in Little Rock, AR with 22.0.
What is the Number Births per 1,000 Women in Labor Force in Little Rock, AR?
Number Births per 1,000 Women in Labor Force in Little Rock is 55.0.
What is the Number Births per 1,000 Women in Labor Force in Arkansas?
Number Births per 1,000 Women in Labor Force in Arkansas is 51.0.
What is the Number Births per 1,000 Women in Labor Force in the United States?
Number Births per 1,000 Women in Labor Force in the United States is 48.0.