Zip Codes with the Highest Percentage of Households Without a Vehicle in Little Rock, AR
RELATED REPORTS & OPTIONS
Households without a Cars
Little Rock
Compare Zip Codes
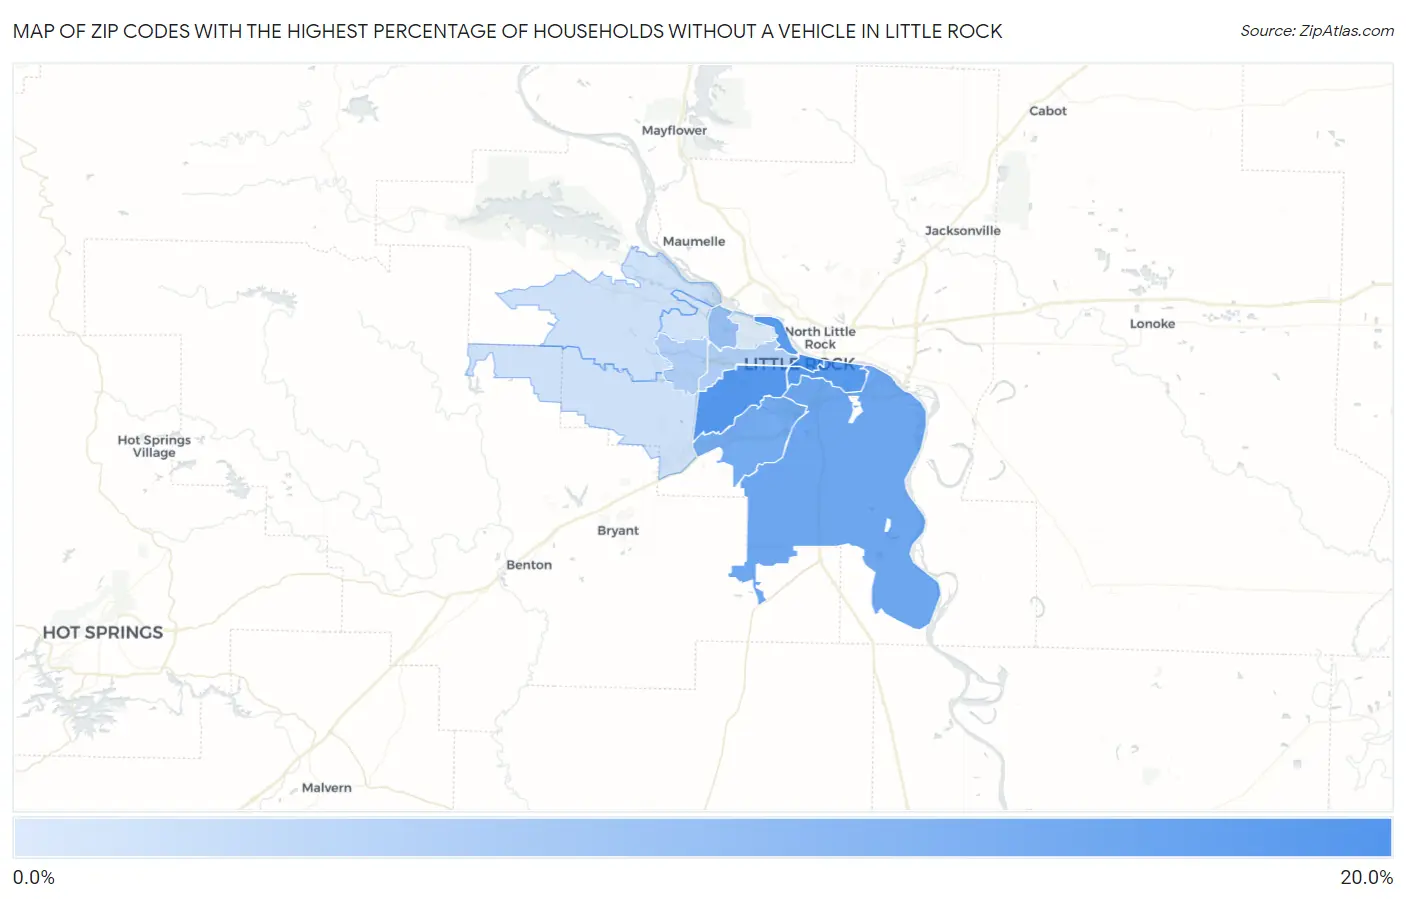
Map of Zip Codes with the Highest Percentage of Households Without a Vehicle in Little Rock
2.5%
15.3%
Zip Codes with the Highest Percentage of Households Without a Vehicle in Little Rock, AR
| Zip Code | Housholds Without a Car | vs State | vs National | |
| 1. | 72201 | 15.3% | 6.0%(+9.30)#36 | 8.3%(+7.00)#2,312 |
| 2. | 72204 | 14.0% | 6.0%(+8.00)#47 | 8.3%(+5.70)#2,697 |
| 3. | 72202 | 13.8% | 6.0%(+7.80)#48 | 8.3%(+5.50)#2,774 |
| 4. | 72206 | 11.9% | 6.0%(+5.90)#66 | 8.3%(+3.60)#3,608 |
| 5. | 72209 | 11.2% | 6.0%(+5.20)#77 | 8.3%(+2.90)#4,012 |
| 6. | 72227 | 8.2% | 6.0%(+2.20)#135 | 8.3%(-0.100)#6,679 |
| 7. | 72211 | 6.1% | 6.0%(+0.100)#178 | 8.3%(-2.20)#10,223 |
| 8. | 72205 | 6.1% | 6.0%(+0.100)#179 | 8.3%(-2.20)#10,228 |
| 9. | 72223 | 3.7% | 6.0%(-2.30)#303 | 8.3%(-4.60)#16,680 |
| 10. | 72210 | 3.7% | 6.0%(-2.30)#304 | 8.3%(-4.60)#16,727 |
| 11. | 72212 | 3.5% | 6.0%(-2.50)#320 | 8.3%(-4.80)#17,389 |
| 12. | 72207 | 2.5% | 6.0%(-3.50)#366 | 8.3%(-5.80)#20,794 |
1
Common Questions
What are the Top 10 Zip Codes with the Highest Percentage of Households Without a Vehicle in Little Rock, AR?
Top 10 Zip Codes with the Highest Percentage of Households Without a Vehicle in Little Rock, AR are:
What zip code has the Highest Percentage of Households Without a Vehicle in Little Rock, AR?
72201 has the Highest Percentage of Households Without a Vehicle in Little Rock, AR with 15.3%.
What is the Percentage of Households Without a Vehicle in Little Rock, AR?
Percentage of Households Without a Vehicle in Little Rock is 8.5%.
What is the Percentage of Households Without a Vehicle in Arkansas?
Percentage of Households Without a Vehicle in Arkansas is 6.0%.
What is the Percentage of Households Without a Vehicle in the United States?
Percentage of Households Without a Vehicle in the United States is 8.3%.