Zip Codes with the Lowest Percentage of Renter-Occupied Units in Little Rock, AR

RELATED REPORTS & OPTIONS

Lowest Renter-Occupied
Population
Families and Households
Female Fertility
Female Fertility (Unmarried)
Race (Community Size)
Race (Percentage)
Ancestry (Community Size)
AfricanAmericanApacheArabArgentineanArmenianAssyrian / Chaldean / SyriacAustrianBelgianBhutaneseBlackfeetBritishBurmeseCajunCanadianCelticCentral AmericanCherokeeChileanChoctawColombianCroatianCubanCzechCzechoslovakianDanishDutchEastern EuropeanEgyptianEnglishEuropeanFinnishFrenchFrench CanadianGermanGhanaianGreekGuatemalanGuyaneseHonduranHungarianIndian (Asian)InupiatIranianIrishIroquoisIsraeliItalianJamaicanKoreanLaotianLebaneseLithuanianMalaysianMexicanMexican American IndianMoroccanNative HawaiianNicaraguanNigerianNorthern EuropeanNorwegianOsagePakistaniPanamanianPolishPortuguesePuerto RicanRomanianRussianSalvadoranScandinavianScotch-IrishScottishSiouxSlavicSlovakSouth AmericanSpaniardSpanishSri LankanSubsaharan AfricanSwedishSwissSyrianThaiTrinidadian and TobagonianTurkishUkrainianVenezuelanVietnameseWelshWest IndianYugoslavian
Ancestry (Percentage)
AfricanAmericanApacheArabArgentineanArmenianAssyrian / Chaldean / SyriacAustrianBelgianBhutaneseBlackfeetBritishBurmeseCajunCanadianCelticCentral AmericanCherokeeChileanChoctawColombianCroatianCubanCzechCzechoslovakianDanishDutchEastern EuropeanEgyptianEnglishEuropeanFinnishFrenchFrench CanadianGermanGhanaianGreekGuatemalanGuyaneseHonduranHungarianIndian (Asian)InupiatIranianIrishIroquoisIsraeliItalianJamaicanKoreanLaotianLebaneseLithuanianMalaysianMexicanMexican American IndianMoroccanNative HawaiianNicaraguanNigerianNorthern EuropeanNorwegianOsagePakistaniPanamanianPolishPortuguesePuerto RicanRomanianRussianSalvadoranScandinavianScotch-IrishScottishSiouxSlavicSlovakSouth AmericanSpaniardSpanishSri LankanSubsaharan AfricanSwedishSwissSyrianThaiTrinidadian and TobagonianTurkishUkrainianVenezuelanVietnameseWelshWest IndianYugoslavian
Immigrant Origin (Total)
Immigrant Origin (Percentage)
Income
Income (Families)
Income (Households)
Poverty
Poverty (Families)
Unemployment
Employment Occupations
Employment Industries
Employer Class
Commute Time
Commute Means
School Enrollment
Education by Degree Field
Occupancy
Finances
Physical Characteristics
Little Rock
Compare Zip Codes
Comparison Subject

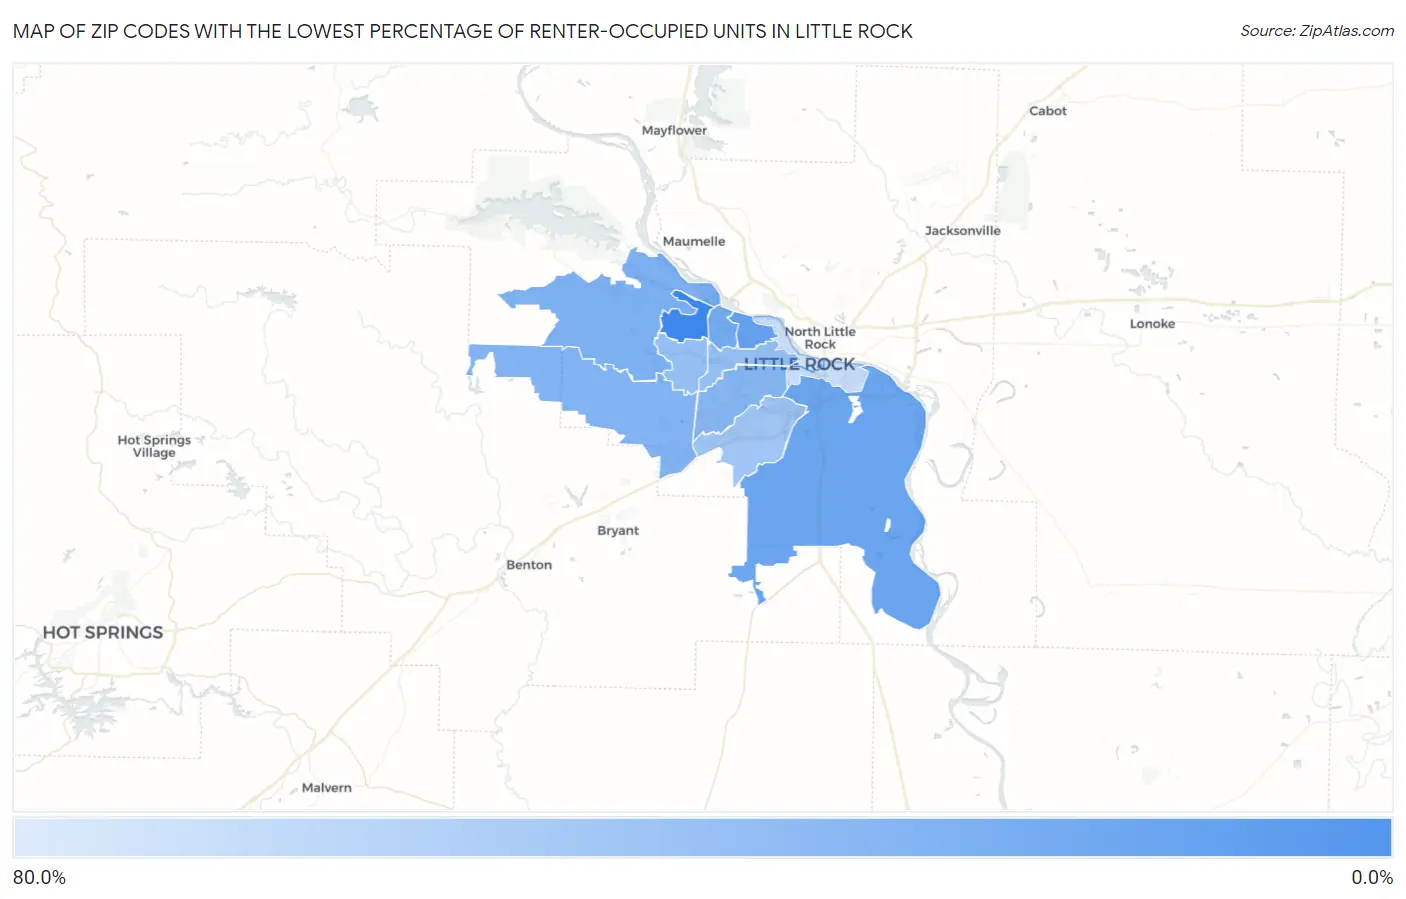
Map of Zip Codes with the Lowest Percentage of Renter-Occupied Units in Little Rock

80.0%
0.0%
Zip Codes with the Lowest Percentage of Renter-Occupied Units in Little Rock Map

Zip Codes with the Lowest Percentage of Renter-Occupied Units in Little Rock, AR

Zip Code % Renter-Occupied vs State vs National
1.7221213.2%33.8%(-20.5)#9835.2%(-21.9)#6,383
2.7220728.8%33.8%(-4.99)#33735.2%(-6.40)#20,269
3.7220631.0%33.8%(-2.78)#36335.2%(-4.19)#21,668
4.7222735.5%33.8%(+1.68)#42135.2%(+0.270)#23,960
5.7222338.7%33.8%(+4.93)#45435.2%(+3.52)#25,284
6.7221040.0%33.8%(+6.19)#45935.2%(+4.78)#25,681
7.7220443.0%33.8%(+9.26)#47635.2%(+7.85)#26,534
8.7221149.2%33.8%(+15.4)#49735.2%(+14.0)#27,867
9.7220549.3%33.8%(+15.6)#49835.2%(+14.2)#27,899
10.7220954.7%33.8%(+21.0)#50935.2%(+19.6)#28,729
11.7220274.1%33.8%(+40.3)#53035.2%(+38.9)#30,234
12.7220179.0%33.8%(+45.2)#53135.2%(+43.8)#30,399

Common Questions

What are the Top 10 Zip Codes with the Lowest Percentage of Renter-Occupied Units in Little Rock, AR?
Top 10 Zip Codes with the Lowest Percentage of Renter-Occupied Units in Little Rock, AR are:
#1
13.2%
#2
28.8%
#3
31.0%
#4
35.5%
#5
38.7%
#6
40.0%
#7
43.0%
#8
49.2%
#9
49.3%
#10
54.7%
What zip code has the Lowest Percentage of Renter-Occupied Units in Little Rock, AR?
72212 has the Lowest Percentage of Renter-Occupied Units in Little Rock, AR with 13.2%.
What is the Percentage of Renter-Occupied Units in Little Rock, AR?
Percentage of Renter-Occupied Units in Little Rock is 45.6%.
What is the Percentage of Renter-Occupied Units in Arkansas?
Percentage of Renter-Occupied Units in Arkansas is 33.8%.
What is the Percentage of Renter-Occupied Units in the United States?
Percentage of Renter-Occupied Units in the United States is 35.2%.