Zip Codes with the Highest Percentage of Population with a Degree in Liberal Arts and History in Little Rock, AR
RELATED REPORTS & OPTIONS
Liberal Arts and History
Little Rock
Compare Zip Codes
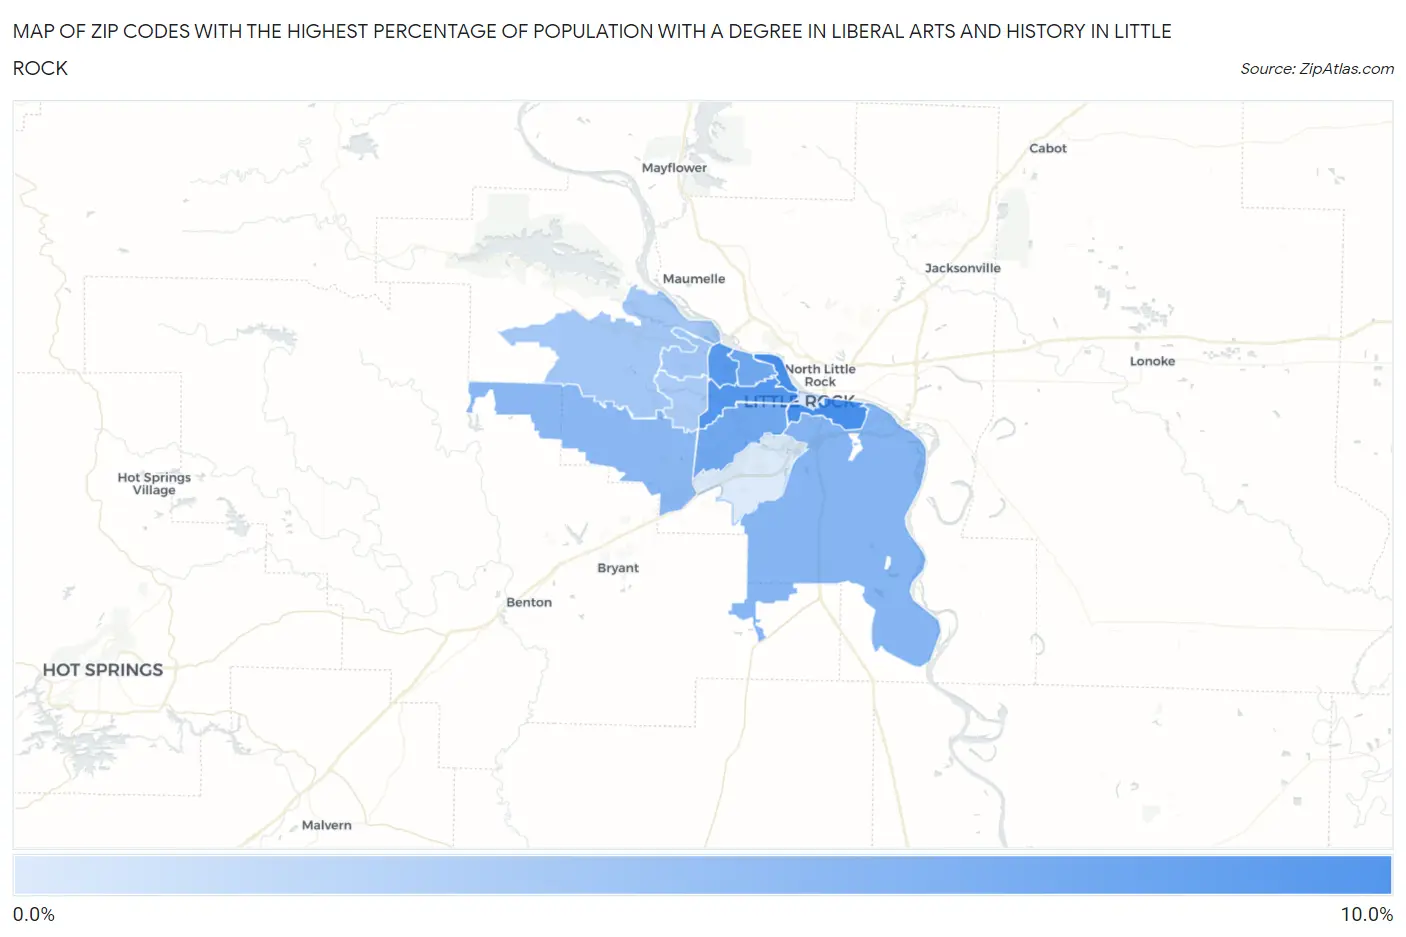
Map of Zip Codes with the Highest Percentage of Population with a Degree in Liberal Arts and History in Little Rock
1.7%
9.5%
Zip Codes with the Highest Percentage of Population with a Degree in Liberal Arts and History in Little Rock, AR
| Zip Code | % Graduates | vs State | vs National | |
| 1. | 72202 | 9.5% | 4.9%(+4.61)#65 | 4.9%(+4.63)#3,452 |
| 2. | 72205 | 8.8% | 4.9%(+3.92)#77 | 4.9%(+3.95)#4,011 |
| 3. | 72227 | 8.6% | 4.9%(+3.73)#81 | 4.9%(+3.76)#4,200 |
| 4. | 72207 | 7.1% | 4.9%(+2.24)#107 | 4.9%(+2.27)#6,180 |
| 5. | 72204 | 7.1% | 4.9%(+2.23)#108 | 4.9%(+2.26)#6,184 |
| 6. | 72206 | 6.2% | 4.9%(+1.27)#132 | 4.9%(+1.30)#8,095 |
| 7. | 72210 | 6.0% | 4.9%(+1.07)#136 | 4.9%(+1.10)#8,596 |
| 8. | 72212 | 4.8% | 4.9%(-0.105)#173 | 4.9%(-0.076)#11,982 |
| 9. | 72223 | 4.7% | 4.9%(-0.210)#180 | 4.9%(-0.182)#12,355 |
| 10. | 72211 | 4.3% | 4.9%(-0.586)#196 | 4.9%(-0.558)#13,589 |
| 11. | 72201 | 1.8% | 4.9%(-3.11)#282 | 4.9%(-3.08)#21,868 |
| 12. | 72209 | 1.7% | 4.9%(-3.16)#286 | 4.9%(-3.14)#22,002 |
1
Common Questions
What are the Top 10 Zip Codes with the Highest Percentage of Population with a Degree in Liberal Arts and History in Little Rock, AR?
Top 10 Zip Codes with the Highest Percentage of Population with a Degree in Liberal Arts and History in Little Rock, AR are:
What zip code has the Highest Percentage of Population with a Degree in Liberal Arts and History in Little Rock, AR?
72202 has the Highest Percentage of Population with a Degree in Liberal Arts and History in Little Rock, AR with 9.5%.
What is the Percentage of Population with a Degree in Liberal Arts and History in Little Rock, AR?
Percentage of Population with a Degree in Liberal Arts and History in Little Rock is 6.2%.
What is the Percentage of Population with a Degree in Liberal Arts and History in Arkansas?
Percentage of Population with a Degree in Liberal Arts and History in Arkansas is 4.9%.
What is the Percentage of Population with a Degree in Liberal Arts and History in the United States?
Percentage of Population with a Degree in Liberal Arts and History in the United States is 4.9%.