Mountain View, AR Map & Demographics
Mountain View Map
Mountain View Overview
$22,568
PER CAPITA INCOME
$72,661
AVG FAMILY INCOME
$23,458
AVG HOUSEHOLD INCOME
24.2%
WAGE / INCOME GAP [ % ]
75.8¢/ $1
WAGE / INCOME GAP [ $ ]
0.55
INEQUALITY / GINI INDEX
2,868
TOTAL POPULATION
1,031
MALE POPULATION
1,837
FEMALE POPULATION
56.12
MALES / 100 FEMALES
178.18
FEMALES / 100 MALES
55.5
MEDIAN AGE
3.7
AVG FAMILY SIZE
2.3
AVG HOUSEHOLD SIZE
771
LABOR FORCE [ PEOPLE ]
31.5%
PERCENT IN LABOR FORCE
Mountain View Zip Codes
Mountain View Area Codes
Income in Mountain View
Income Overview in Mountain View
Per Capita Income in Mountain View is $22,568, while median incomes of families and households are $72,661 and $23,458 respectively.
| Characteristic | Number | Measure |
| Per Capita Income | 2,868 | $22,568 |
| Median Family Income | 484 | $72,661 |
| Mean Family Income | 484 | $78,005 |
| Median Household Income | 1,172 | $23,458 |
| Mean Household Income | 1,172 | $46,092 |
| Income Deficit | 484 | $0 |
| Wage / Income Gap (%) | 2,868 | 24.15% |
| Wage / Income Gap ($) | 2,868 | 75.85¢ per $1 |
| Gini / Inequality Index | 2,868 | 0.55 |
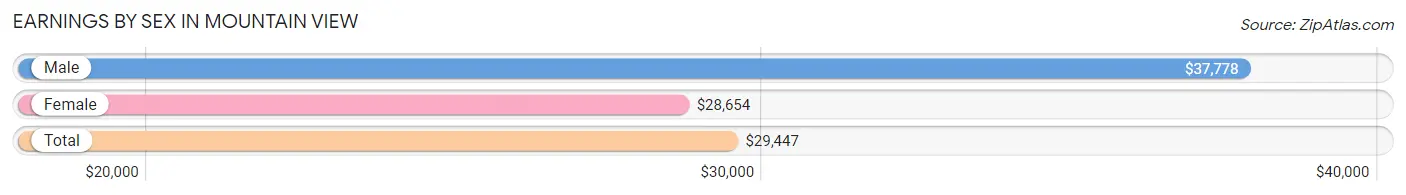
Earnings by Sex in Mountain View
Average Earnings in Mountain View are $29,447, $37,778 for men and $28,654 for women, a difference of 24.1%.
| Sex | Number | Average Earnings |
| Male | 250 (29.8%) | $37,778 |
| Female | 590 (70.2%) | $28,654 |
| Total | 840 (100.0%) | $29,447 |
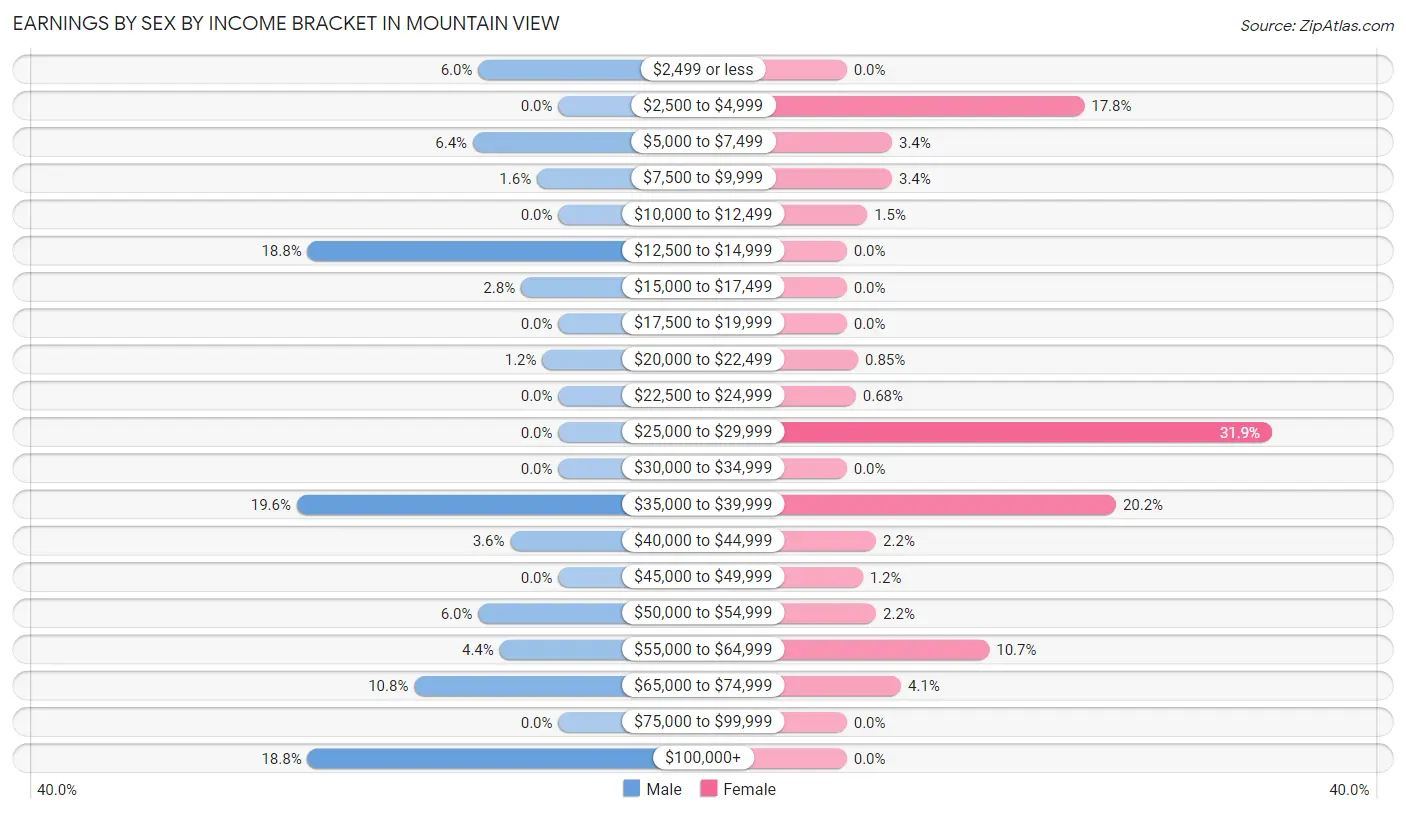
Earnings by Sex by Income Bracket in Mountain View
The most common earnings brackets in Mountain View are $35,000 to $39,999 for men (49 | 19.6%) and $25,000 to $29,999 for women (188 | 31.9%).
| Income | Male | Female |
| $2,499 or less | 15 (6.0%) | 0 (0.0%) |
| $2,500 to $4,999 | 0 (0.0%) | 105 (17.8%) |
| $5,000 to $7,499 | 16 (6.4%) | 20 (3.4%) |
| $7,500 to $9,999 | 4 (1.6%) | 20 (3.4%) |
| $10,000 to $12,499 | 0 (0.0%) | 9 (1.5%) |
| $12,500 to $14,999 | 47 (18.8%) | 0 (0.0%) |
| $15,000 to $17,499 | 7 (2.8%) | 0 (0.0%) |
| $17,500 to $19,999 | 0 (0.0%) | 0 (0.0%) |
| $20,000 to $22,499 | 3 (1.2%) | 5 (0.9%) |
| $22,500 to $24,999 | 0 (0.0%) | 4 (0.7%) |
| $25,000 to $29,999 | 0 (0.0%) | 188 (31.9%) |
| $30,000 to $34,999 | 0 (0.0%) | 0 (0.0%) |
| $35,000 to $39,999 | 49 (19.6%) | 119 (20.2%) |
| $40,000 to $44,999 | 9 (3.6%) | 13 (2.2%) |
| $45,000 to $49,999 | 0 (0.0%) | 7 (1.2%) |
| $50,000 to $54,999 | 15 (6.0%) | 13 (2.2%) |
| $55,000 to $64,999 | 11 (4.4%) | 63 (10.7%) |
| $65,000 to $74,999 | 27 (10.8%) | 24 (4.1%) |
| $75,000 to $99,999 | 0 (0.0%) | 0 (0.0%) |
| $100,000+ | 47 (18.8%) | 0 (0.0%) |
| Total | 250 (100.0%) | 590 (100.0%) |
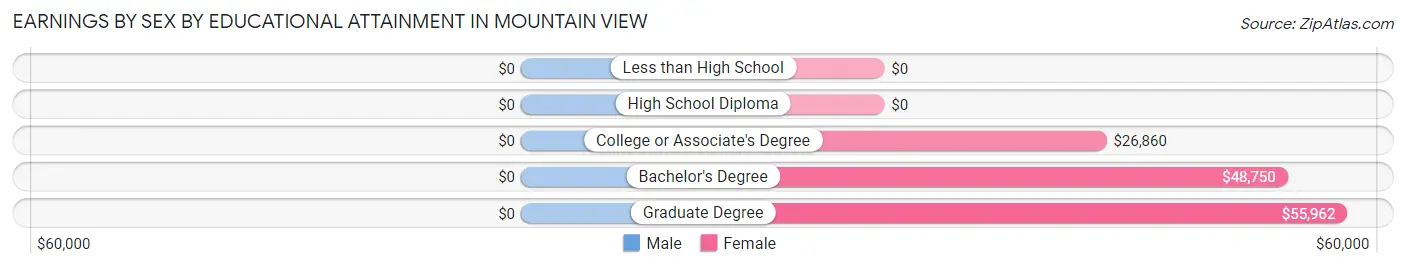
Earnings by Sex by Educational Attainment in Mountain View
| Educational Attainment | Male Income | Female Income |
| Less than High School | - | - |
| High School Diploma | - | - |
| College or Associate's Degree | - | - |
| Bachelor's Degree | - | - |
| Graduate Degree | - | - |
| Total | $37,569 | $28,353 |
Family Income in Mountain View
Family Income Brackets in Mountain View
According to the Mountain View family income data, there are 132 families falling into the $75,000 to $99,999 income range, which is the most common income bracket and makes up 27.3% of all families. Conversely, the $15,000 to $24,999 income bracket is the least frequent group with only 4 families (0.8%) belonging to this category.
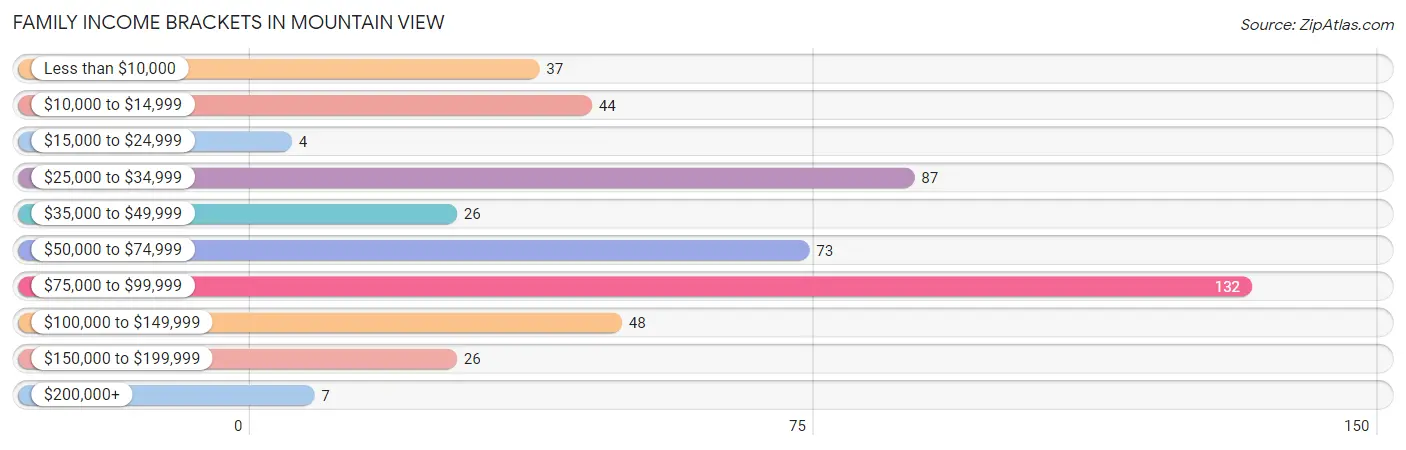
| Income Bracket | # Families | % Families |
| Less than $10,000 | 37 | 7.6% |
| $10,000 to $14,999 | 44 | 9.1% |
| $15,000 to $24,999 | 4 | 0.8% |
| $25,000 to $34,999 | 87 | 18.0% |
| $35,000 to $49,999 | 26 | 5.4% |
| $50,000 to $74,999 | 73 | 15.1% |
| $75,000 to $99,999 | 132 | 27.3% |
| $100,000 to $149,999 | 48 | 9.9% |
| $150,000 to $199,999 | 26 | 5.4% |
| $200,000+ | 7 | 1.4% |
Family Income by Famaliy Size in Mountain View
2-person families (279 | 57.6%) account for the highest median family income in Mountain View with $73,819 per family, while 2-person families (279 | 57.6%) have the highest median income of $36,910 per family member.
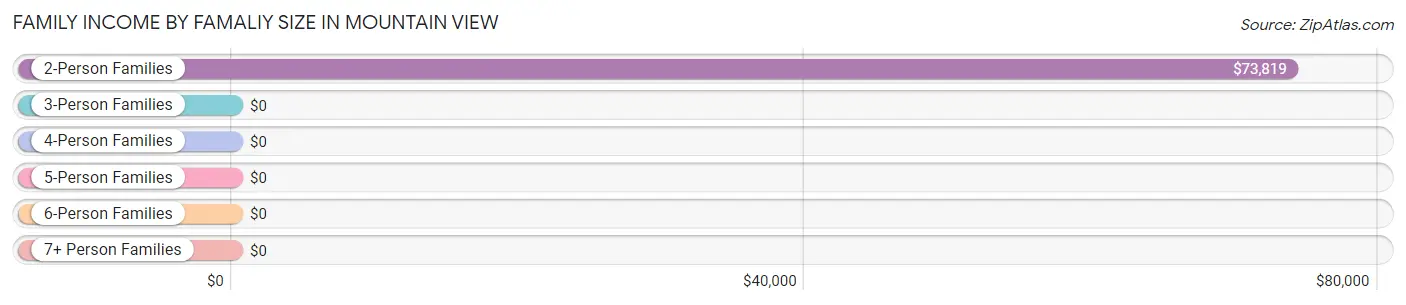
| Income Bracket | # Families | Median Income |
| 2-Person Families | 279 (57.6%) | $73,819 |
| 3-Person Families | 91 (18.8%) | $0 |
| 4-Person Families | 92 (19.0%) | $0 |
| 5-Person Families | 19 (3.9%) | $0 |
| 6-Person Families | 3 (0.6%) | $0 |
| 7+ Person Families | 0 (0.0%) | $0 |
| Total | 484 (100.0%) | $72,661 |
Family Income by Number of Earners in Mountain View
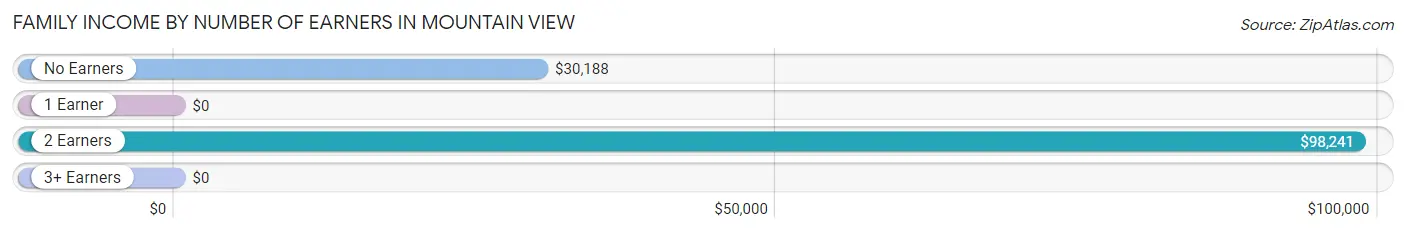
| Number of Earners | # Families | Median Income |
| No Earners | 163 (33.7%) | $30,188 |
| 1 Earner | 151 (31.2%) | $0 |
| 2 Earners | 170 (35.1%) | $98,241 |
| 3+ Earners | 0 (0.0%) | $0 |
| Total | 484 (100.0%) | $72,661 |
Household Income in Mountain View
Household Income Brackets in Mountain View
With 286 households falling in the category, the $15,000 to $24,999 income range is the most frequent in Mountain View, accounting for 24.4% of all households. In contrast, only 7 households (0.6%) fall into the $200,000+ income bracket, making it the least populous group.
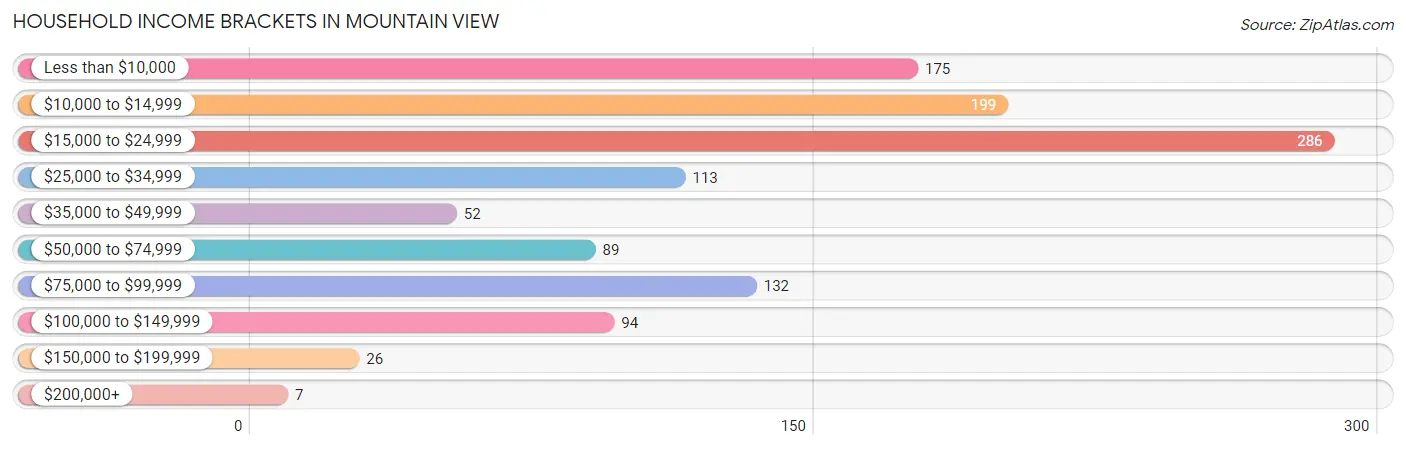
| Income Bracket | # Households | % Households |
| Less than $10,000 | 175 | 14.9% |
| $10,000 to $14,999 | 199 | 17.0% |
| $15,000 to $24,999 | 286 | 24.4% |
| $25,000 to $34,999 | 113 | 9.6% |
| $35,000 to $49,999 | 52 | 4.4% |
| $50,000 to $74,999 | 89 | 7.6% |
| $75,000 to $99,999 | 132 | 11.3% |
| $100,000 to $149,999 | 94 | 8.0% |
| $150,000 to $199,999 | 26 | 2.2% |
| $200,000+ | 7 | 0.6% |
Household Income by Householder Age in Mountain View
The median household income in Mountain View is $23,458, with the highest median household income of $24,224 found in the 65+ years age bracket for the primary householder. A total of 654 households (55.8%) fall into this category. Meanwhile, the 15 to 24 years age bracket for the primary householder has the lowest median household income of $0, with 22 households (1.9%) in this group.
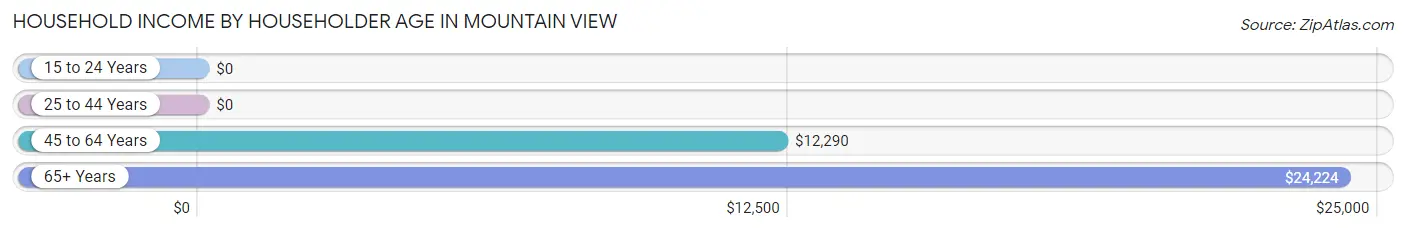
| Income Bracket | # Households | Median Income |
| 15 to 24 Years | 22 (1.9%) | $0 |
| 25 to 44 Years | 153 (13.1%) | $0 |
| 45 to 64 Years | 343 (29.3%) | $12,290 |
| 65+ Years | 654 (55.8%) | $24,224 |
| Total | 1,172 (100.0%) | $23,458 |
Poverty in Mountain View
Income Below Poverty by Sex and Age in Mountain View
With 29.9% poverty level for males and 26.8% for females among the residents of Mountain View, 55 to 64 year old males and under 5 year old females are the most vulnerable to poverty, with 158 males (92.4%) and 69 females (100.0%) in their respective age groups living below the poverty level.
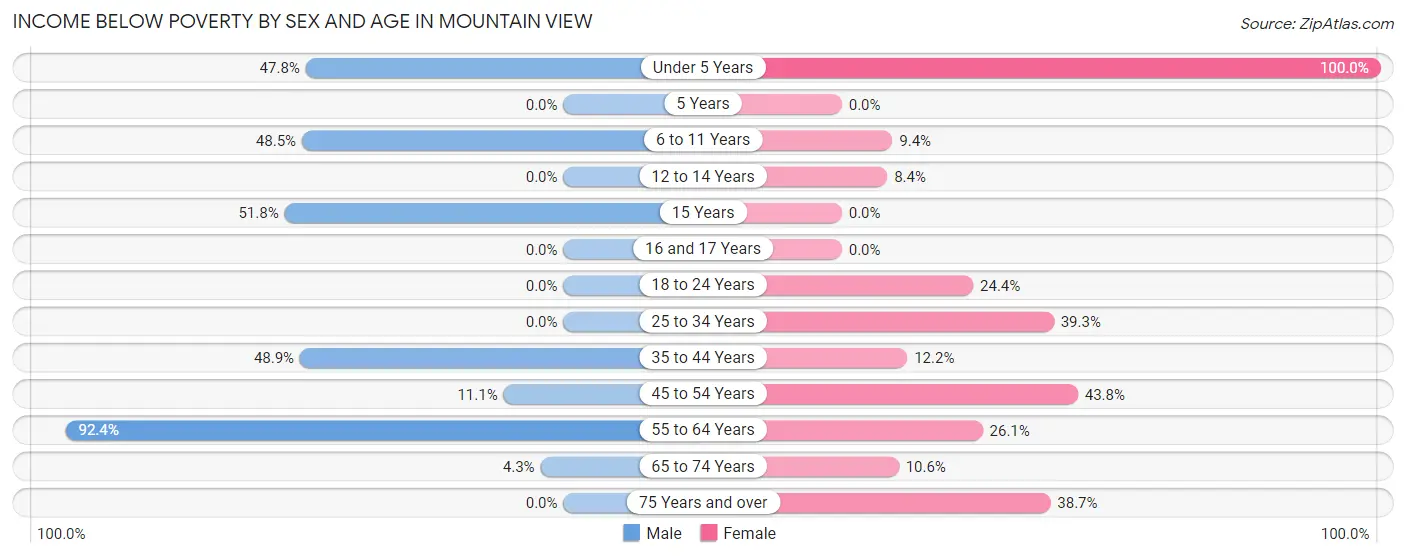
| Age Bracket | Male | Female |
| Under 5 Years | 11 (47.8%) | 69 (100.0%) |
| 5 Years | 0 (0.0%) | 0 (0.0%) |
| 6 to 11 Years | 33 (48.5%) | 6 (9.4%) |
| 12 to 14 Years | 0 (0.0%) | 7 (8.4%) |
| 15 Years | 44 (51.8%) | 0 (0.0%) |
| 16 and 17 Years | 0 (0.0%) | 0 (0.0%) |
| 18 to 24 Years | 0 (0.0%) | 68 (24.4%) |
| 25 to 34 Years | 0 (0.0%) | 24 (39.3%) |
| 35 to 44 Years | 22 (48.9%) | 22 (12.1%) |
| 45 to 54 Years | 17 (11.1%) | 46 (43.8%) |
| 55 to 64 Years | 158 (92.4%) | 86 (26.1%) |
| 65 to 74 Years | 9 (4.3%) | 30 (10.6%) |
| 75 Years and over | 0 (0.0%) | 120 (38.7%) |
| Total | 294 (29.9%) | 478 (26.8%) |
Income Above Poverty by Sex and Age in Mountain View
According to the poverty statistics in Mountain View, males aged 5 years and females aged 5 years are the age groups that are most secure financially, with 100.0% of males and 100.0% of females in these age groups living above the poverty line.
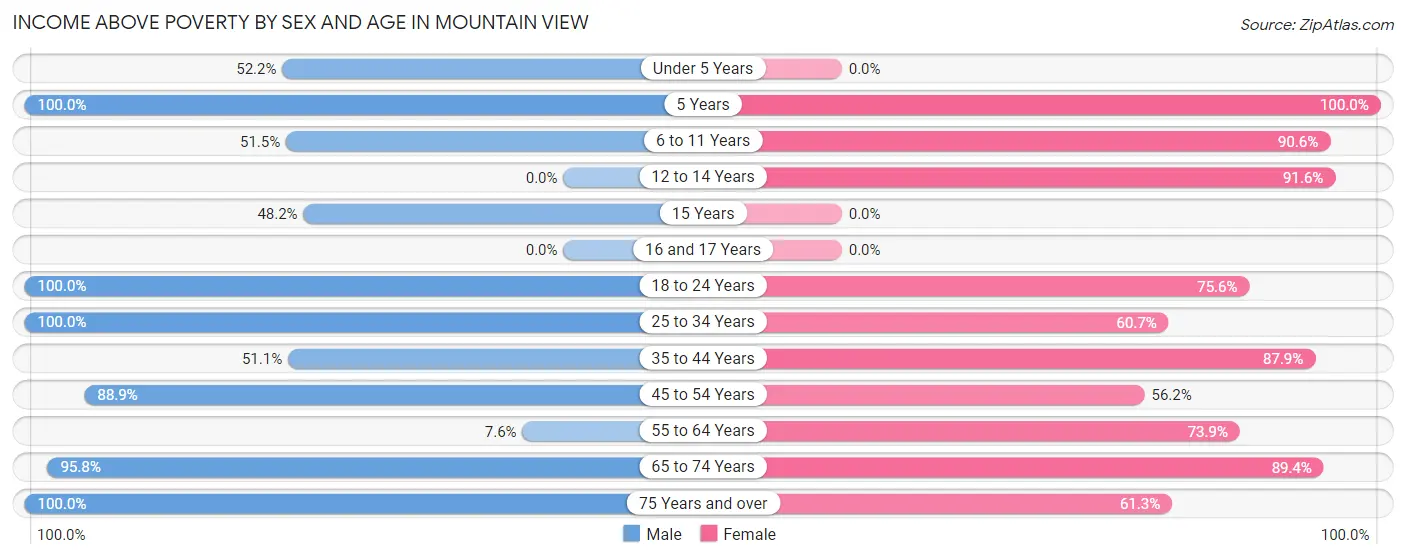
| Age Bracket | Male | Female |
| Under 5 Years | 12 (52.2%) | 0 (0.0%) |
| 5 Years | 10 (100.0%) | 17 (100.0%) |
| 6 to 11 Years | 35 (51.5%) | 58 (90.6%) |
| 12 to 14 Years | 0 (0.0%) | 76 (91.6%) |
| 15 Years | 41 (48.2%) | 0 (0.0%) |
| 16 and 17 Years | 0 (0.0%) | 0 (0.0%) |
| 18 to 24 Years | 3 (100.0%) | 211 (75.6%) |
| 25 to 34 Years | 52 (100.0%) | 37 (60.7%) |
| 35 to 44 Years | 23 (51.1%) | 159 (87.8%) |
| 45 to 54 Years | 136 (88.9%) | 59 (56.2%) |
| 55 to 64 Years | 13 (7.6%) | 243 (73.9%) |
| 65 to 74 Years | 203 (95.8%) | 254 (89.4%) |
| 75 Years and over | 160 (100.0%) | 190 (61.3%) |
| Total | 688 (70.1%) | 1,304 (73.2%) |
Income Below Poverty Among Married-Couple Families in Mountain View
The poverty statistics for married-couple families in Mountain View show that 8.7% or 27 of the total 310 families live below the poverty line. Families with 1 or 2 children have the highest poverty rate of 23.7%, comprising of 18 families. On the other hand, families with 3 or 4 children have the lowest poverty rate of 0.0%, which includes 0 families.
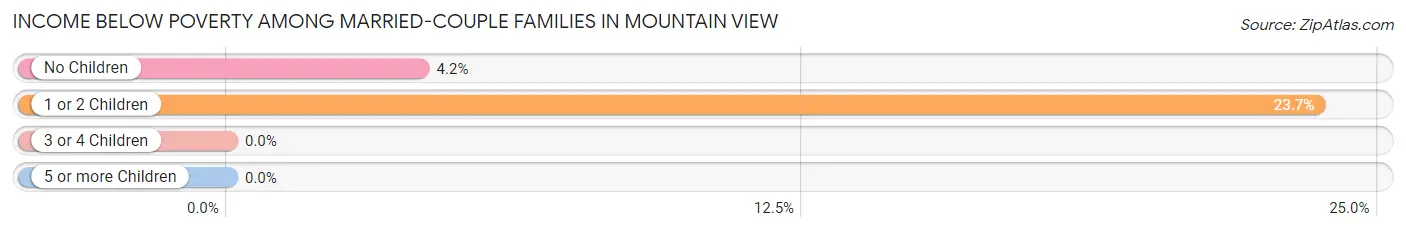
| Children | Above Poverty | Below Poverty |
| No Children | 207 (95.8%) | 9 (4.2%) |
| 1 or 2 Children | 58 (76.3%) | 18 (23.7%) |
| 3 or 4 Children | 18 (100.0%) | 0 (0.0%) |
| 5 or more Children | 0 (0.0%) | 0 (0.0%) |
| Total | 283 (91.3%) | 27 (8.7%) |
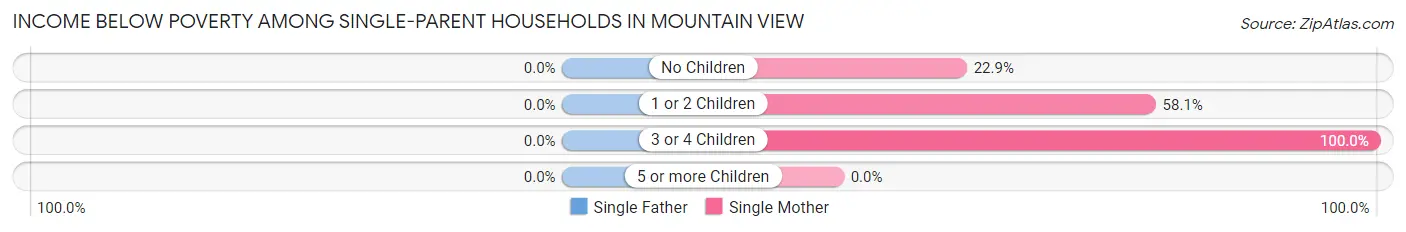
Income Below Poverty Among Single-Parent Households in Mountain View
| Children | Single Father | Single Mother |
| No Children | 0 (0.0%) | 11 (22.9%) |
| 1 or 2 Children | 0 (0.0%) | 43 (58.1%) |
| 3 or 4 Children | 0 (0.0%) | 4 (100.0%) |
| 5 or more Children | 0 (0.0%) | 0 (0.0%) |
| Total | 0 (0.0%) | 58 (46.0%) |
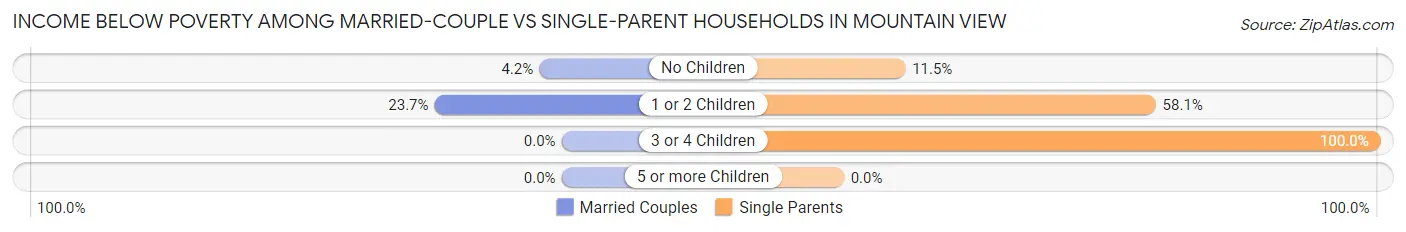
Income Below Poverty Among Married-Couple vs Single-Parent Households in Mountain View
The poverty data for Mountain View shows that 27 of the married-couple family households (8.7%) and 58 of the single-parent households (33.3%) are living below the poverty level. Within the married-couple family households, those with 1 or 2 children have the highest poverty rate, with 18 households (23.7%) falling below the poverty line. Among the single-parent households, those with 3 or 4 children have the highest poverty rate, with 4 household (100.0%) living below poverty.
| Children | Married-Couple Families | Single-Parent Households |
| No Children | 9 (4.2%) | 11 (11.5%) |
| 1 or 2 Children | 18 (23.7%) | 43 (58.1%) |
| 3 or 4 Children | 0 (0.0%) | 4 (100.0%) |
| 5 or more Children | 0 (0.0%) | 0 (0.0%) |
| Total | 27 (8.7%) | 58 (33.3%) |
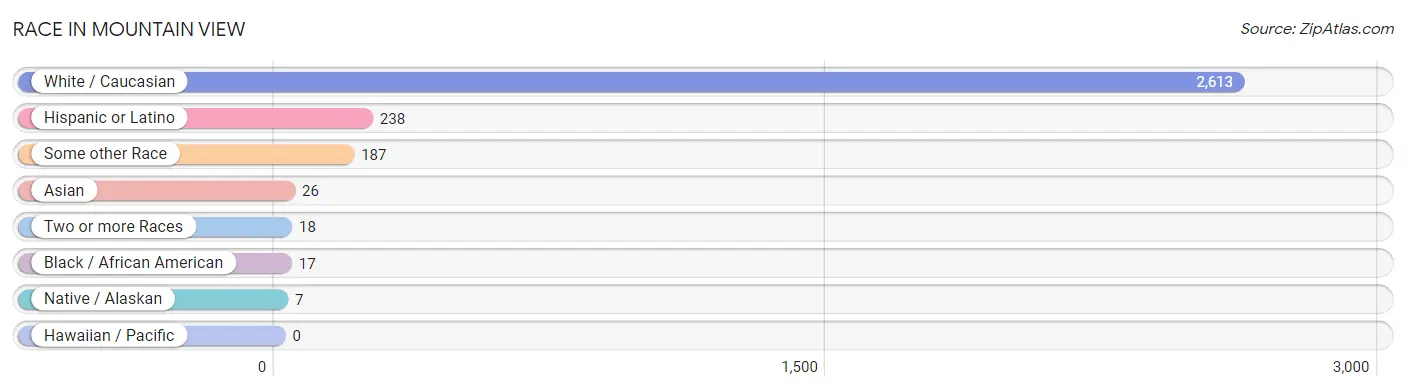
Race in Mountain View
The most populous races in Mountain View are White / Caucasian (2,613 | 91.1%), Hispanic or Latino (238 | 8.3%), and Some other Race (187 | 6.5%).
| Race | # Population | % Population |
| Asian | 26 | 0.9% |
| Black / African American | 17 | 0.6% |
| Hawaiian / Pacific | 0 | 0.0% |
| Hispanic or Latino | 238 | 8.3% |
| Native / Alaskan | 7 | 0.2% |
| White / Caucasian | 2,613 | 91.1% |
| Two or more Races | 18 | 0.6% |
| Some other Race | 187 | 6.5% |
| Total | 2,868 | 100.0% |
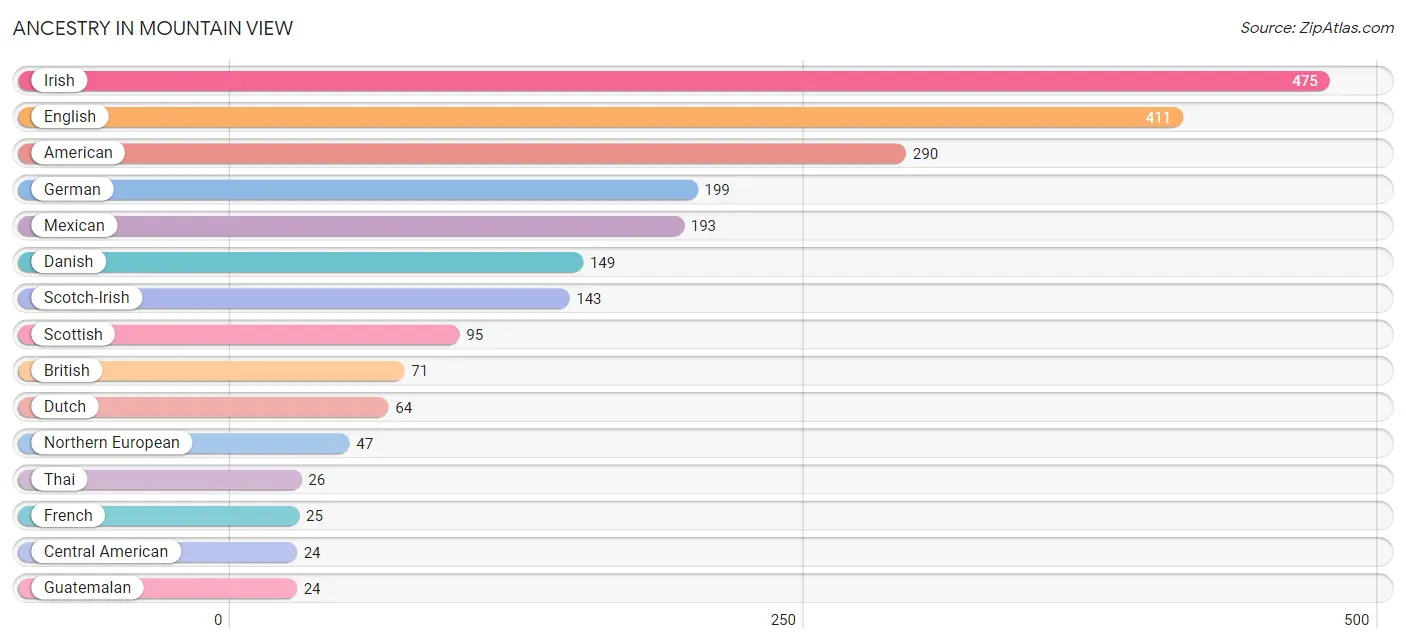
Ancestry in Mountain View
The most populous ancestries reported in Mountain View are Irish (475 | 16.6%), English (411 | 14.3%), American (290 | 10.1%), German (199 | 6.9%), and Mexican (193 | 6.7%), together accounting for 54.7% of all Mountain View residents.
| Ancestry | # Population | % Population |
| American | 290 | 10.1% |
| Belgian | 13 | 0.4% |
| British | 71 | 2.5% |
| Central American | 24 | 0.8% |
| Cherokee | 7 | 0.2% |
| Czech | 5 | 0.2% |
| Danish | 149 | 5.2% |
| Dutch | 64 | 2.2% |
| English | 411 | 14.3% |
| French | 25 | 0.9% |
| German | 199 | 6.9% |
| Guatemalan | 24 | 0.8% |
| Irish | 475 | 16.6% |
| Mexican | 193 | 6.7% |
| Northern European | 47 | 1.6% |
| Scotch-Irish | 143 | 5.0% |
| Scottish | 95 | 3.3% |
| Spaniard | 11 | 0.4% |
| Swiss | 13 | 0.4% |
| Thai | 26 | 0.9% | View All 20 Rows |
Immigrants in Mountain View
The most numerous immigrant groups reported in Mountain View came from Asia (26 | 0.9%), India (26 | 0.9%), and South Central Asia (26 | 0.9%), together accounting for 2.7% of all Mountain View residents.
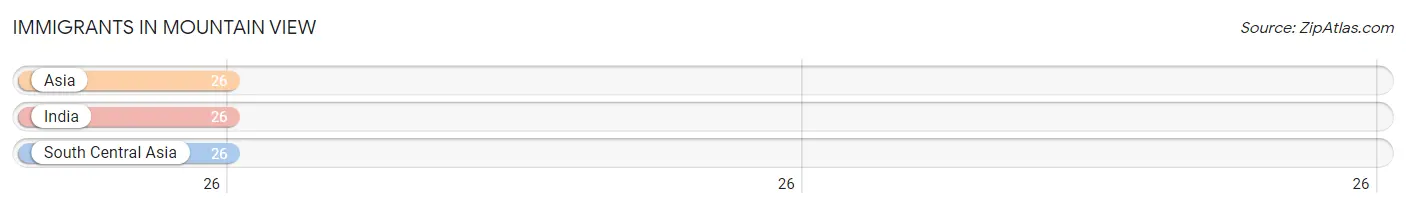
| Immigration Origin | # Population | % Population |
| Asia | 26 | 0.9% |
| India | 26 | 0.9% |
| South Central Asia | 26 | 0.9% | View All 3 Rows |
Sex and Age in Mountain View
Sex and Age in Mountain View
The most populous age groups in Mountain View are 55 to 59 Years (135 | 13.1%) for men and 55 to 59 Years (232 | 12.6%) for women.
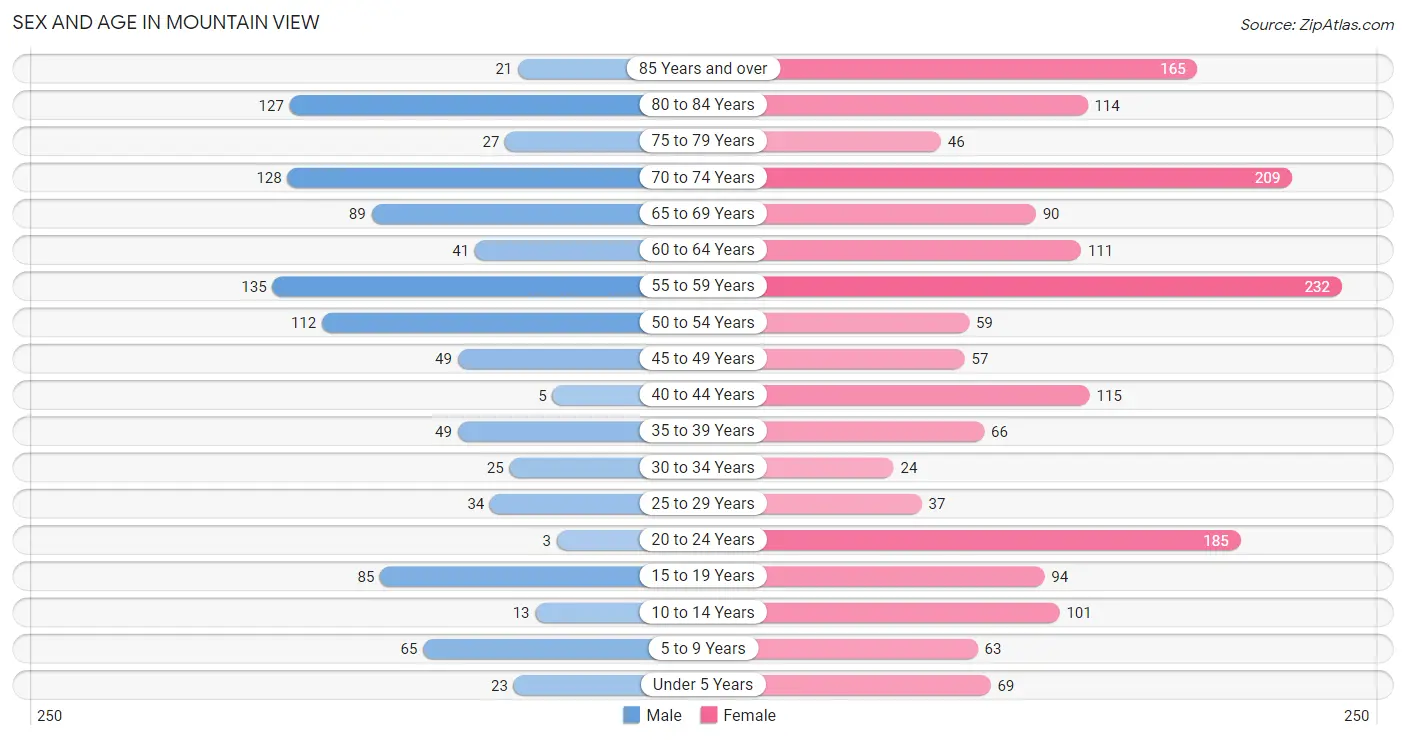
| Age Bracket | Male | Female |
| Under 5 Years | 23 (2.2%) | 69 (3.8%) |
| 5 to 9 Years | 65 (6.3%) | 63 (3.4%) |
| 10 to 14 Years | 13 (1.3%) | 101 (5.5%) |
| 15 to 19 Years | 85 (8.2%) | 94 (5.1%) |
| 20 to 24 Years | 3 (0.3%) | 185 (10.1%) |
| 25 to 29 Years | 34 (3.3%) | 37 (2.0%) |
| 30 to 34 Years | 25 (2.4%) | 24 (1.3%) |
| 35 to 39 Years | 49 (4.8%) | 66 (3.6%) |
| 40 to 44 Years | 5 (0.5%) | 115 (6.3%) |
| 45 to 49 Years | 49 (4.8%) | 57 (3.1%) |
| 50 to 54 Years | 112 (10.9%) | 59 (3.2%) |
| 55 to 59 Years | 135 (13.1%) | 232 (12.6%) |
| 60 to 64 Years | 41 (4.0%) | 111 (6.0%) |
| 65 to 69 Years | 89 (8.6%) | 90 (4.9%) |
| 70 to 74 Years | 128 (12.4%) | 209 (11.4%) |
| 75 to 79 Years | 27 (2.6%) | 46 (2.5%) |
| 80 to 84 Years | 127 (12.3%) | 114 (6.2%) |
| 85 Years and over | 21 (2.0%) | 165 (9.0%) |
| Total | 1,031 (100.0%) | 1,837 (100.0%) |
Families and Households in Mountain View
Median Family Size in Mountain View
The median family size in Mountain View is 3.66 persons per family, with married-couple families (310 | 64.0%) accounting for the largest median family size of 3.92 persons per family. On the other hand, single male/father families (48 | 9.9%) represent the smallest median family size with 2.52 persons per family.
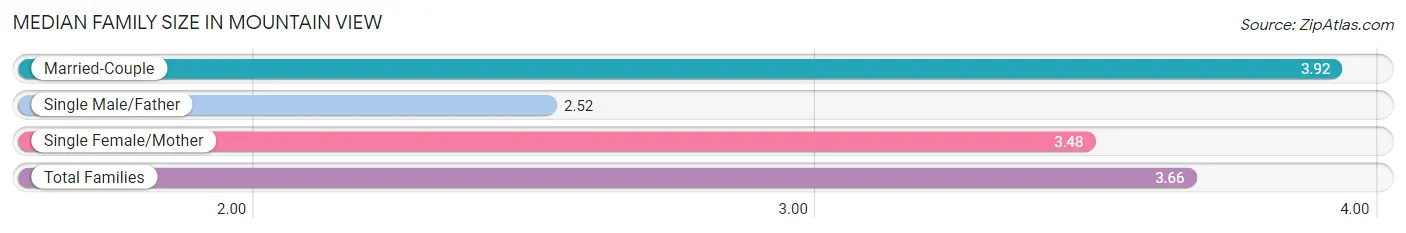
| Family Type | # Families | Family Size |
| Married-Couple | 310 (64.0%) | 3.92 |
| Single Male/Father | 48 (9.9%) | 2.52 |
| Single Female/Mother | 126 (26.0%) | 3.48 |
| Total Families | 484 (100.0%) | 3.66 |
Median Household Size in Mountain View
The median household size in Mountain View is 2.33 persons per household, with single female/mother households (126 | 10.7%) accounting for the largest median household size of 4.28 persons per household. non-family households (688 | 58.7%) represent the smallest median household size with 1.14 persons per household.
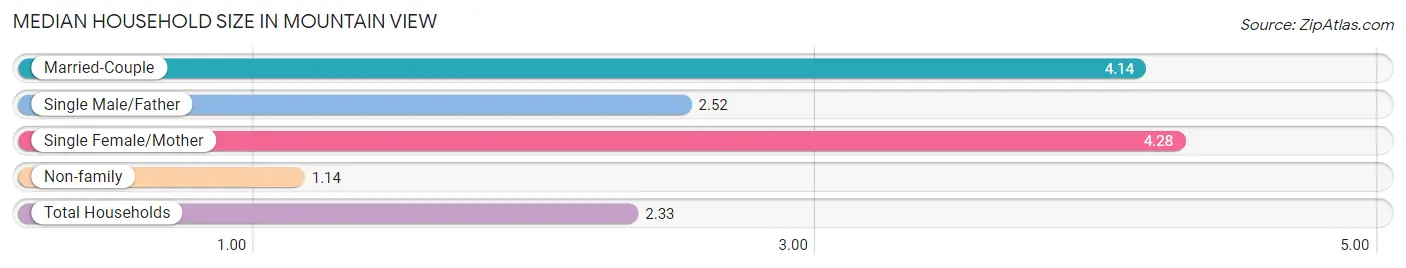
| Household Type | # Households | Household Size |
| Married-Couple | 310 (26.5%) | 4.14 |
| Single Male/Father | 48 (4.1%) | 2.52 |
| Single Female/Mother | 126 (10.7%) | 4.28 |
| Non-family | 688 (58.7%) | 1.14 |
| Total Households | 1,172 (100.0%) | 2.33 |
Household Size by Marriage Status in Mountain View
Out of a total of 1,172 households in Mountain View, 484 (41.3%) are family households, while 688 (58.7%) are nonfamily households. The most numerous type of family households are 2-person households, comprising 279, and the most common type of nonfamily households are 1-person households, comprising 642.
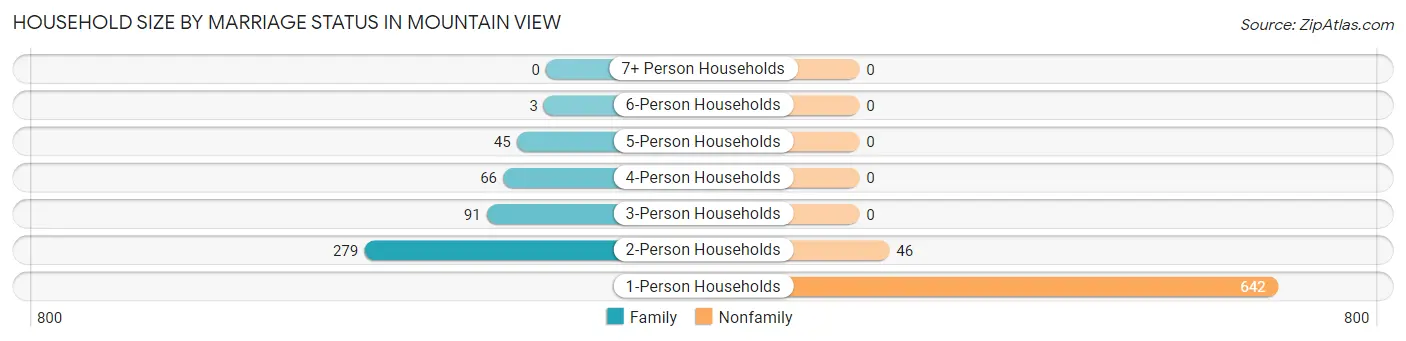
| Household Size | Family Households | Nonfamily Households |
| 1-Person Households | - | 642 (54.8%) |
| 2-Person Households | 279 (23.8%) | 46 (3.9%) |
| 3-Person Households | 91 (7.8%) | 0 (0.0%) |
| 4-Person Households | 66 (5.6%) | 0 (0.0%) |
| 5-Person Households | 45 (3.8%) | 0 (0.0%) |
| 6-Person Households | 3 (0.3%) | 0 (0.0%) |
| 7+ Person Households | 0 (0.0%) | 0 (0.0%) |
| Total | 484 (41.3%) | 688 (58.7%) |
Female Fertility in Mountain View
Fertility by Age in Mountain View
Average fertility rate in Mountain View is 60.0 births per 1,000 women. Women in the age bracket of 20 to 34 years have the highest fertility rate with 77.0 births per 1,000 women. Women in the age bracket of 20 to 34 years acount for 51.3% of all women with births.
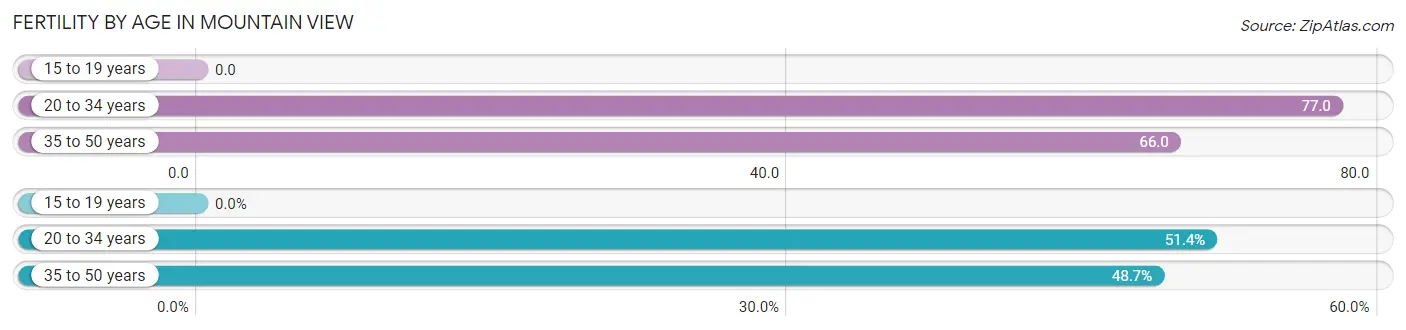
| Age Bracket | Women with Births | Births / 1,000 Women |
| 15 to 19 years | 0 (0.0%) | 0.0 |
| 20 to 34 years | 19 (51.3%) | 77.0 |
| 35 to 50 years | 18 (48.6%) | 66.0 |
| Total | 37 (100.0%) | 60.0 |
Fertility by Age by Marriage Status in Mountain View
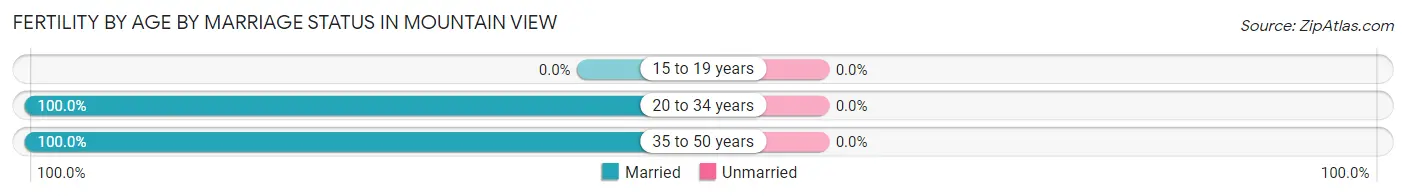
| Age Bracket | Married | Unmarried |
| 15 to 19 years | 0 (0.0%) | 0 (0.0%) |
| 20 to 34 years | 19 (100.0%) | 0 (0.0%) |
| 35 to 50 years | 18 (100.0%) | 0 (0.0%) |
| Total | 37 (100.0%) | 0 (0.0%) |
Fertility by Education in Mountain View
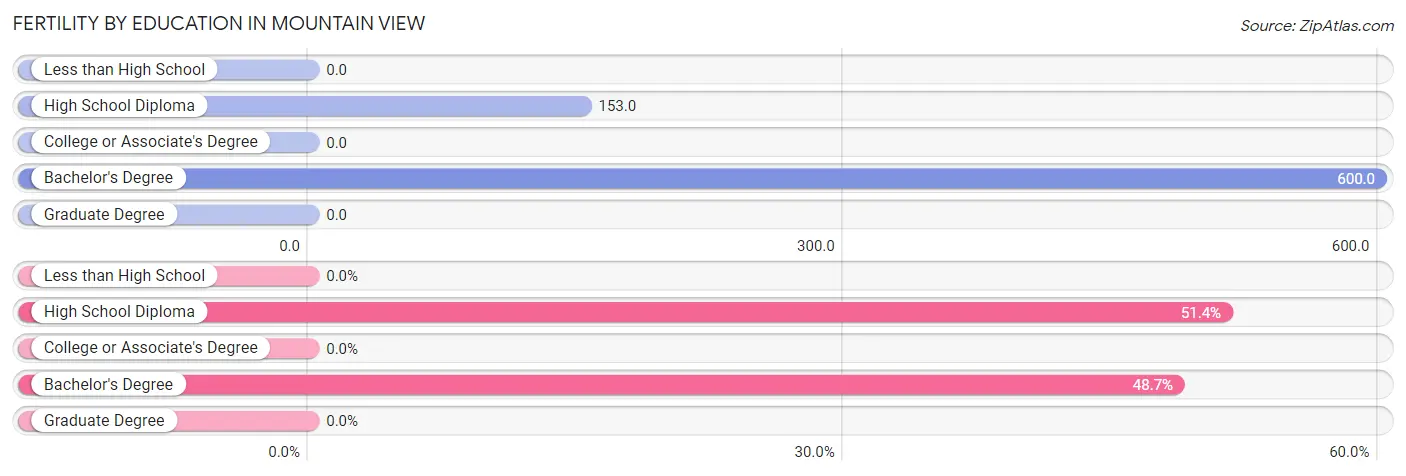
| Educational Attainment | Women with Births | Births / 1,000 Women |
| Less than High School | 0 (0.0%) | 0.0 |
| High School Diploma | 19 (51.3%) | 153.0 |
| College or Associate's Degree | 0 (0.0%) | 0.0 |
| Bachelor's Degree | 18 (48.6%) | 600.0 |
| Graduate Degree | 0 (0.0%) | 0.0 |
| Total | 37 (100.0%) | 60.0 |
Fertility by Education by Marriage Status in Mountain View
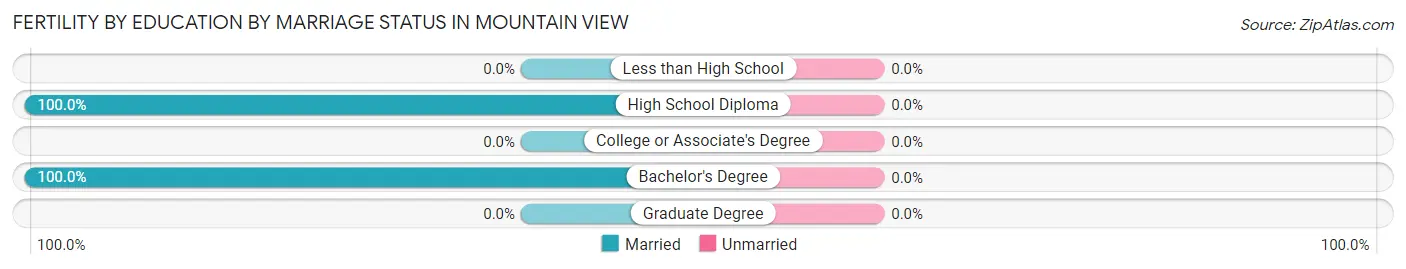
| Educational Attainment | Married | Unmarried |
| Less than High School | 0 (0.0%) | 0 (0.0%) |
| High School Diploma | 19 (100.0%) | 0 (0.0%) |
| College or Associate's Degree | 0 (0.0%) | 0 (0.0%) |
| Bachelor's Degree | 18 (100.0%) | 0 (0.0%) |
| Graduate Degree | 0 (0.0%) | 0 (0.0%) |
| Total | 37 (100.0%) | 0 (0.0%) |
Employment Characteristics in Mountain View
Employment by Class of Employer in Mountain View
Among the 772 employed individuals in Mountain View, private company employees (409 | 53.0%), local government employees (133 | 17.2%), and state government employees (133 | 17.2%) make up the most common classes of employment.
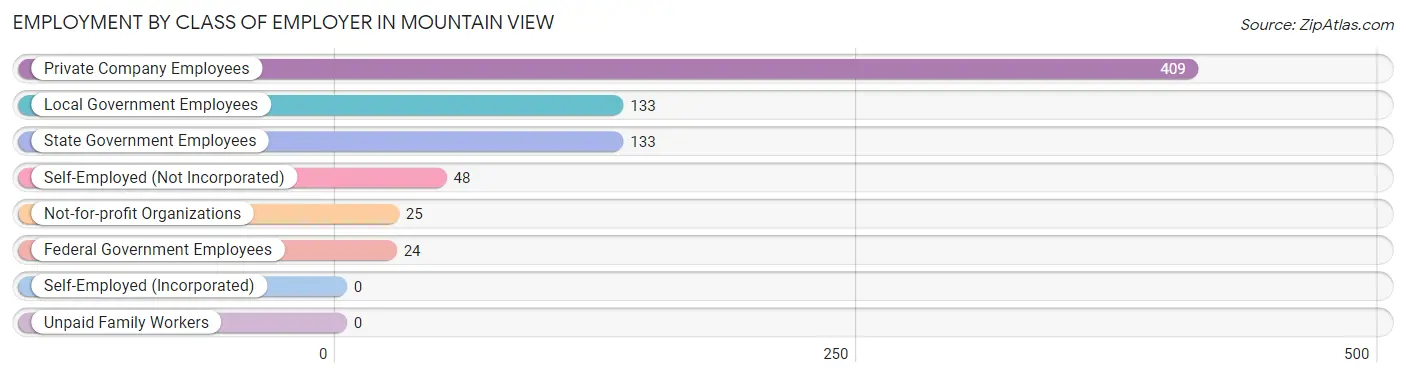
| Employer Class | # Employees | % Employees |
| Private Company Employees | 409 | 53.0% |
| Self-Employed (Incorporated) | 0 | 0.0% |
| Self-Employed (Not Incorporated) | 48 | 6.2% |
| Not-for-profit Organizations | 25 | 3.2% |
| Local Government Employees | 133 | 17.2% |
| State Government Employees | 133 | 17.2% |
| Federal Government Employees | 24 | 3.1% |
| Unpaid Family Workers | 0 | 0.0% |
| Total | 772 | 100.0% |
Employment Status by Age in Mountain View
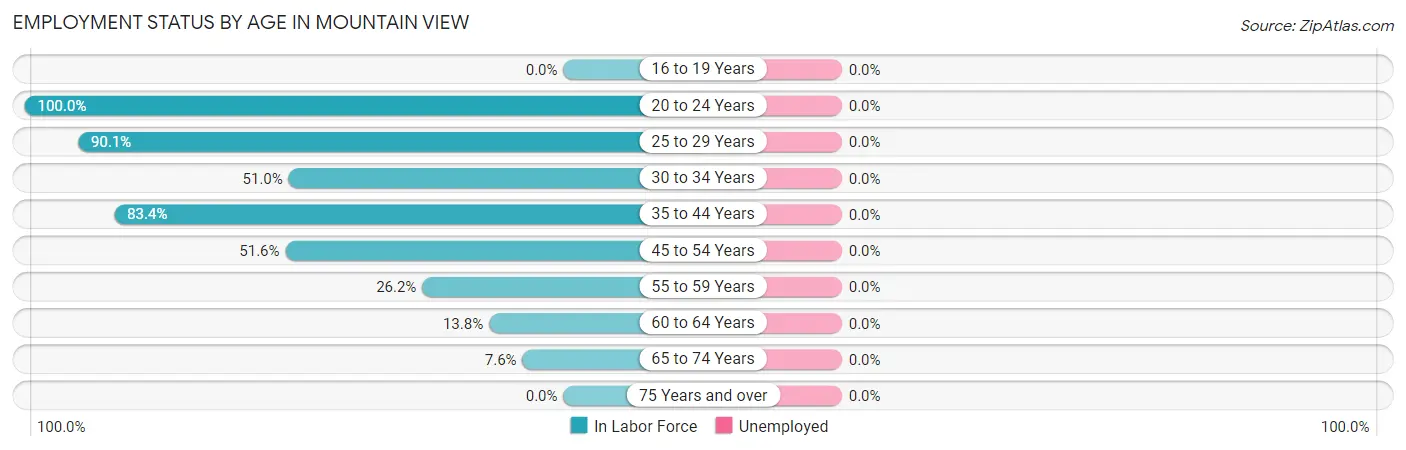
| Age Bracket | In Labor Force | Unemployed |
| 16 to 19 Years | 0 (0.0%) | 0 (0.0%) |
| 20 to 24 Years | 188 (100.0%) | 0 (0.0%) |
| 25 to 29 Years | 64 (90.1%) | 0 (0.0%) |
| 30 to 34 Years | 25 (51.0%) | 0 (0.0%) |
| 35 to 44 Years | 196 (83.4%) | 0 (0.0%) |
| 45 to 54 Years | 143 (51.6%) | 0 (0.0%) |
| 55 to 59 Years | 96 (26.2%) | 0 (0.0%) |
| 60 to 64 Years | 21 (13.8%) | 0 (0.0%) |
| 65 to 74 Years | 39 (7.6%) | 0 (0.0%) |
| 75 Years and over | 0 (0.0%) | 0 (0.0%) |
| Total | 771 (31.5%) | 0 (0.0%) |
Employment Status by Educational Attainment in Mountain View
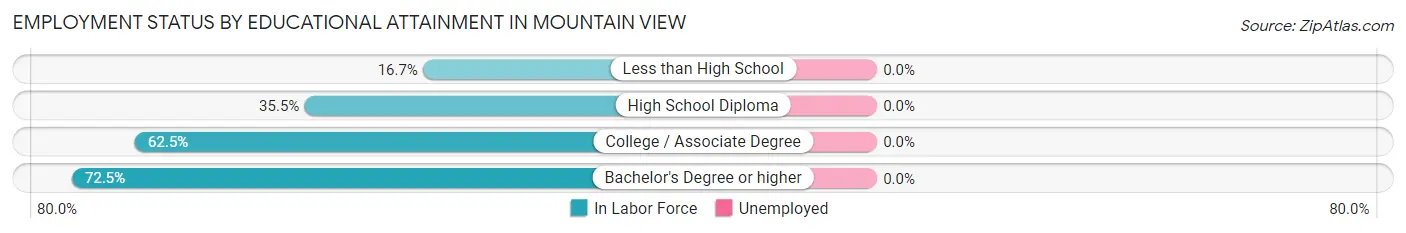
| Educational Attainment | In Labor Force | Unemployed |
| Less than High School | 31 (16.7%) | 0 (0.0%) |
| High School Diploma | 148 (35.5%) | 0 (0.0%) |
| College / Associate Degree | 195 (62.5%) | 0 (0.0%) |
| Bachelor's Degree or higher | 171 (72.5%) | 0 (0.0%) |
| Total | 546 (47.4%) | 0 (0.0%) |
Employment Occupations by Sex in Mountain View
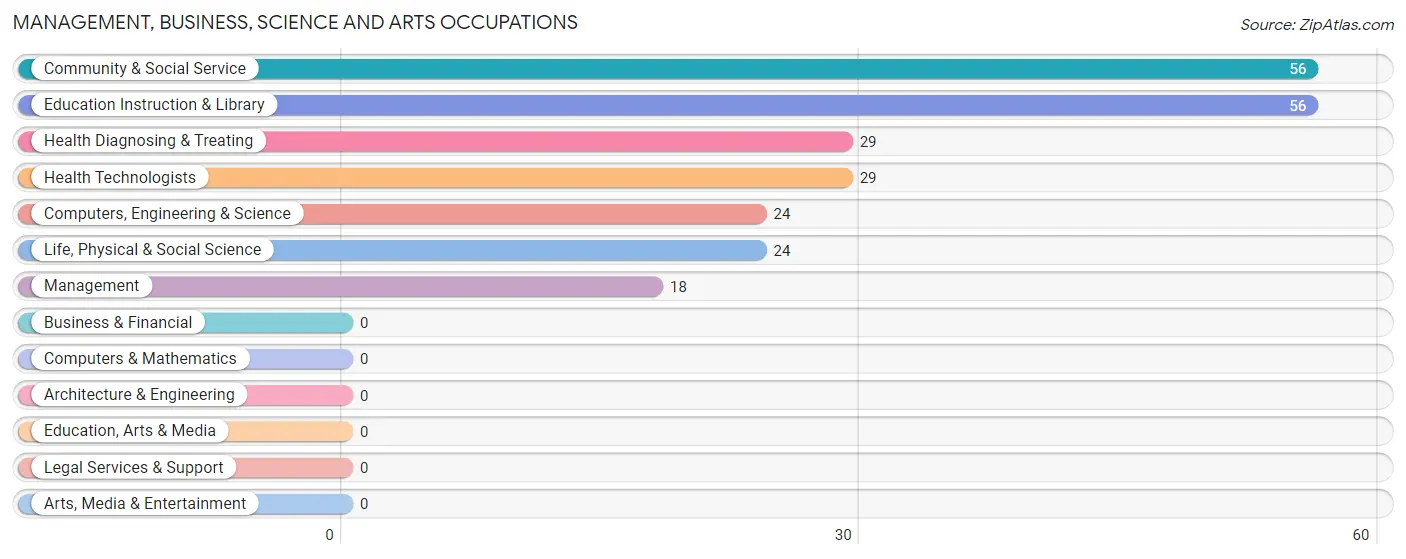
Management, Business, Science and Arts Occupations
The most common Management, Business, Science and Arts occupations in Mountain View are Community & Social Service (56 | 7.2%), Education Instruction & Library (56 | 7.2%), Health Diagnosing & Treating (29 | 3.8%), Health Technologists (29 | 3.8%), and Computers, Engineering & Science (24 | 3.1%).
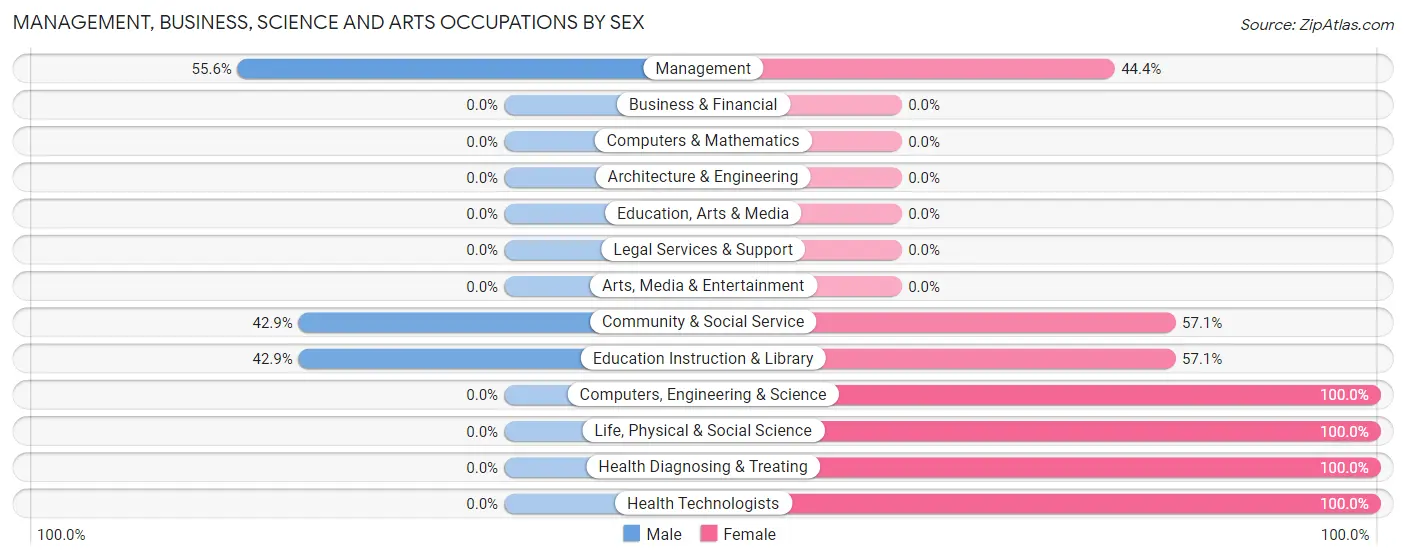
Management, Business, Science and Arts Occupations by Sex
Within the Management, Business, Science and Arts occupations in Mountain View, the most male-oriented occupations are Management (55.6%), Community & Social Service (42.9%), and Education Instruction & Library (42.9%), while the most female-oriented occupations are Computers, Engineering & Science (100.0%), Life, Physical & Social Science (100.0%), and Health Diagnosing & Treating (100.0%).
| Occupation | Male | Female |
| Management | 10 (55.6%) | 8 (44.4%) |
| Business & Financial | 0 (0.0%) | 0 (0.0%) |
| Computers, Engineering & Science | 0 (0.0%) | 24 (100.0%) |
| Computers & Mathematics | 0 (0.0%) | 0 (0.0%) |
| Architecture & Engineering | 0 (0.0%) | 0 (0.0%) |
| Life, Physical & Social Science | 0 (0.0%) | 24 (100.0%) |
| Community & Social Service | 24 (42.9%) | 32 (57.1%) |
| Education, Arts & Media | 0 (0.0%) | 0 (0.0%) |
| Legal Services & Support | 0 (0.0%) | 0 (0.0%) |
| Education Instruction & Library | 24 (42.9%) | 32 (57.1%) |
| Arts, Media & Entertainment | 0 (0.0%) | 0 (0.0%) |
| Health Diagnosing & Treating | 0 (0.0%) | 29 (100.0%) |
| Health Technologists | 0 (0.0%) | 29 (100.0%) |
| Total (Category) | 34 (26.8%) | 93 (73.2%) |
| Total (Overall) | 214 (27.7%) | 558 (72.3%) |
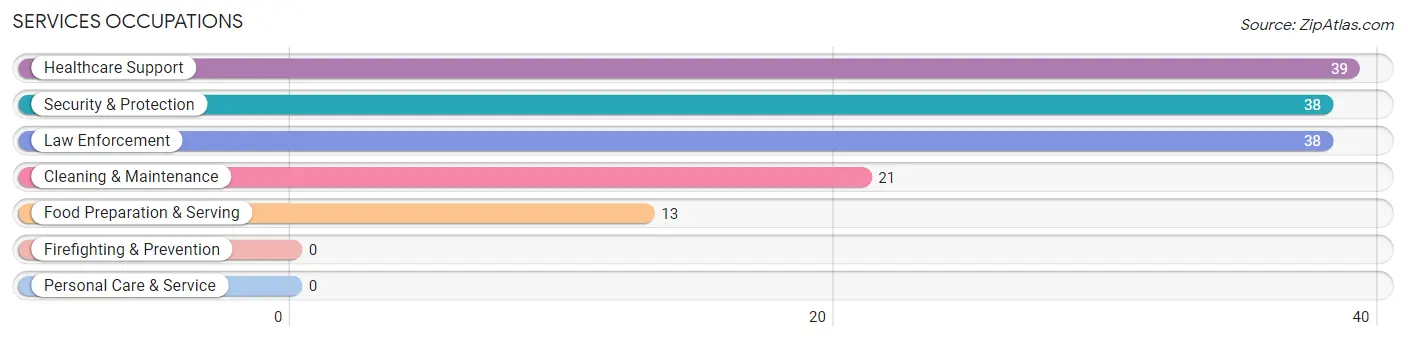
Services Occupations
The most common Services occupations in Mountain View are Healthcare Support (39 | 5.1%), Security & Protection (38 | 4.9%), Law Enforcement (38 | 4.9%), Cleaning & Maintenance (21 | 2.7%), and Food Preparation & Serving (13 | 1.7%).
Services Occupations by Sex
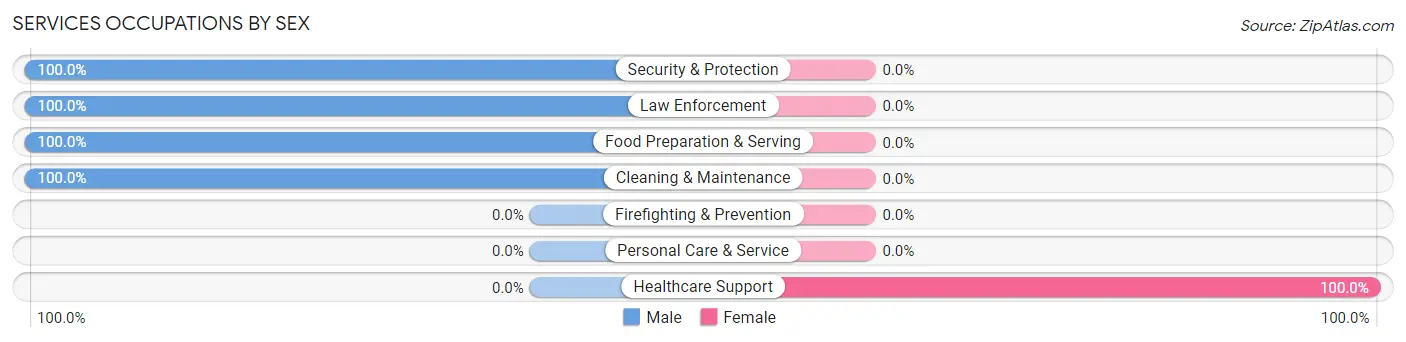
| Occupation | Male | Female |
| Healthcare Support | 0 (0.0%) | 39 (100.0%) |
| Security & Protection | 38 (100.0%) | 0 (0.0%) |
| Firefighting & Prevention | 0 (0.0%) | 0 (0.0%) |
| Law Enforcement | 38 (100.0%) | 0 (0.0%) |
| Food Preparation & Serving | 13 (100.0%) | 0 (0.0%) |
| Cleaning & Maintenance | 21 (100.0%) | 0 (0.0%) |
| Personal Care & Service | 0 (0.0%) | 0 (0.0%) |
| Total (Category) | 72 (64.9%) | 39 (35.1%) |
| Total (Overall) | 214 (27.7%) | 558 (72.3%) |
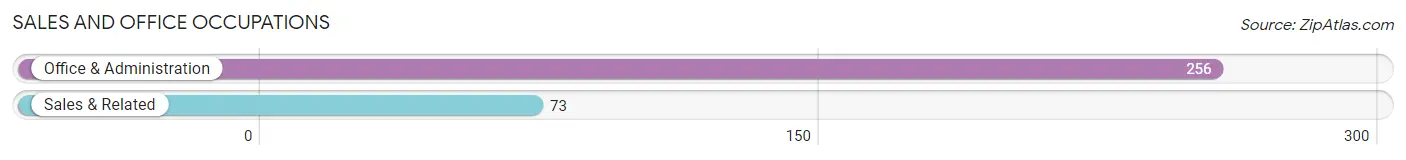
Sales and Office Occupations
The most common Sales and Office occupations in Mountain View are Office & Administration (256 | 33.2%), and Sales & Related (73 | 9.5%).
Sales and Office Occupations by Sex
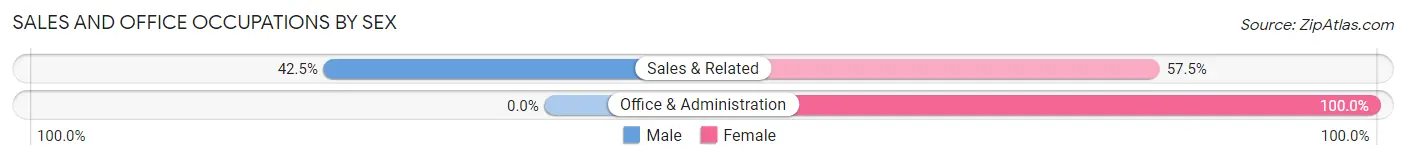
| Occupation | Male | Female |
| Sales & Related | 31 (42.5%) | 42 (57.5%) |
| Office & Administration | 0 (0.0%) | 256 (100.0%) |
| Total (Category) | 31 (9.4%) | 298 (90.6%) |
| Total (Overall) | 214 (27.7%) | 558 (72.3%) |
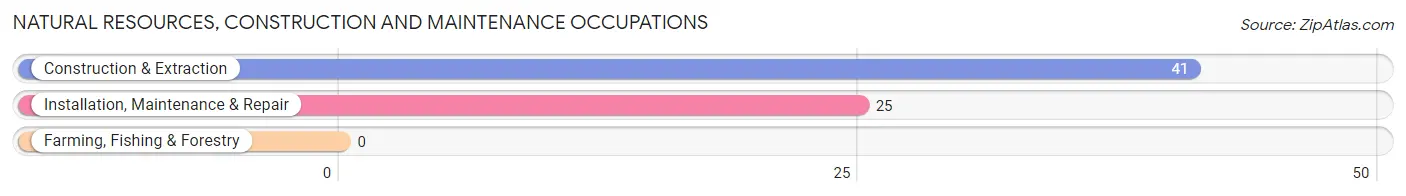
Natural Resources, Construction and Maintenance Occupations
The most common Natural Resources, Construction and Maintenance occupations in Mountain View are Construction & Extraction (41 | 5.3%), and Installation, Maintenance & Repair (25 | 3.2%).
Natural Resources, Construction and Maintenance Occupations by Sex
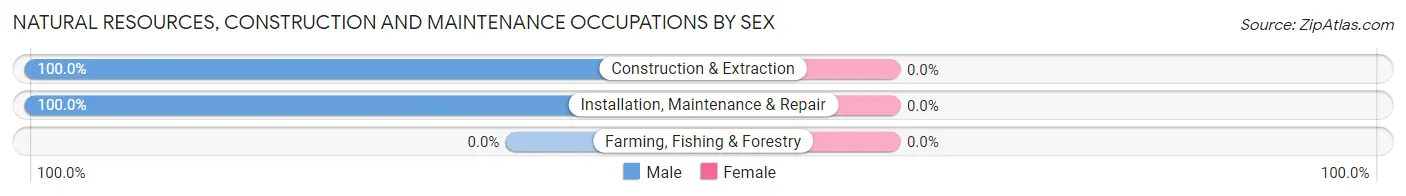
| Occupation | Male | Female |
| Farming, Fishing & Forestry | 0 (0.0%) | 0 (0.0%) |
| Construction & Extraction | 41 (100.0%) | 0 (0.0%) |
| Installation, Maintenance & Repair | 25 (100.0%) | 0 (0.0%) |
| Total (Category) | 66 (100.0%) | 0 (0.0%) |
| Total (Overall) | 214 (27.7%) | 558 (72.3%) |
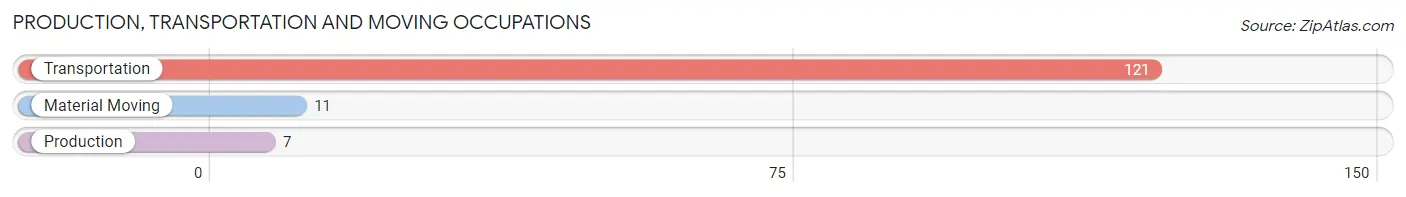
Production, Transportation and Moving Occupations
The most common Production, Transportation and Moving occupations in Mountain View are Transportation (121 | 15.7%), Material Moving (11 | 1.4%), and Production (7 | 0.9%).
Production, Transportation and Moving Occupations by Sex
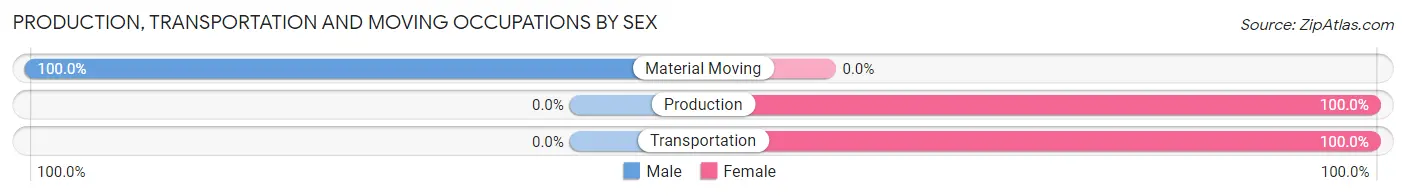
| Occupation | Male | Female |
| Production | 0 (0.0%) | 7 (100.0%) |
| Transportation | 0 (0.0%) | 121 (100.0%) |
| Material Moving | 11 (100.0%) | 0 (0.0%) |
| Total (Category) | 11 (7.9%) | 128 (92.1%) |
| Total (Overall) | 214 (27.7%) | 558 (72.3%) |
Employment Industries by Sex in Mountain View
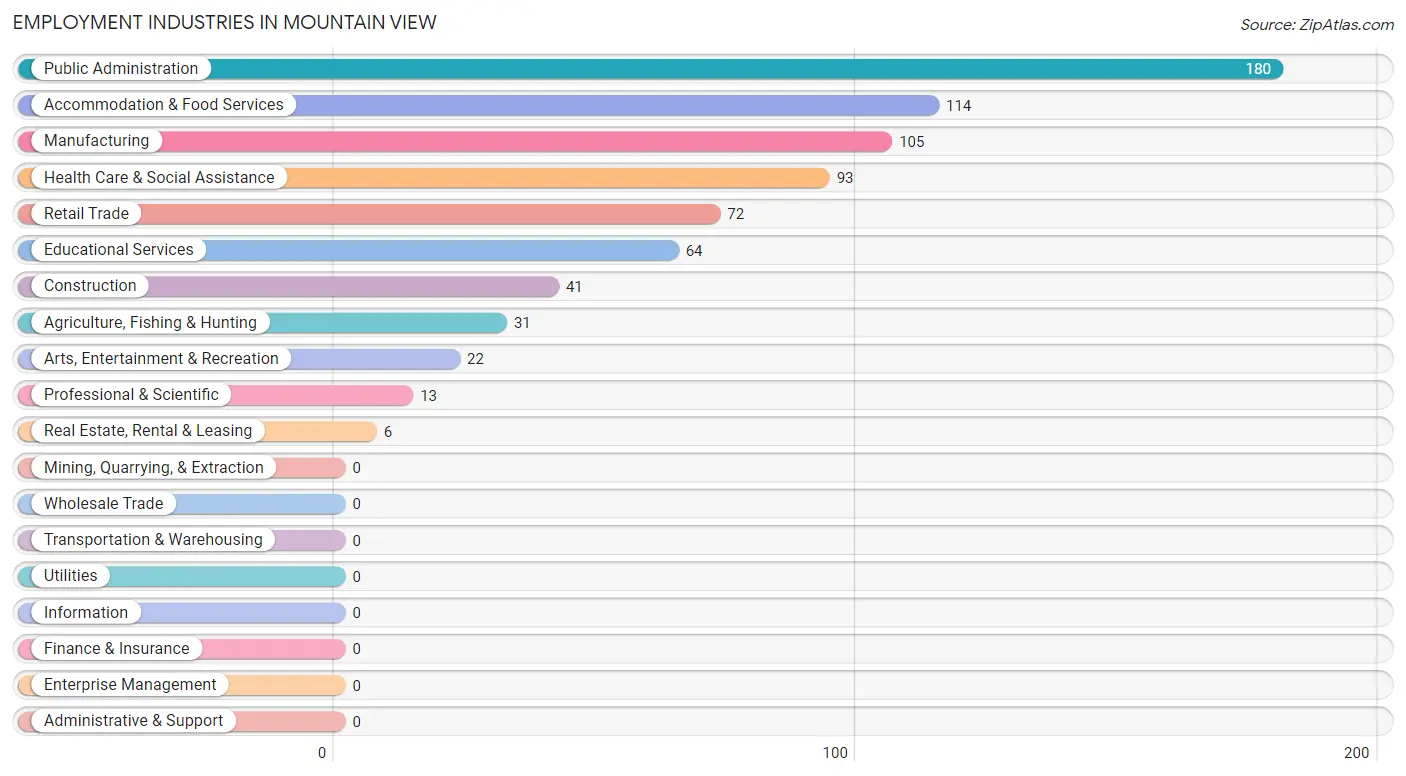
Employment Industries in Mountain View
The major employment industries in Mountain View include Public Administration (180 | 23.3%), Accommodation & Food Services (114 | 14.8%), Manufacturing (105 | 13.6%), Health Care & Social Assistance (93 | 12.0%), and Retail Trade (72 | 9.3%).
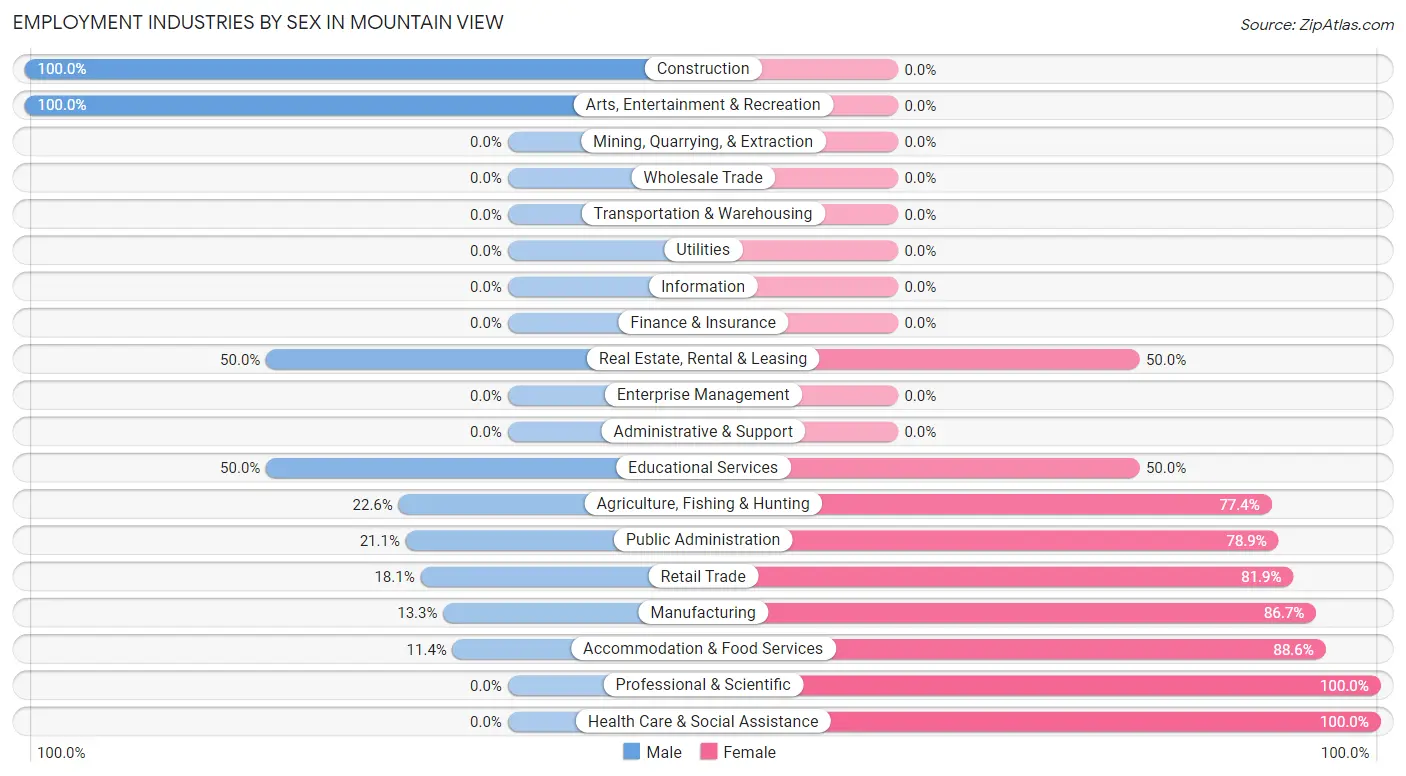
Employment Industries by Sex in Mountain View
The Mountain View industries that see more men than women are Construction (100.0%), Arts, Entertainment & Recreation (100.0%), and Real Estate, Rental & Leasing (50.0%), whereas the industries that tend to have a higher number of women are Professional & Scientific (100.0%), Health Care & Social Assistance (100.0%), and Accommodation & Food Services (88.6%).
| Industry | Male | Female |
| Agriculture, Fishing & Hunting | 7 (22.6%) | 24 (77.4%) |
| Mining, Quarrying, & Extraction | 0 (0.0%) | 0 (0.0%) |
| Construction | 41 (100.0%) | 0 (0.0%) |
| Manufacturing | 14 (13.3%) | 91 (86.7%) |
| Wholesale Trade | 0 (0.0%) | 0 (0.0%) |
| Retail Trade | 13 (18.1%) | 59 (81.9%) |
| Transportation & Warehousing | 0 (0.0%) | 0 (0.0%) |
| Utilities | 0 (0.0%) | 0 (0.0%) |
| Information | 0 (0.0%) | 0 (0.0%) |
| Finance & Insurance | 0 (0.0%) | 0 (0.0%) |
| Real Estate, Rental & Leasing | 3 (50.0%) | 3 (50.0%) |
| Professional & Scientific | 0 (0.0%) | 13 (100.0%) |
| Enterprise Management | 0 (0.0%) | 0 (0.0%) |
| Administrative & Support | 0 (0.0%) | 0 (0.0%) |
| Educational Services | 32 (50.0%) | 32 (50.0%) |
| Health Care & Social Assistance | 0 (0.0%) | 93 (100.0%) |
| Arts, Entertainment & Recreation | 22 (100.0%) | 0 (0.0%) |
| Accommodation & Food Services | 13 (11.4%) | 101 (88.6%) |
| Public Administration | 38 (21.1%) | 142 (78.9%) |
| Total | 214 (27.7%) | 558 (72.3%) |
Education in Mountain View
School Enrollment in Mountain View
The most common levels of schooling among the 543 students in Mountain View are middle school (158 | 29.1%), high school (141 | 26.0%), and elementary school (95 | 17.5%).
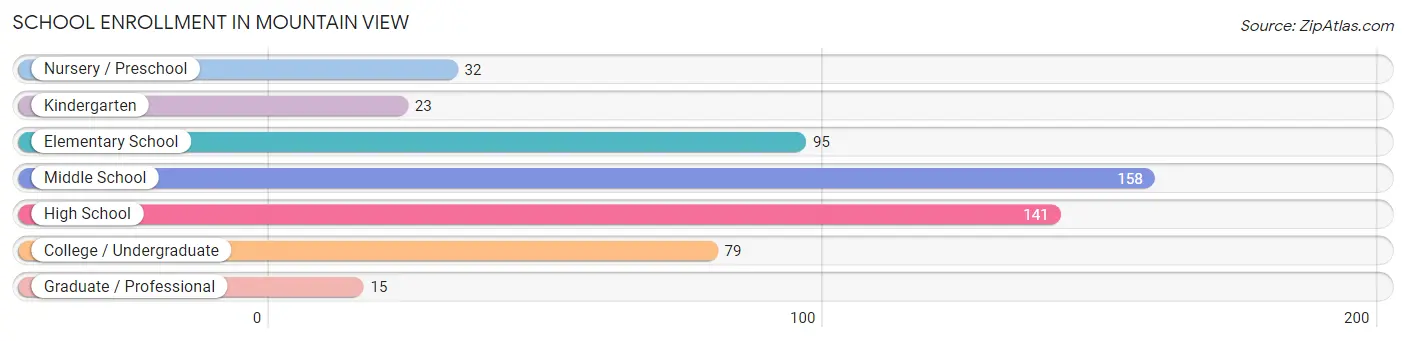
| School Level | # Students | % Students |
| Nursery / Preschool | 32 | 5.9% |
| Kindergarten | 23 | 4.2% |
| Elementary School | 95 | 17.5% |
| Middle School | 158 | 29.1% |
| High School | 141 | 26.0% |
| College / Undergraduate | 79 | 14.5% |
| Graduate / Professional | 15 | 2.8% |
| Total | 543 | 100.0% |
School Enrollment by Age by Funding Source in Mountain View
Out of a total of 543 students who are enrolled in schools in Mountain View, 24 (4.4%) attend a private institution, while the remaining 519 (95.6%) are enrolled in public schools. The age group of 20 to 24 year olds has the highest likelihood of being enrolled in private schools, with 4 (100.0% in the age bracket) enrolled. Conversely, the age group of 3 to 4 year olds has the lowest likelihood of being enrolled in a private school, with 22 (100.0% in the age bracket) attending a public institution.
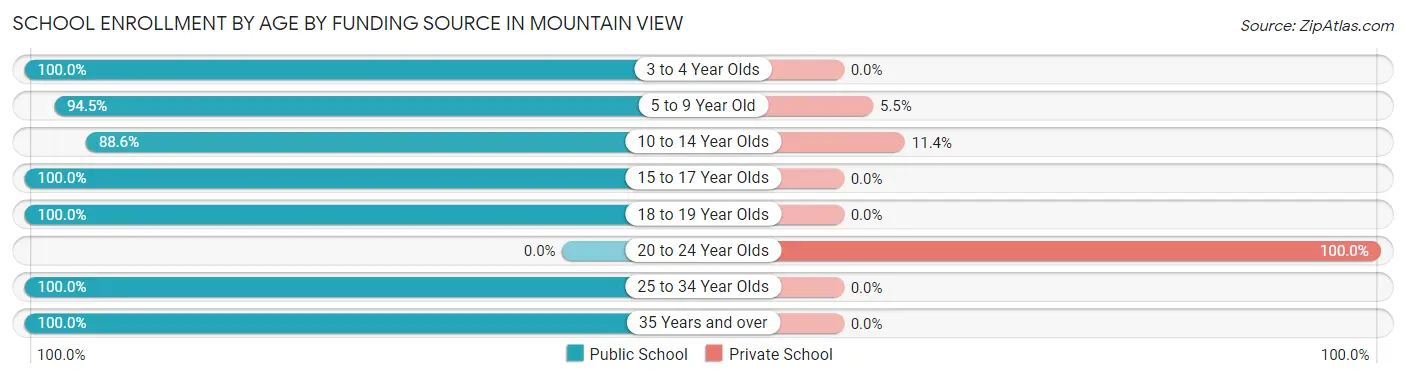
| Age Bracket | Public School | Private School |
| 3 to 4 Year Olds | 22 (100.0%) | 0 (0.0%) |
| 5 to 9 Year Old | 121 (94.5%) | 7 (5.5%) |
| 10 to 14 Year Olds | 101 (88.6%) | 13 (11.4%) |
| 15 to 17 Year Olds | 85 (100.0%) | 0 (0.0%) |
| 18 to 19 Year Olds | 94 (100.0%) | 0 (0.0%) |
| 20 to 24 Year Olds | 0 (0.0%) | 4 (100.0%) |
| 25 to 34 Year Olds | 9 (100.0%) | 0 (0.0%) |
| 35 Years and over | 87 (100.0%) | 0 (0.0%) |
| Total | 519 (95.6%) | 24 (4.4%) |
Educational Attainment by Field of Study in Mountain View
Liberal arts & history (72 | 20.1%), business (66 | 18.4%), education (63 | 17.5%), bio, nature & agricultural (39 | 10.9%), and science & technology (36 | 10.0%) are the most common fields of study among 359 individuals in Mountain View who have obtained a bachelor's degree or higher.
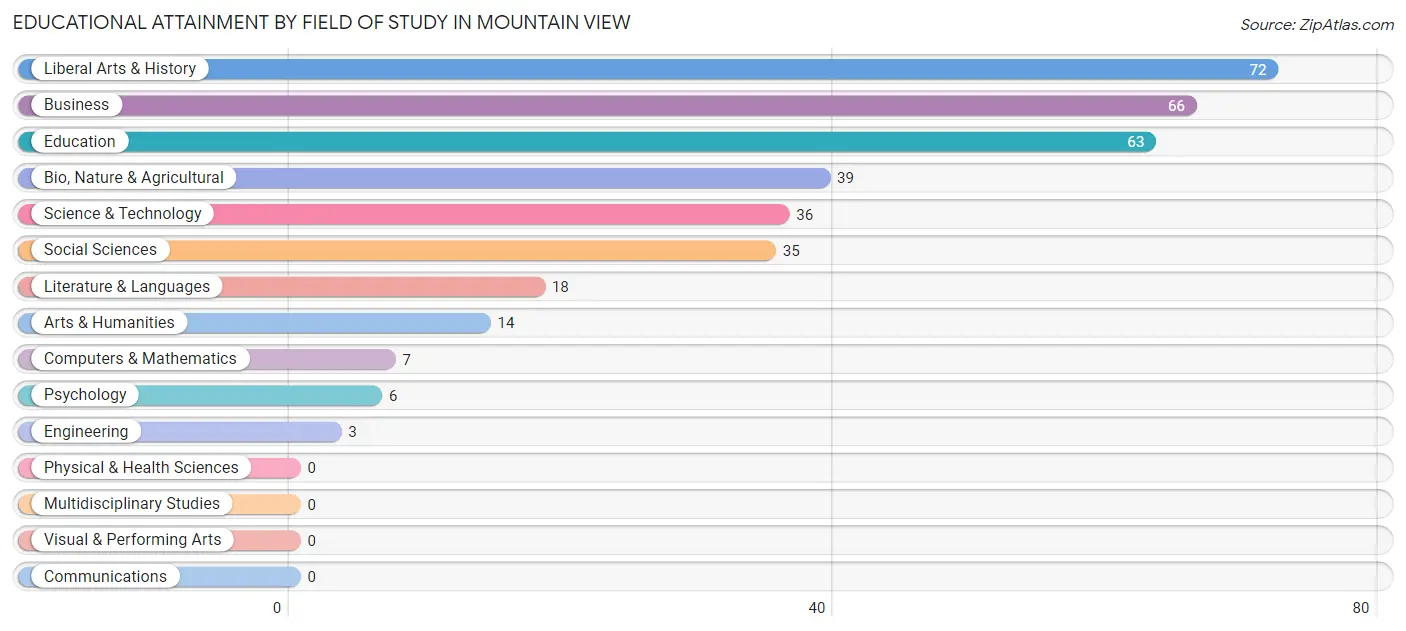
| Field of Study | # Graduates | % Graduates |
| Computers & Mathematics | 7 | 1.9% |
| Bio, Nature & Agricultural | 39 | 10.9% |
| Physical & Health Sciences | 0 | 0.0% |
| Psychology | 6 | 1.7% |
| Social Sciences | 35 | 9.8% |
| Engineering | 3 | 0.8% |
| Multidisciplinary Studies | 0 | 0.0% |
| Science & Technology | 36 | 10.0% |
| Business | 66 | 18.4% |
| Education | 63 | 17.5% |
| Literature & Languages | 18 | 5.0% |
| Liberal Arts & History | 72 | 20.1% |
| Visual & Performing Arts | 0 | 0.0% |
| Communications | 0 | 0.0% |
| Arts & Humanities | 14 | 3.9% |
| Total | 359 | 100.0% |
Transportation & Commute in Mountain View
Vehicle Availability by Sex in Mountain View
The most prevalent vehicle ownership categories in Mountain View are males with 2 vehicles (111, accounting for 51.9%) and females with 2 vehicles (184, making up 20.3%).
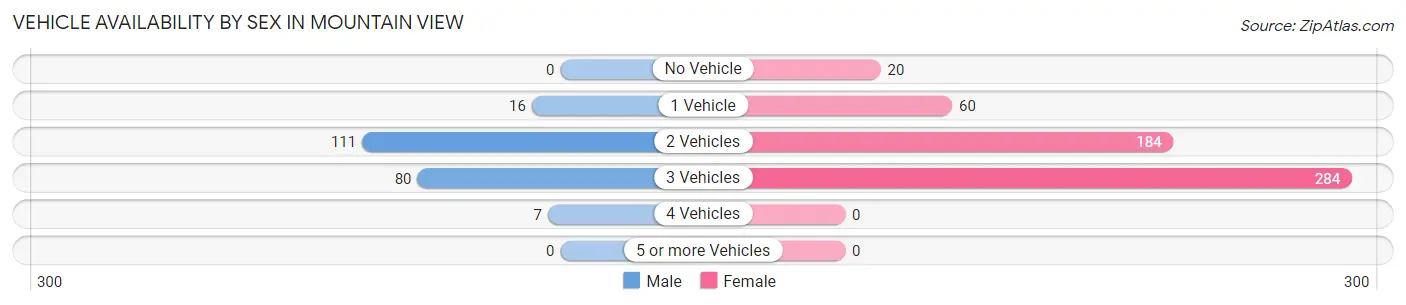
| Vehicles Available | Male | Female |
| No Vehicle | 0 (0.0%) | 20 (3.6%) |
| 1 Vehicle | 16 (7.5%) | 60 (11.0%) |
| 2 Vehicles | 111 (51.9%) | 184 (33.6%) |
| 3 Vehicles | 80 (37.4%) | 284 (51.8%) |
| 4 Vehicles | 7 (3.3%) | 0 (0.0%) |
| 5 or more Vehicles | 0 (0.0%) | 0 (0.0%) |
| Total | 214 (100.0%) | 548 (100.0%) |
Commute Time in Mountain View
The most frequently occuring commute durations in Mountain View are 5 to 9 minutes (301 commuters, 41.2%), less than 5 minutes (113 commuters, 15.5%), and 45 to 59 minutes (83 commuters, 11.4%).
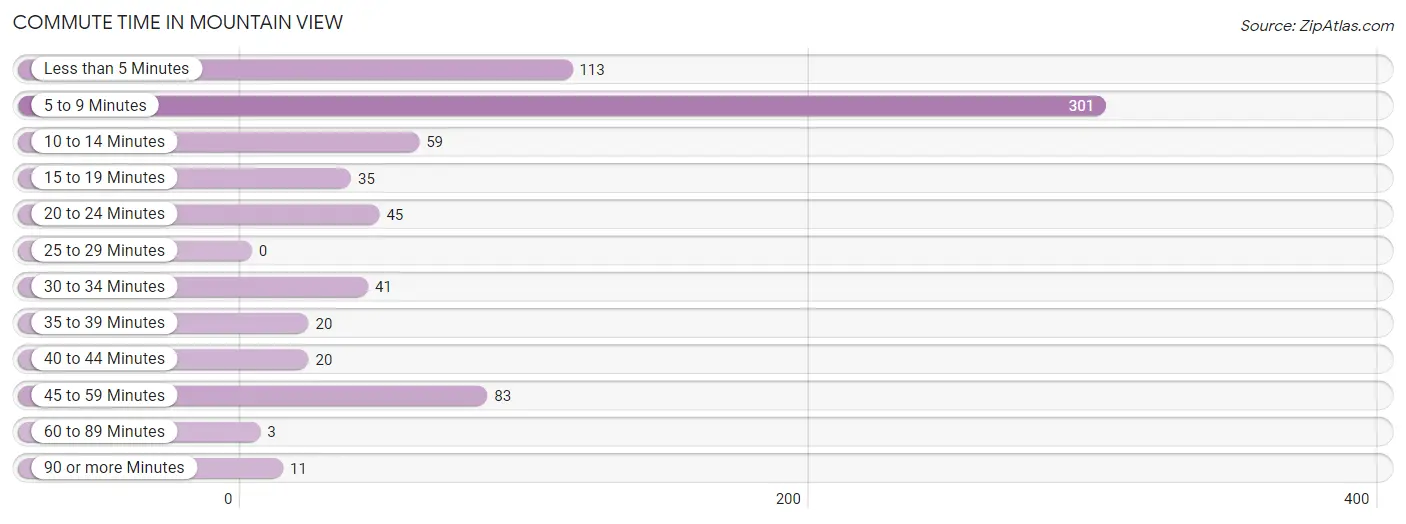
| Commute Time | # Commuters | % Commuters |
| Less than 5 Minutes | 113 | 15.5% |
| 5 to 9 Minutes | 301 | 41.2% |
| 10 to 14 Minutes | 59 | 8.1% |
| 15 to 19 Minutes | 35 | 4.8% |
| 20 to 24 Minutes | 45 | 6.2% |
| 25 to 29 Minutes | 0 | 0.0% |
| 30 to 34 Minutes | 41 | 5.6% |
| 35 to 39 Minutes | 20 | 2.7% |
| 40 to 44 Minutes | 20 | 2.7% |
| 45 to 59 Minutes | 83 | 11.4% |
| 60 to 89 Minutes | 3 | 0.4% |
| 90 or more Minutes | 11 | 1.5% |
Commute Time by Sex in Mountain View
The most common commute times in Mountain View are 5 to 9 minutes (86 commuters, 40.2%) for males and 5 to 9 minutes (215 commuters, 41.6%) for females.
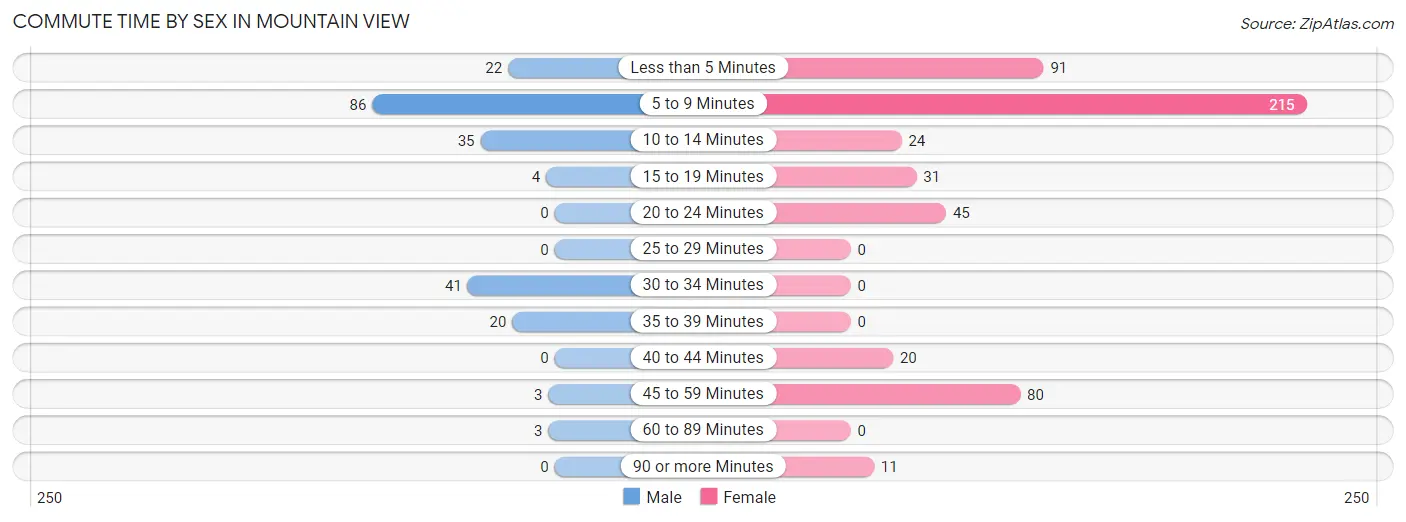
| Commute Time | Male | Female |
| Less than 5 Minutes | 22 (10.3%) | 91 (17.6%) |
| 5 to 9 Minutes | 86 (40.2%) | 215 (41.6%) |
| 10 to 14 Minutes | 35 (16.4%) | 24 (4.6%) |
| 15 to 19 Minutes | 4 (1.9%) | 31 (6.0%) |
| 20 to 24 Minutes | 0 (0.0%) | 45 (8.7%) |
| 25 to 29 Minutes | 0 (0.0%) | 0 (0.0%) |
| 30 to 34 Minutes | 41 (19.2%) | 0 (0.0%) |
| 35 to 39 Minutes | 20 (9.3%) | 0 (0.0%) |
| 40 to 44 Minutes | 0 (0.0%) | 20 (3.9%) |
| 45 to 59 Minutes | 3 (1.4%) | 80 (15.5%) |
| 60 to 89 Minutes | 3 (1.4%) | 0 (0.0%) |
| 90 or more Minutes | 0 (0.0%) | 11 (2.1%) |
Time of Departure to Work by Sex in Mountain View
The most frequent times of departure to work in Mountain View are 7:00 AM to 7:29 AM (76, 35.5%) for males and 4:00 PM to 11:59 PM (169, 32.7%) for females.
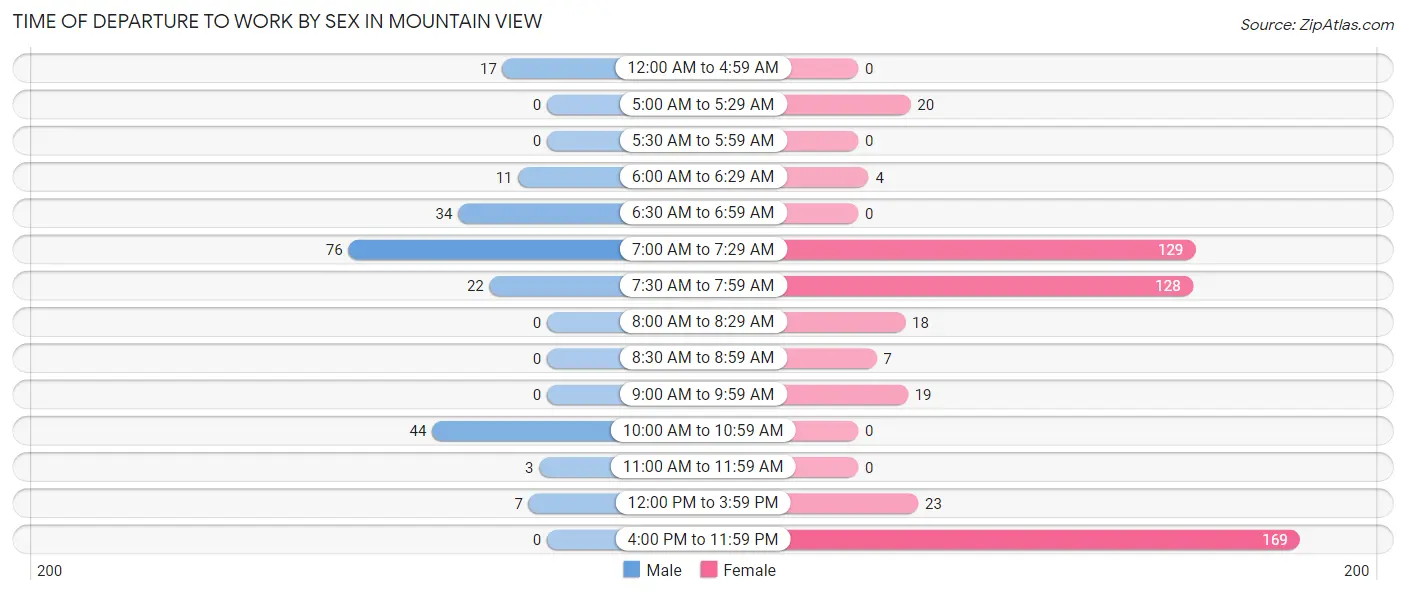
| Time of Departure | Male | Female |
| 12:00 AM to 4:59 AM | 17 (7.9%) | 0 (0.0%) |
| 5:00 AM to 5:29 AM | 0 (0.0%) | 20 (3.9%) |
| 5:30 AM to 5:59 AM | 0 (0.0%) | 0 (0.0%) |
| 6:00 AM to 6:29 AM | 11 (5.1%) | 4 (0.8%) |
| 6:30 AM to 6:59 AM | 34 (15.9%) | 0 (0.0%) |
| 7:00 AM to 7:29 AM | 76 (35.5%) | 129 (24.9%) |
| 7:30 AM to 7:59 AM | 22 (10.3%) | 128 (24.8%) |
| 8:00 AM to 8:29 AM | 0 (0.0%) | 18 (3.5%) |
| 8:30 AM to 8:59 AM | 0 (0.0%) | 7 (1.3%) |
| 9:00 AM to 9:59 AM | 0 (0.0%) | 19 (3.7%) |
| 10:00 AM to 10:59 AM | 44 (20.6%) | 0 (0.0%) |
| 11:00 AM to 11:59 AM | 3 (1.4%) | 0 (0.0%) |
| 12:00 PM to 3:59 PM | 7 (3.3%) | 23 (4.4%) |
| 4:00 PM to 11:59 PM | 0 (0.0%) | 169 (32.7%) |
| Total | 214 (100.0%) | 517 (100.0%) |
Housing Occupancy in Mountain View
Occupancy by Ownership in Mountain View
Of the total 1,172 dwellings in Mountain View, owner-occupied units account for 629 (53.7%), while renter-occupied units make up 543 (46.3%).
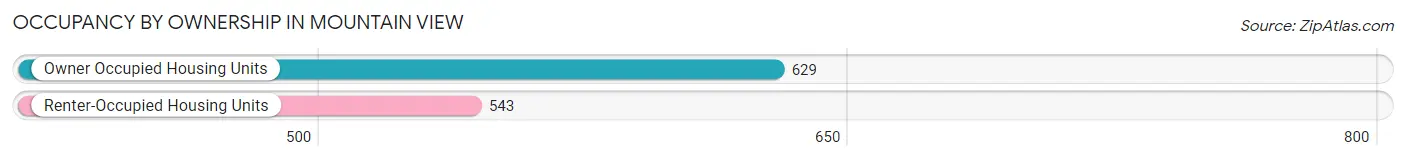
| Occupancy | # Housing Units | % Housing Units |
| Owner Occupied Housing Units | 629 | 53.7% |
| Renter-Occupied Housing Units | 543 | 46.3% |
| Total Occupied Housing Units | 1,172 | 100.0% |
Occupancy by Household Size in Mountain View
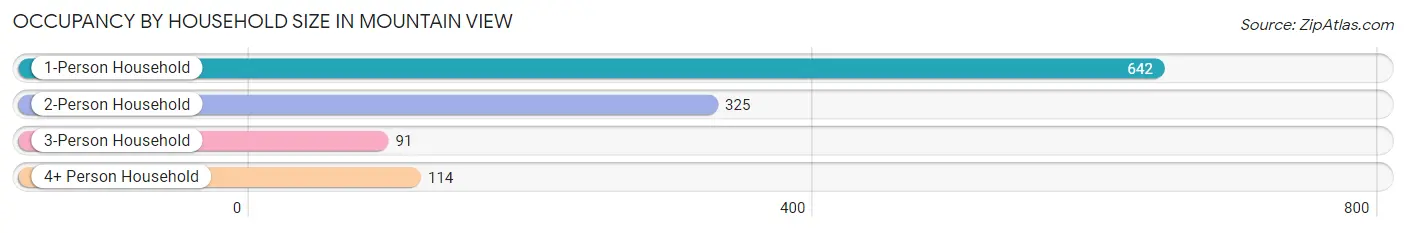
| Household Size | # Housing Units | % Housing Units |
| 1-Person Household | 642 | 54.8% |
| 2-Person Household | 325 | 27.7% |
| 3-Person Household | 91 | 7.8% |
| 4+ Person Household | 114 | 9.7% |
| Total Housing Units | 1,172 | 100.0% |
Occupancy by Ownership by Household Size in Mountain View
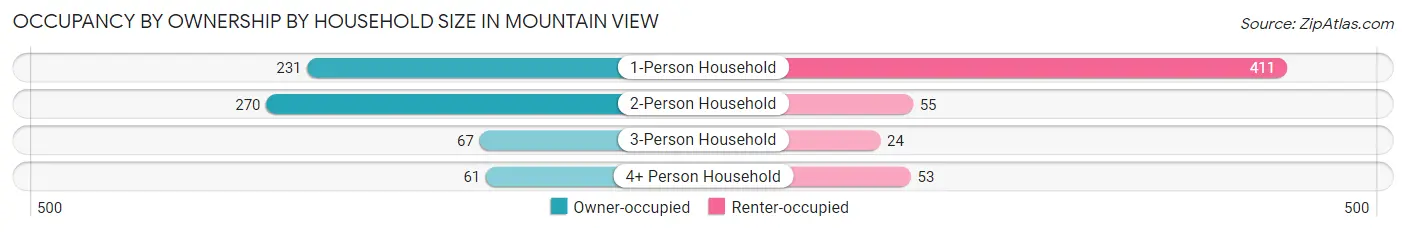
| Household Size | Owner-occupied | Renter-occupied |
| 1-Person Household | 231 (36.0%) | 411 (64.0%) |
| 2-Person Household | 270 (83.1%) | 55 (16.9%) |
| 3-Person Household | 67 (73.6%) | 24 (26.4%) |
| 4+ Person Household | 61 (53.5%) | 53 (46.5%) |
| Total Housing Units | 629 (53.7%) | 543 (46.3%) |
Occupancy by Educational Attainment in Mountain View
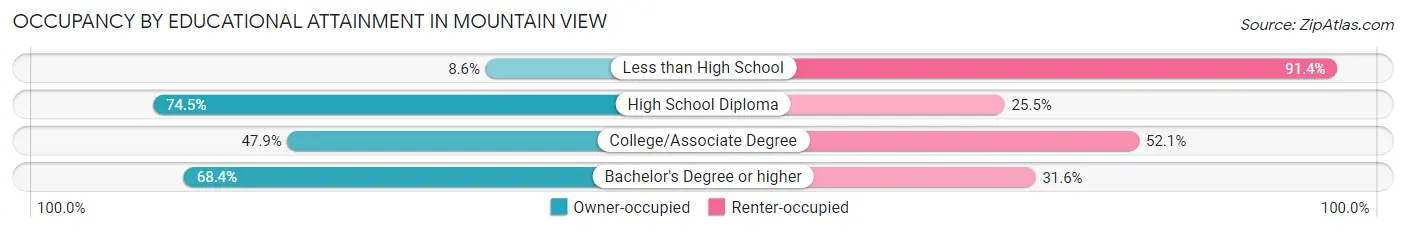
| Household Size | Owner-occupied | Renter-occupied |
| Less than High School | 16 (8.6%) | 171 (91.4%) |
| High School Diploma | 319 (74.5%) | 109 (25.5%) |
| College/Associate Degree | 203 (47.9%) | 221 (52.1%) |
| Bachelor's Degree or higher | 91 (68.4%) | 42 (31.6%) |
Occupancy by Age of Householder in Mountain View
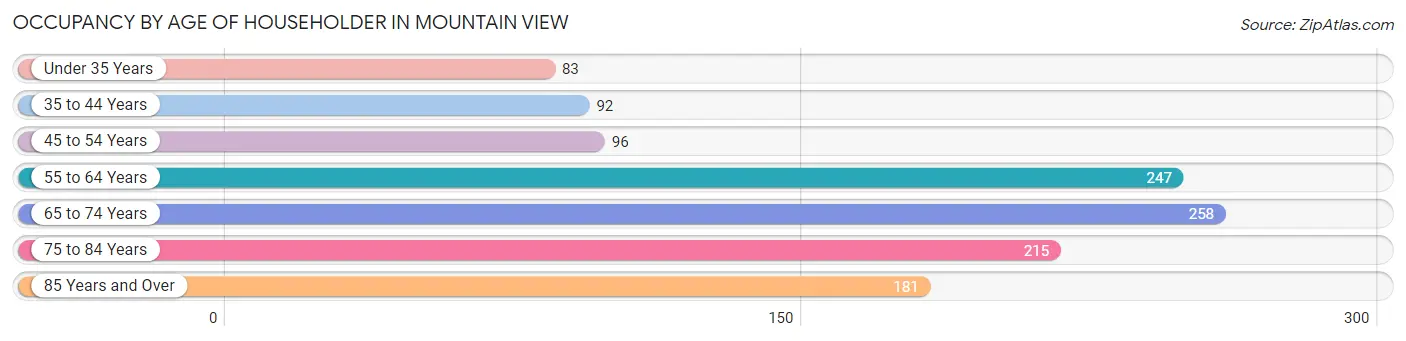
| Age Bracket | # Households | % Households |
| Under 35 Years | 83 | 7.1% |
| 35 to 44 Years | 92 | 7.9% |
| 45 to 54 Years | 96 | 8.2% |
| 55 to 64 Years | 247 | 21.1% |
| 65 to 74 Years | 258 | 22.0% |
| 75 to 84 Years | 215 | 18.3% |
| 85 Years and Over | 181 | 15.4% |
| Total | 1,172 | 100.0% |
Housing Finances in Mountain View
Median Income by Occupancy in Mountain View
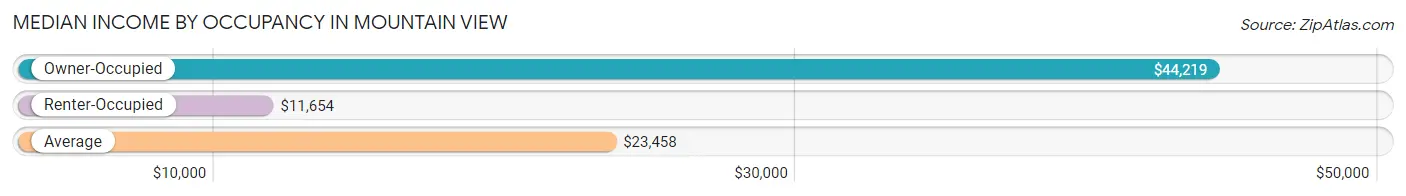
| Occupancy Type | # Households | Median Income |
| Owner-Occupied | 629 (53.7%) | $44,219 |
| Renter-Occupied | 543 (46.3%) | $11,654 |
| Average | 1,172 (100.0%) | $23,458 |
Occupancy by Householder Income Bracket in Mountain View
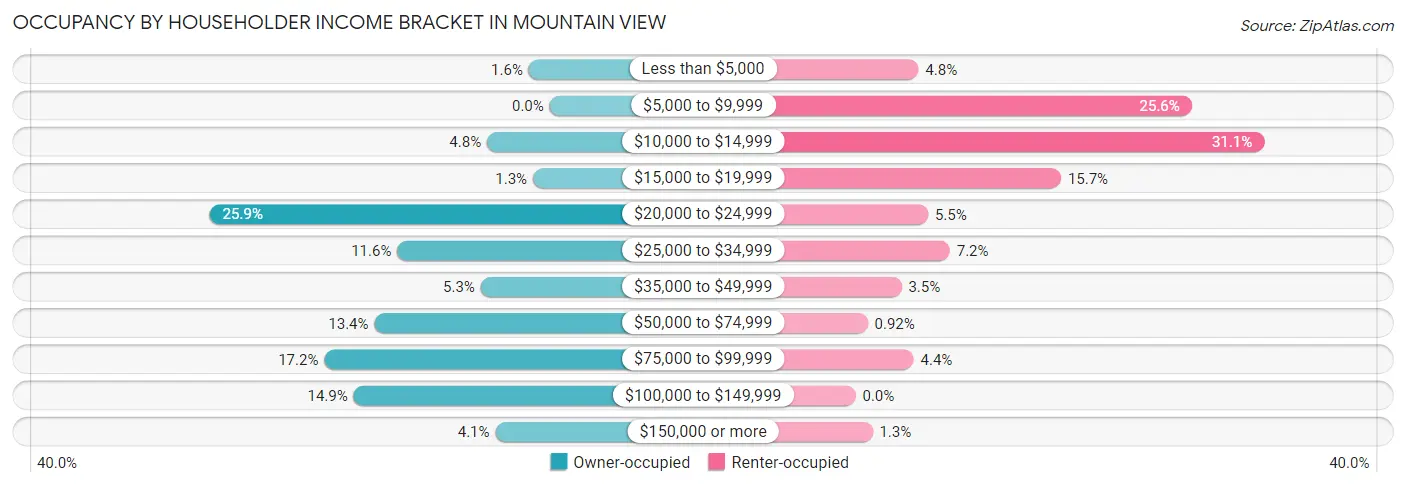
| Income Bracket | Owner-occupied | Renter-occupied |
| Less than $5,000 | 10 (1.6%) | 26 (4.8%) |
| $5,000 to $9,999 | 0 (0.0%) | 139 (25.6%) |
| $10,000 to $14,999 | 30 (4.8%) | 169 (31.1%) |
| $15,000 to $19,999 | 8 (1.3%) | 85 (15.7%) |
| $20,000 to $24,999 | 163 (25.9%) | 30 (5.5%) |
| $25,000 to $34,999 | 73 (11.6%) | 39 (7.2%) |
| $35,000 to $49,999 | 33 (5.2%) | 19 (3.5%) |
| $50,000 to $74,999 | 84 (13.4%) | 5 (0.9%) |
| $75,000 to $99,999 | 108 (17.2%) | 24 (4.4%) |
| $100,000 to $149,999 | 94 (14.9%) | 0 (0.0%) |
| $150,000 or more | 26 (4.1%) | 7 (1.3%) |
| Total | 629 (100.0%) | 543 (100.0%) |
Monthly Housing Cost Tiers in Mountain View
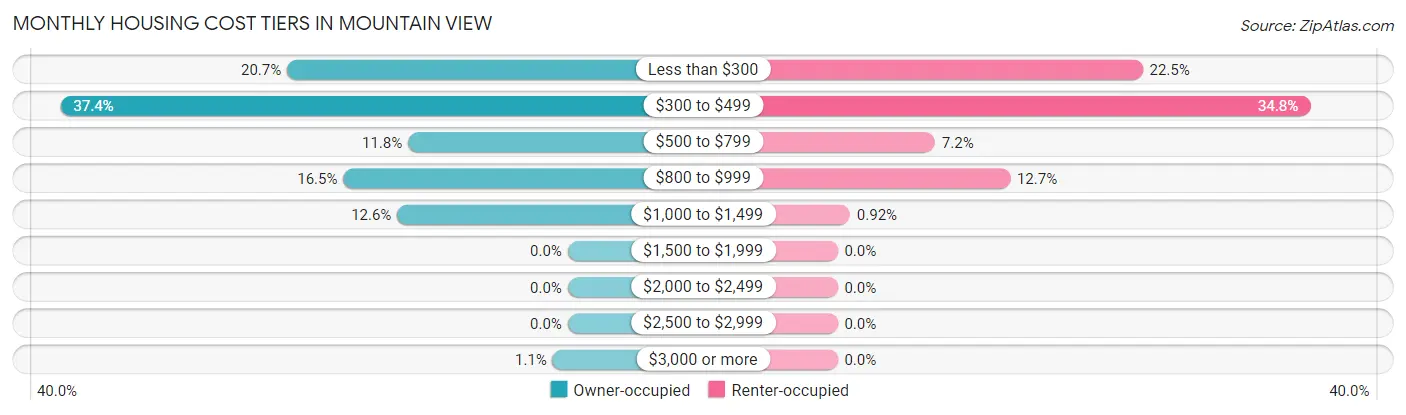
| Monthly Cost | Owner-occupied | Renter-occupied |
| Less than $300 | 130 (20.7%) | 122 (22.5%) |
| $300 to $499 | 235 (37.4%) | 189 (34.8%) |
| $500 to $799 | 74 (11.8%) | 39 (7.2%) |
| $800 to $999 | 104 (16.5%) | 69 (12.7%) |
| $1,000 to $1,499 | 79 (12.6%) | 5 (0.9%) |
| $1,500 to $1,999 | 0 (0.0%) | 0 (0.0%) |
| $2,000 to $2,499 | 0 (0.0%) | 0 (0.0%) |
| $2,500 to $2,999 | 0 (0.0%) | 0 (0.0%) |
| $3,000 or more | 7 (1.1%) | 0 (0.0%) |
| Total | 629 (100.0%) | 543 (100.0%) |
Physical Housing Characteristics in Mountain View
Housing Structures in Mountain View
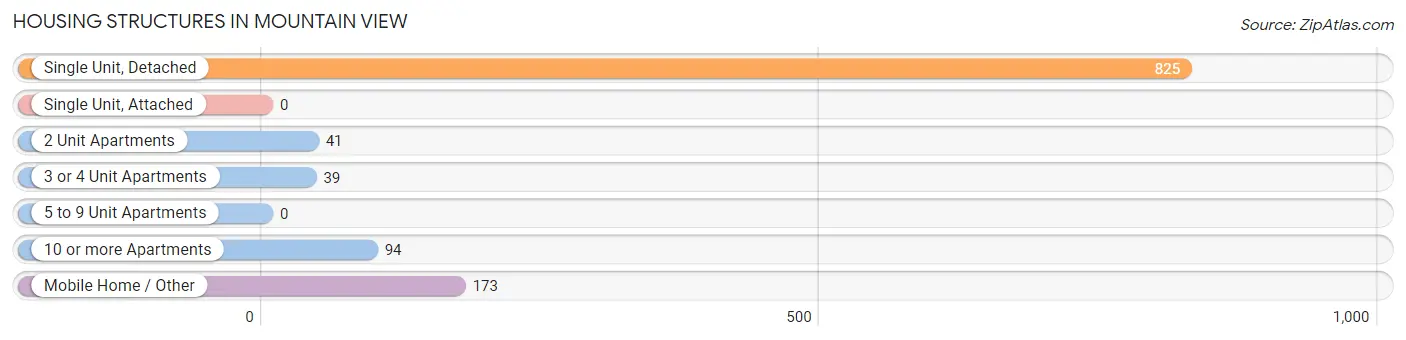
| Structure Type | # Housing Units | % Housing Units |
| Single Unit, Detached | 825 | 70.4% |
| Single Unit, Attached | 0 | 0.0% |
| 2 Unit Apartments | 41 | 3.5% |
| 3 or 4 Unit Apartments | 39 | 3.3% |
| 5 to 9 Unit Apartments | 0 | 0.0% |
| 10 or more Apartments | 94 | 8.0% |
| Mobile Home / Other | 173 | 14.8% |
| Total | 1,172 | 100.0% |
Housing Structures by Occupancy in Mountain View
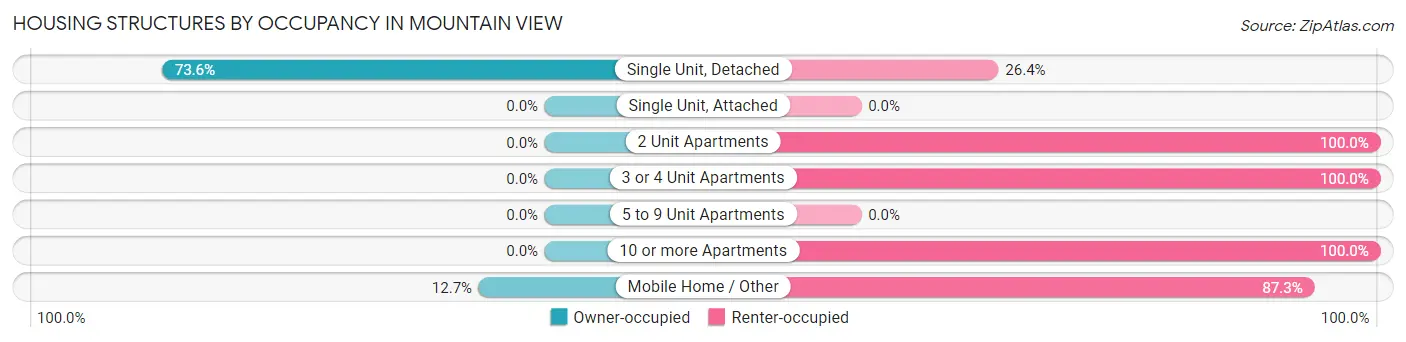
| Structure Type | Owner-occupied | Renter-occupied |
| Single Unit, Detached | 607 (73.6%) | 218 (26.4%) |
| Single Unit, Attached | 0 (0.0%) | 0 (0.0%) |
| 2 Unit Apartments | 0 (0.0%) | 41 (100.0%) |
| 3 or 4 Unit Apartments | 0 (0.0%) | 39 (100.0%) |
| 5 to 9 Unit Apartments | 0 (0.0%) | 0 (0.0%) |
| 10 or more Apartments | 0 (0.0%) | 94 (100.0%) |
| Mobile Home / Other | 22 (12.7%) | 151 (87.3%) |
| Total | 629 (53.7%) | 543 (46.3%) |
Housing Structures by Number of Rooms in Mountain View
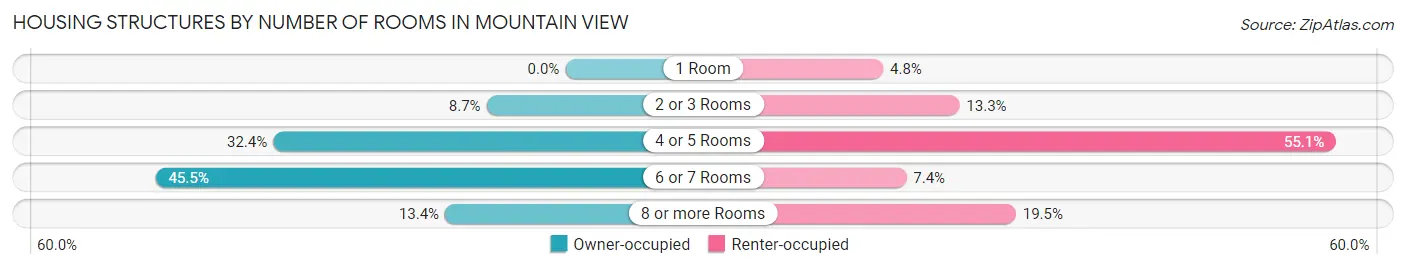
| Number of Rooms | Owner-occupied | Renter-occupied |
| 1 Room | 0 (0.0%) | 26 (4.8%) |
| 2 or 3 Rooms | 55 (8.7%) | 72 (13.3%) |
| 4 or 5 Rooms | 204 (32.4%) | 299 (55.1%) |
| 6 or 7 Rooms | 286 (45.5%) | 40 (7.4%) |
| 8 or more Rooms | 84 (13.4%) | 106 (19.5%) |
| Total | 629 (100.0%) | 543 (100.0%) |
Housing Structure by Heating Type in Mountain View
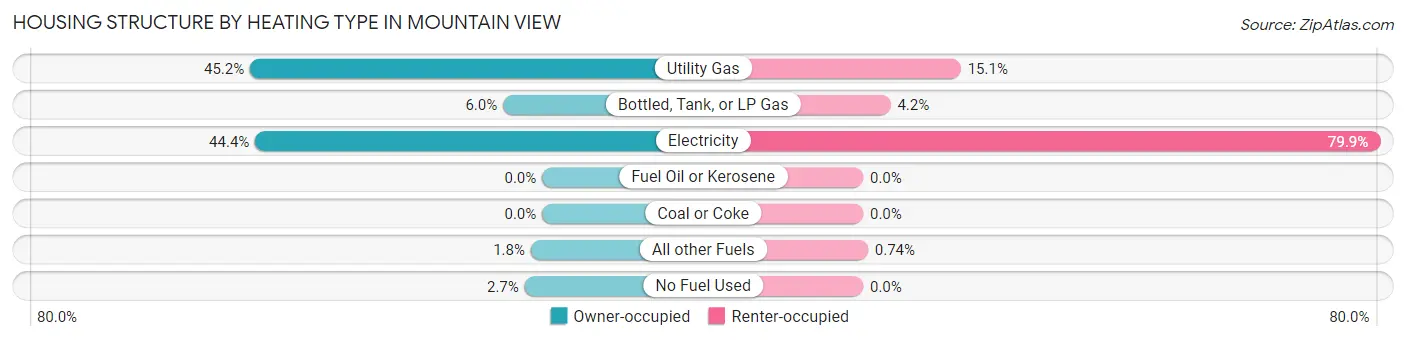
| Heating Type | Owner-occupied | Renter-occupied |
| Utility Gas | 284 (45.2%) | 82 (15.1%) |
| Bottled, Tank, or LP Gas | 38 (6.0%) | 23 (4.2%) |
| Electricity | 279 (44.4%) | 434 (79.9%) |
| Fuel Oil or Kerosene | 0 (0.0%) | 0 (0.0%) |
| Coal or Coke | 0 (0.0%) | 0 (0.0%) |
| All other Fuels | 11 (1.8%) | 4 (0.7%) |
| No Fuel Used | 17 (2.7%) | 0 (0.0%) |
| Total | 629 (100.0%) | 543 (100.0%) |
Household Vehicle Usage in Mountain View
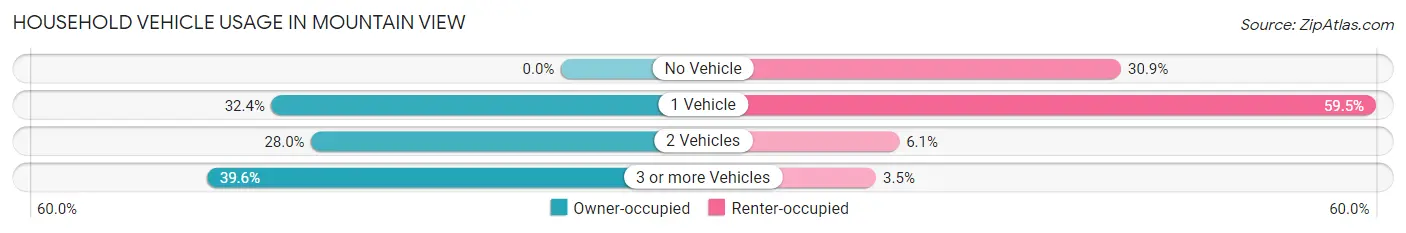
| Vehicles per Household | Owner-occupied | Renter-occupied |
| No Vehicle | 0 (0.0%) | 168 (30.9%) |
| 1 Vehicle | 204 (32.4%) | 323 (59.5%) |
| 2 Vehicles | 176 (28.0%) | 33 (6.1%) |
| 3 or more Vehicles | 249 (39.6%) | 19 (3.5%) |
| Total | 629 (100.0%) | 543 (100.0%) |
Real Estate & Mortgages in Mountain View
Real Estate and Mortgage Overview in Mountain View
| Characteristic | Without Mortgage | With Mortgage |
| Housing Units | 400 | 229 |
| Median Property Value | $216,600 | $154,700 |
| Median Household Income | - | - |
| Monthly Housing Costs | $354 | $7 |
| Real Estate Taxes | $568 | $0 |
Property Value by Mortgage Status in Mountain View
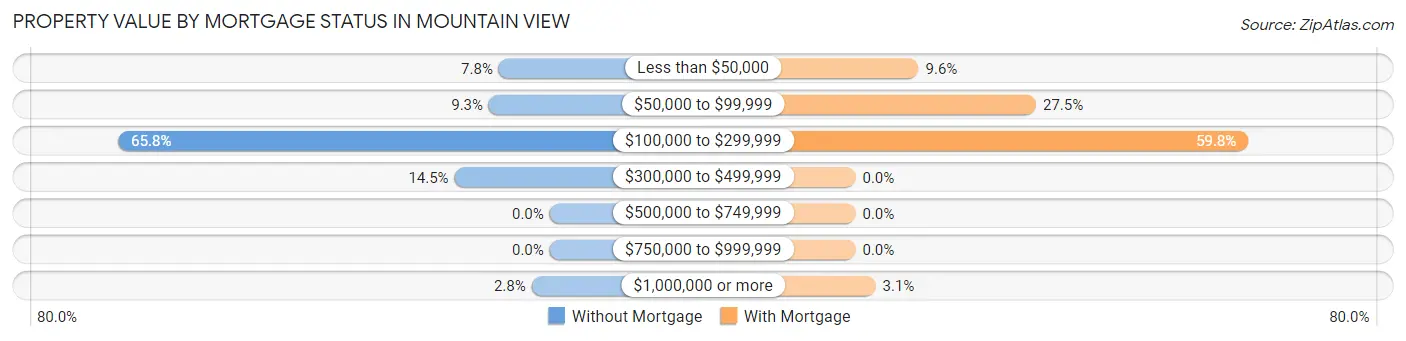
| Property Value | Without Mortgage | With Mortgage |
| Less than $50,000 | 31 (7.7%) | 22 (9.6%) |
| $50,000 to $99,999 | 37 (9.2%) | 63 (27.5%) |
| $100,000 to $299,999 | 263 (65.7%) | 137 (59.8%) |
| $300,000 to $499,999 | 58 (14.5%) | 0 (0.0%) |
| $500,000 to $749,999 | 0 (0.0%) | 0 (0.0%) |
| $750,000 to $999,999 | 0 (0.0%) | 0 (0.0%) |
| $1,000,000 or more | 11 (2.8%) | 7 (3.1%) |
| Total | 400 (100.0%) | 229 (100.0%) |
Household Income by Mortgage Status in Mountain View
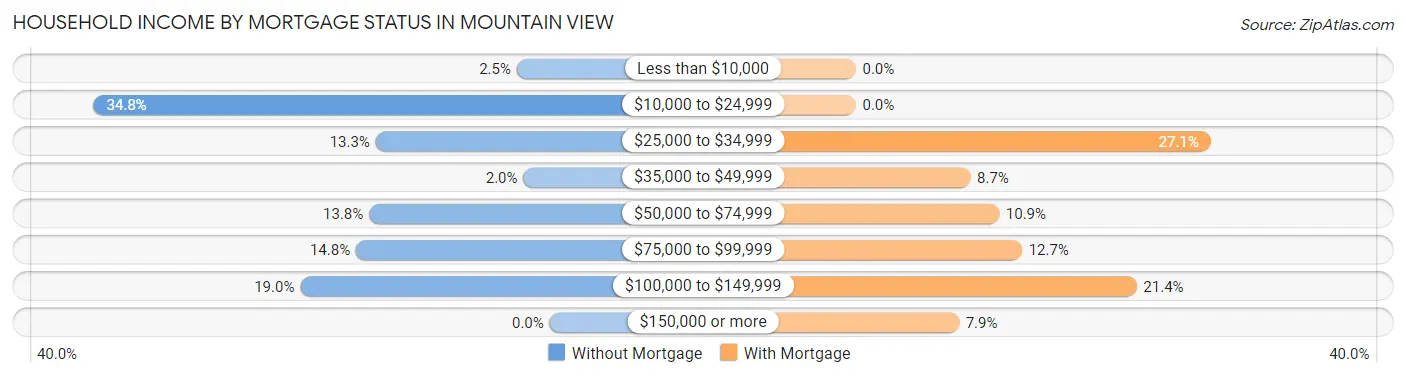
| Household Income | Without Mortgage | With Mortgage |
| Less than $10,000 | 10 (2.5%) | 0 (0.0%) |
| $10,000 to $24,999 | 139 (34.7%) | 0 (0.0%) |
| $25,000 to $34,999 | 53 (13.3%) | 62 (27.1%) |
| $35,000 to $49,999 | 8 (2.0%) | 20 (8.7%) |
| $50,000 to $74,999 | 55 (13.8%) | 25 (10.9%) |
| $75,000 to $99,999 | 59 (14.7%) | 29 (12.7%) |
| $100,000 to $149,999 | 76 (19.0%) | 49 (21.4%) |
| $150,000 or more | 0 (0.0%) | 18 (7.9%) |
| Total | 400 (100.0%) | 229 (100.0%) |
Property Value to Household Income Ratio in Mountain View
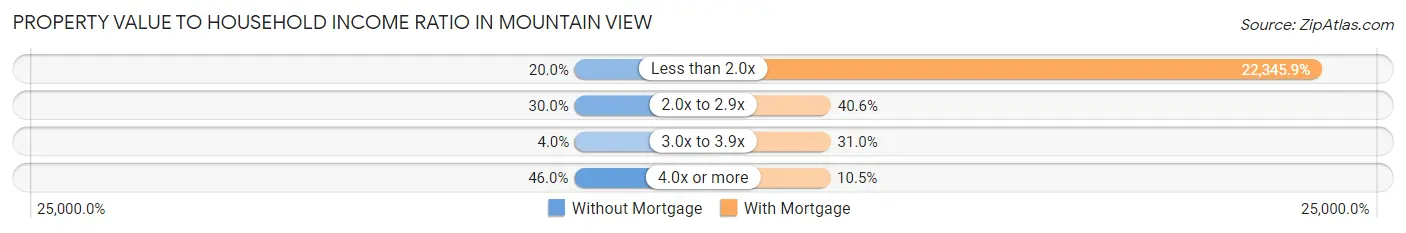
| Value-to-Income Ratio | Without Mortgage | With Mortgage |
| Less than 2.0x | 80 (20.0%) | 51,172 (22,345.8%) |
| 2.0x to 2.9x | 120 (30.0%) | 93 (40.6%) |
| 3.0x to 3.9x | 16 (4.0%) | 71 (31.0%) |
| 4.0x or more | 184 (46.0%) | 24 (10.5%) |
| Total | 400 (100.0%) | 229 (100.0%) |
Real Estate Taxes by Mortgage Status in Mountain View
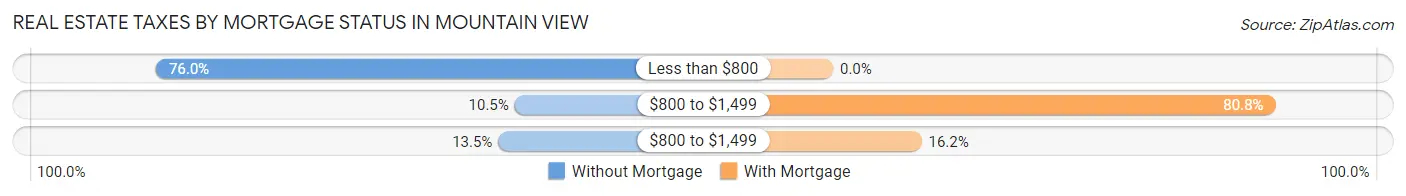
| Property Taxes | Without Mortgage | With Mortgage |
| Less than $800 | 304 (76.0%) | 0 (0.0%) |
| $800 to $1,499 | 42 (10.5%) | 185 (80.8%) |
| $800 to $1,499 | 54 (13.5%) | 37 (16.2%) |
| Total | 400 (100.0%) | 229 (100.0%) |
Health & Disability in Mountain View
Health Insurance Coverage by Age in Mountain View
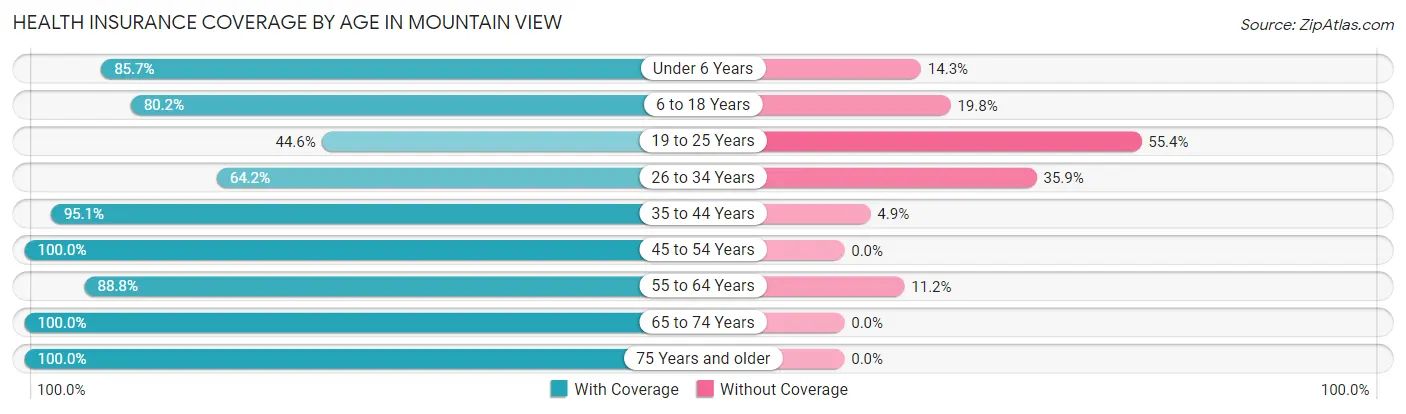
| Age Bracket | With Coverage | Without Coverage |
| Under 6 Years | 102 (85.7%) | 17 (14.3%) |
| 6 to 18 Years | 316 (80.2%) | 78 (19.8%) |
| 19 to 25 Years | 87 (44.6%) | 108 (55.4%) |
| 26 to 34 Years | 68 (64.1%) | 38 (35.8%) |
| 35 to 44 Years | 215 (95.1%) | 11 (4.9%) |
| 45 to 54 Years | 258 (100.0%) | 0 (0.0%) |
| 55 to 64 Years | 444 (88.8%) | 56 (11.2%) |
| 65 to 74 Years | 496 (100.0%) | 0 (0.0%) |
| 75 Years and older | 470 (100.0%) | 0 (0.0%) |
| Total | 2,456 (88.9%) | 308 (11.1%) |
Health Insurance Coverage by Citizenship Status in Mountain View
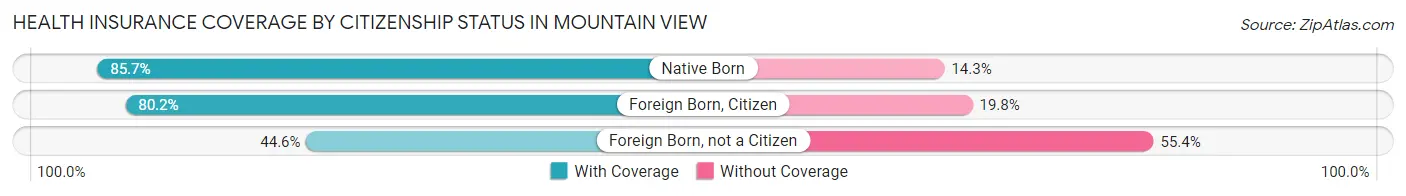
| Citizenship Status | With Coverage | Without Coverage |
| Native Born | 102 (85.7%) | 17 (14.3%) |
| Foreign Born, Citizen | 316 (80.2%) | 78 (19.8%) |
| Foreign Born, not a Citizen | 87 (44.6%) | 108 (55.4%) |
Health Insurance Coverage by Household Income in Mountain View
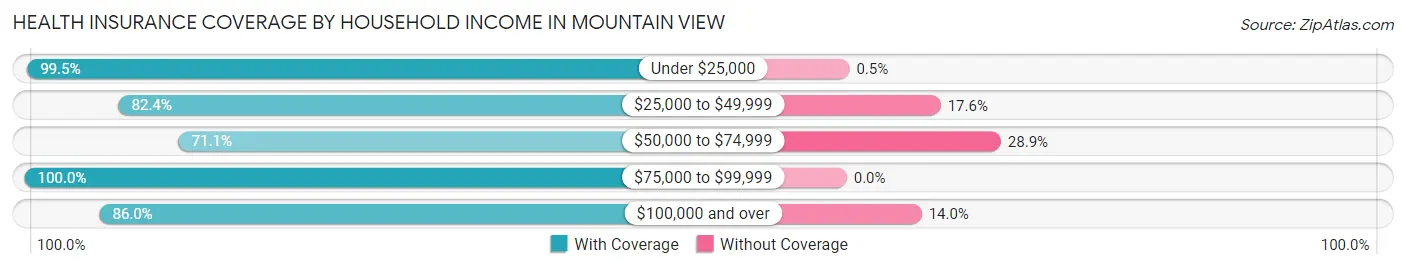
| Household Income | With Coverage | Without Coverage |
| Under $25,000 | 804 (99.5%) | 4 (0.5%) |
| $25,000 to $49,999 | 473 (82.4%) | 101 (17.6%) |
| $50,000 to $74,999 | 303 (71.1%) | 123 (28.9%) |
| $75,000 to $99,999 | 370 (100.0%) | 0 (0.0%) |
| $100,000 and over | 472 (86.0%) | 77 (14.0%) |
Public vs Private Health Insurance Coverage by Age in Mountain View
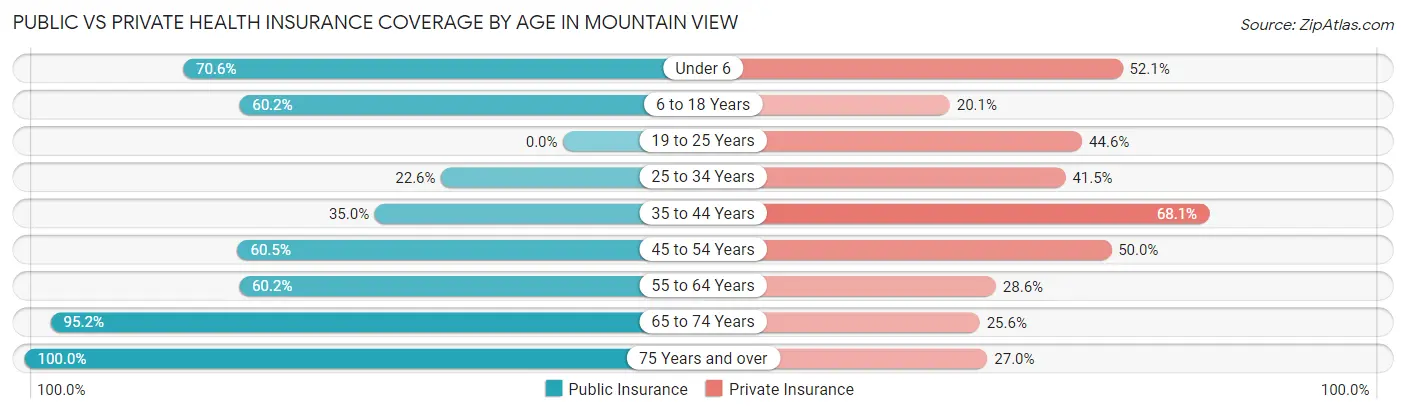
| Age Bracket | Public Insurance | Private Insurance |
| Under 6 | 84 (70.6%) | 62 (52.1%) |
| 6 to 18 Years | 237 (60.2%) | 79 (20.1%) |
| 19 to 25 Years | 0 (0.0%) | 87 (44.6%) |
| 25 to 34 Years | 24 (22.6%) | 44 (41.5%) |
| 35 to 44 Years | 79 (35.0%) | 154 (68.1%) |
| 45 to 54 Years | 156 (60.5%) | 129 (50.0%) |
| 55 to 64 Years | 301 (60.2%) | 143 (28.6%) |
| 65 to 74 Years | 472 (95.2%) | 127 (25.6%) |
| 75 Years and over | 470 (100.0%) | 127 (27.0%) |
| Total | 1,823 (66.0%) | 952 (34.4%) |
Disability Status by Sex by Age in Mountain View
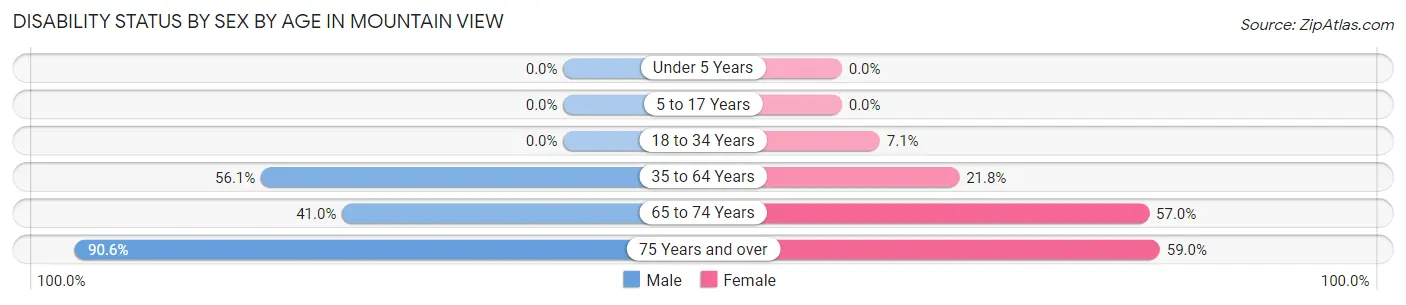
| Age Bracket | Male | Female |
| Under 5 Years | 0 (0.0%) | 0 (0.0%) |
| 5 to 17 Years | 0 (0.0%) | 0 (0.0%) |
| 18 to 34 Years | 0 (0.0%) | 24 (7.1%) |
| 35 to 64 Years | 207 (56.1%) | 134 (21.8%) |
| 65 to 74 Years | 87 (41.0%) | 162 (57.0%) |
| 75 Years and over | 145 (90.6%) | 183 (59.0%) |
Disability Class by Sex by Age in Mountain View
Disability Class: Hearing Difficulty
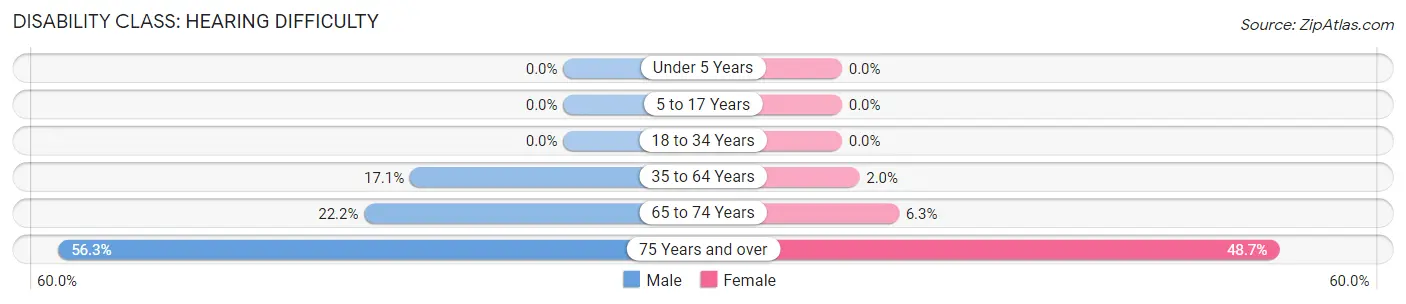
| Age Bracket | Male | Female |
| Under 5 Years | 0 (0.0%) | 0 (0.0%) |
| 5 to 17 Years | 0 (0.0%) | 0 (0.0%) |
| 18 to 34 Years | 0 (0.0%) | 0 (0.0%) |
| 35 to 64 Years | 63 (17.1%) | 12 (1.9%) |
| 65 to 74 Years | 47 (22.2%) | 18 (6.3%) |
| 75 Years and over | 90 (56.2%) | 151 (48.7%) |
Disability Class: Vision Difficulty
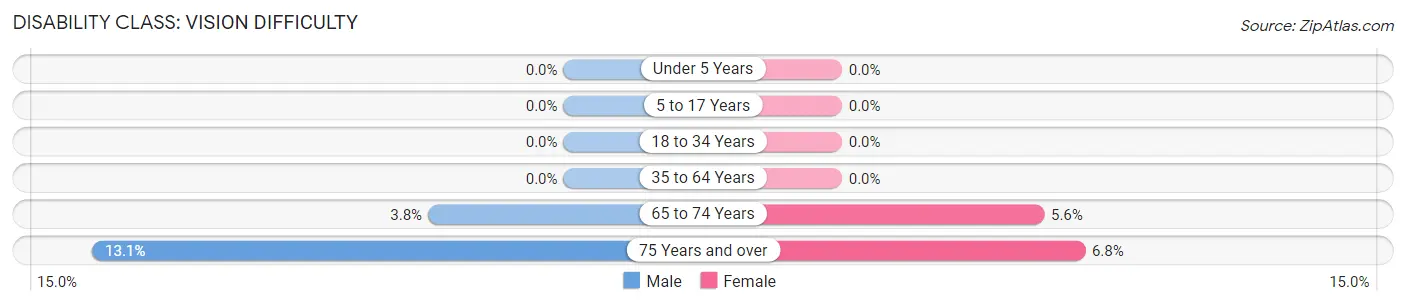
| Age Bracket | Male | Female |
| Under 5 Years | 0 (0.0%) | 0 (0.0%) |
| 5 to 17 Years | 0 (0.0%) | 0 (0.0%) |
| 18 to 34 Years | 0 (0.0%) | 0 (0.0%) |
| 35 to 64 Years | 0 (0.0%) | 0 (0.0%) |
| 65 to 74 Years | 8 (3.8%) | 16 (5.6%) |
| 75 Years and over | 21 (13.1%) | 21 (6.8%) |
Disability Class: Cognitive Difficulty
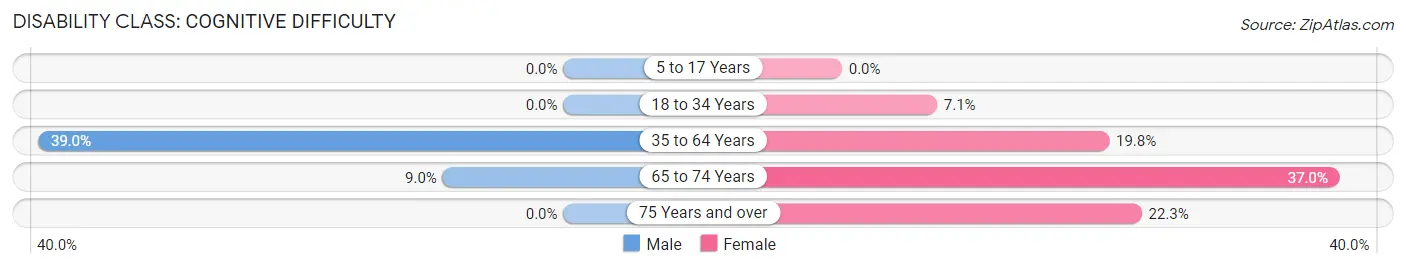
| Age Bracket | Male | Female |
| 5 to 17 Years | 0 (0.0%) | 0 (0.0%) |
| 18 to 34 Years | 0 (0.0%) | 24 (7.1%) |
| 35 to 64 Years | 144 (39.0%) | 122 (19.8%) |
| 65 to 74 Years | 19 (9.0%) | 105 (37.0%) |
| 75 Years and over | 0 (0.0%) | 69 (22.3%) |
Disability Class: Ambulatory Difficulty
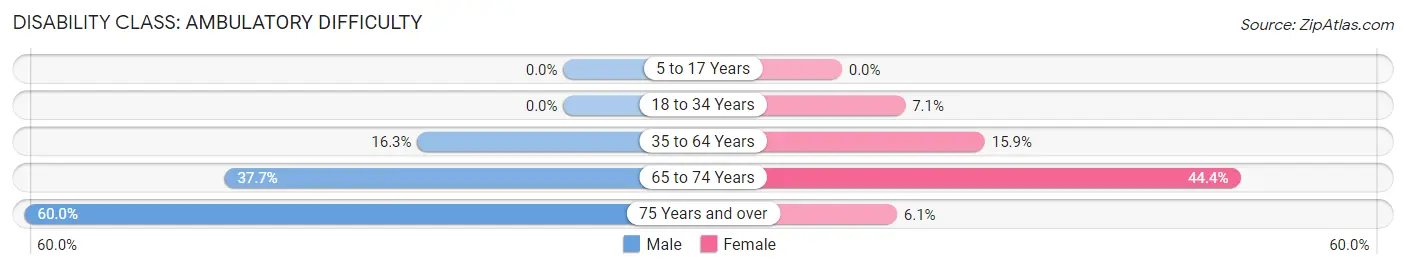
| Age Bracket | Male | Female |
| 5 to 17 Years | 0 (0.0%) | 0 (0.0%) |
| 18 to 34 Years | 0 (0.0%) | 24 (7.1%) |
| 35 to 64 Years | 60 (16.3%) | 98 (15.9%) |
| 65 to 74 Years | 80 (37.7%) | 126 (44.4%) |
| 75 Years and over | 96 (60.0%) | 19 (6.1%) |
Disability Class: Self-Care Difficulty
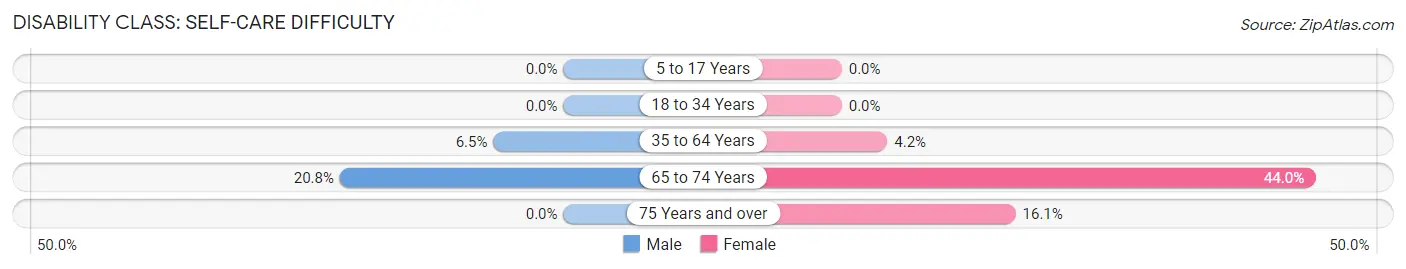
| Age Bracket | Male | Female |
| 5 to 17 Years | 0 (0.0%) | 0 (0.0%) |
| 18 to 34 Years | 0 (0.0%) | 0 (0.0%) |
| 35 to 64 Years | 24 (6.5%) | 26 (4.2%) |
| 65 to 74 Years | 44 (20.7%) | 125 (44.0%) |
| 75 Years and over | 0 (0.0%) | 50 (16.1%) |
Technology Access in Mountain View
Computing Device Access in Mountain View
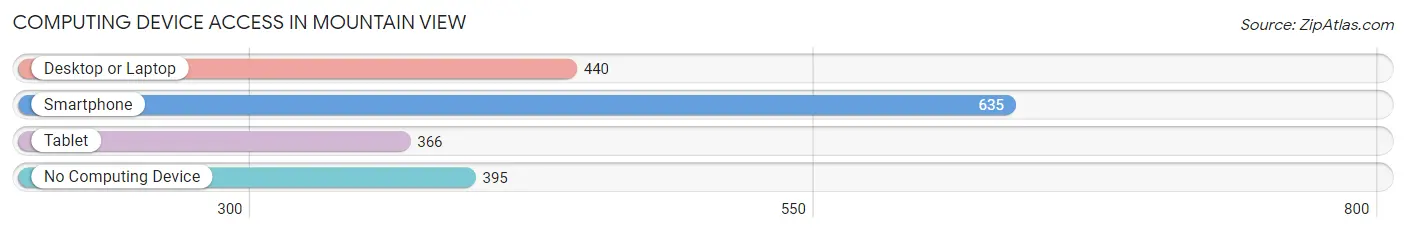
| Device Type | # Households | % Households |
| Desktop or Laptop | 440 | 37.5% |
| Smartphone | 635 | 54.2% |
| Tablet | 366 | 31.2% |
| No Computing Device | 395 | 33.7% |
| Total | 1,172 | 100.0% |
Internet Access in Mountain View
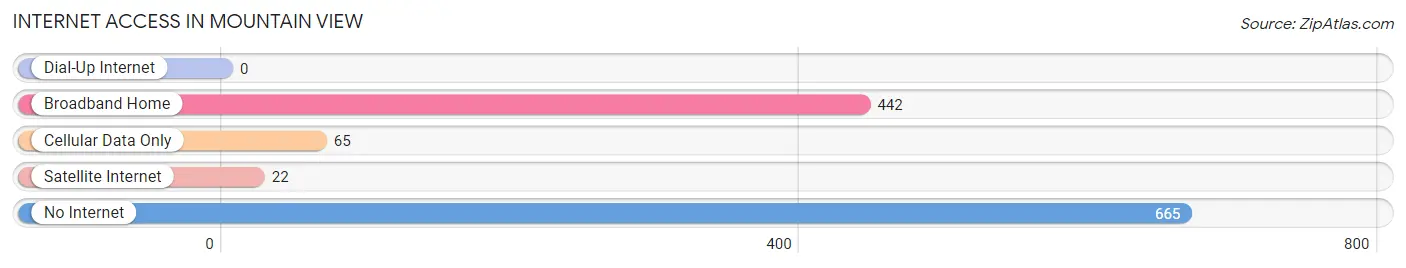
| Internet Type | # Households | % Households |
| Dial-Up Internet | 0 | 0.0% |
| Broadband Home | 442 | 37.7% |
| Cellular Data Only | 65 | 5.6% |
| Satellite Internet | 22 | 1.9% |
| No Internet | 665 | 56.7% |
| Total | 1,172 | 100.0% |
Mountain View Summary
Mountain View, Arkansas is a small city located in Stone County in the Ozark Mountains of north-central Arkansas. It is the county seat of Stone County and is the largest city in the county. The city is located on the White River and is known for its beautiful scenery and outdoor activities.
Geography
Mountain View is located in the Ozark Mountains of north-central Arkansas. It is situated in Stone County, which is bordered by Searcy County to the north, Van Buren County to the east, Cleburne County to the south, and Independence County to the west. The city is located on the White River, which is a tributary of the Arkansas River. The city is surrounded by the Ozark National Forest, which provides a variety of outdoor activities such as camping, fishing, and hiking. The city is also located near the Buffalo National River, which is a popular destination for canoeing and kayaking.
The city has a total area of 4.2 square miles, all of which is land. The elevation of the city is 845 feet above sea level. The climate of the city is humid subtropical, with hot, humid summers and mild winters.
History
Mountain View was founded in 1873 by a group of settlers from Missouri. The city was named for its location in the Ozark Mountains. The city was incorporated in 1876 and was designated as the county seat of Stone County.
The city grew rapidly in the late 19th and early 20th centuries, due to its location on the White River and its proximity to the Ozark National Forest. The city was a popular destination for tourists, who came to enjoy the scenery and outdoor activities.
In the mid-20th century, the city began to decline as the timber industry declined and the population shifted to larger cities. The city was revitalized in the late 20th century, as tourism and outdoor recreation became popular again.
Economy
Mountain View has a diverse economy, with a mix of manufacturing, retail, and tourism. The city is home to several manufacturing companies, including a furniture factory, a woodworking plant, and a plastics factory. The city is also home to several retail stores, including a Walmart Supercenter and several smaller stores.
Tourism is an important part of the city's economy. The city is home to several attractions, including the Ozark Folk Center State Park, the Ozark Heritage Arts Center, and the Ozark Mountain Music Festival. The city is also home to several outdoor recreation areas, including the White River and the Ozark National Forest.
Demographics
As of the 2010 census, the population of Mountain View was 2,876. The racial makeup of the city was 95.3% White, 0.7% African American, 0.3% Native American, 0.3% Asian, 0.1% Pacific Islander, 1.2% from other races, and 2.3% from two or more races. Hispanic or Latino of any race were 3.2% of the population.
The median household income in Mountain View was $30,938, and the median family income was $37,813. The per capita income was $17,845. About 17.3% of the population was below the poverty line.
Mountain View is a small city with a rich history and a diverse economy. The city is known for its beautiful scenery and outdoor activities, and is a popular destination for tourists. The city has a diverse population and a strong economy, and is a great place to live and work.
Common Questions
What is Per Capita Income in Mountain View?
Per Capita income in Mountain View is $22,568.
What is the Median Family Income in Mountain View?
Median Family Income in Mountain View is $72,661.
What is the Median Household income in Mountain View?
Median Household Income in Mountain View is $23,458.
What is Income or Wage Gap in Mountain View?
Income or Wage Gap in Mountain View is 24.2%.
Women in Mountain View earn 75.8 cents for every dollar earned by a man.
What is Inequality or Gini Index in Mountain View?
Inequality or Gini Index in Mountain View is 0.55.
What is the Total Population of Mountain View?
Total Population of Mountain View is 2,868.
What is the Total Male Population of Mountain View?
Total Male Population of Mountain View is 1,031.
What is the Total Female Population of Mountain View?
Total Female Population of Mountain View is 1,837.
What is the Ratio of Males per 100 Females in Mountain View?
There are 56.12 Males per 100 Females in Mountain View.
What is the Ratio of Females per 100 Males in Mountain View?
There are 178.18 Females per 100 Males in Mountain View.
What is the Median Population Age in Mountain View?
Median Population Age in Mountain View is 55.5 Years.
What is the Average Family Size in Mountain View
Average Family Size in Mountain View is 3.7 People.
What is the Average Household Size in Mountain View
Average Household Size in Mountain View is 2.3 People.
How Large is the Labor Force in Mountain View?
There are 771 People in the Labor Forcein in Mountain View.
What is the Percentage of People in the Labor Force in Mountain View?
31.5% of People are in the Labor Force in Mountain View.