Zip Codes with the Highest Percentage of Population Employed in Architecture & Engineering in Cullman, AL
RELATED REPORTS & OPTIONS
Architecture & Engineering
Cullman
Compare Zip Codes
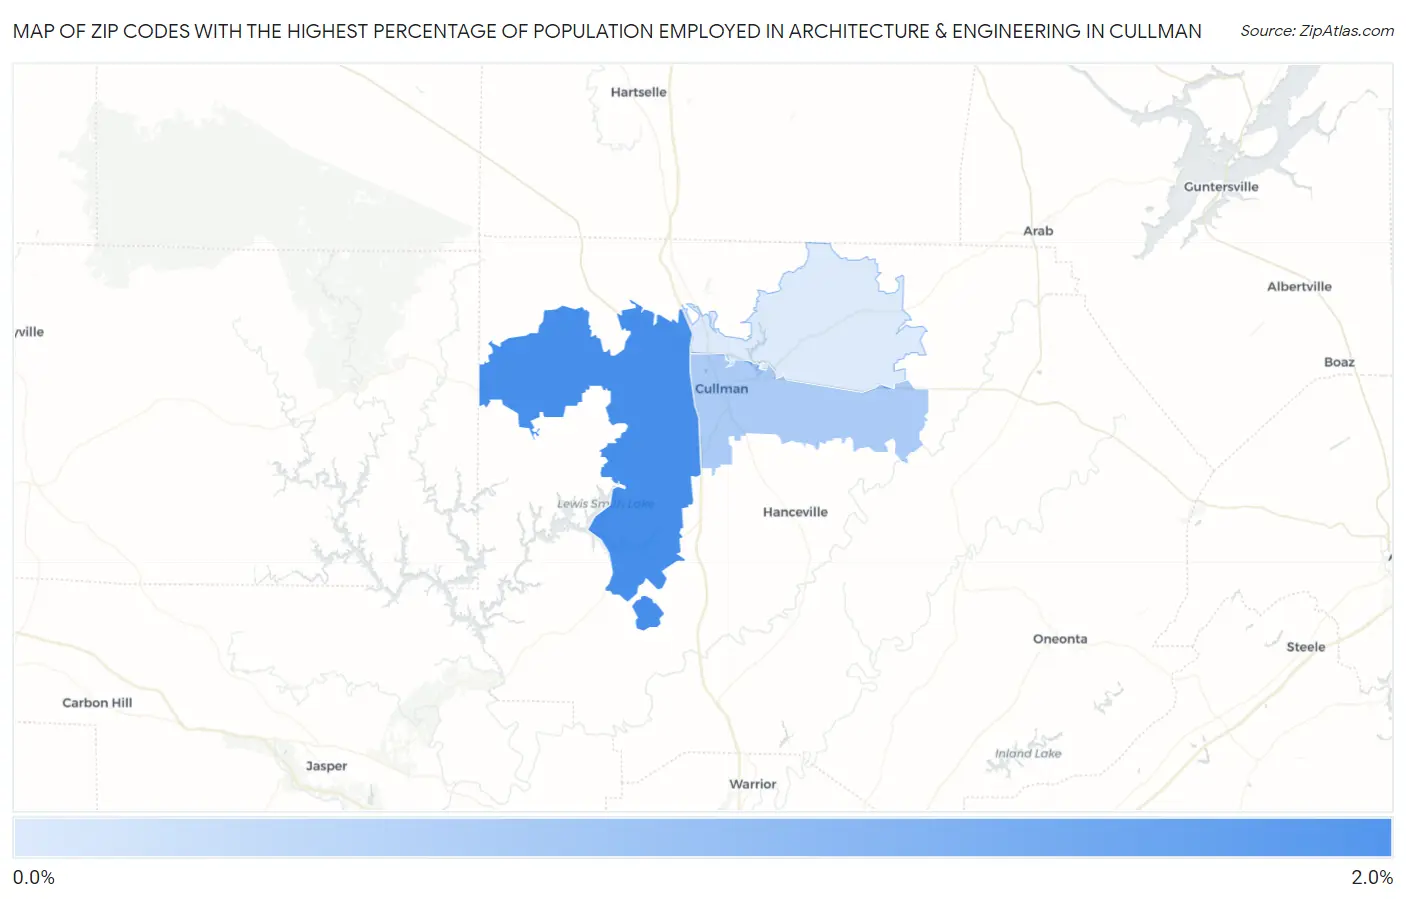
Map of Zip Codes with the Highest Percentage of Population Employed in Architecture & Engineering in Cullman
0.87%
1.6%
Zip Codes with the Highest Percentage of Population Employed in Architecture & Engineering in Cullman, AL
| Zip Code | % Employed | vs State | vs National | |
| 1. | 35057 | 1.6% | 2.4%(-0.806)#232 | 2.1%(-0.549)#12,180 |
| 2. | 35055 | 1.1% | 2.4%(-1.30)#303 | 2.1%(-1.04)#15,774 |
| 3. | 35058 | 0.87% | 2.4%(-1.54)#349 | 2.1%(-1.28)#17,626 |
1
Common Questions
What are the Top Zip Codes with the Highest Percentage of Population Employed in Architecture & Engineering in Cullman, AL?
Top Zip Codes with the Highest Percentage of Population Employed in Architecture & Engineering in Cullman, AL are:
What zip code has the Highest Percentage of Population Employed in Architecture & Engineering in Cullman, AL?
35057 has the Highest Percentage of Population Employed in Architecture & Engineering in Cullman, AL with 1.6%.
What is the Percentage of Population Employed in Architecture & Engineering in Cullman, AL?
Percentage of Population Employed in Architecture & Engineering in Cullman is 1.2%.
What is the Percentage of Population Employed in Architecture & Engineering in Alabama?
Percentage of Population Employed in Architecture & Engineering in Alabama is 2.4%.
What is the Percentage of Population Employed in Architecture & Engineering in the United States?
Percentage of Population Employed in Architecture & Engineering in the United States is 2.1%.