Cities with the Highest Percentage of Immigrants from Caribbean in South Carolina
RELATED REPORTS & OPTIONS
Caribbean
South Carolina
Compare Cities
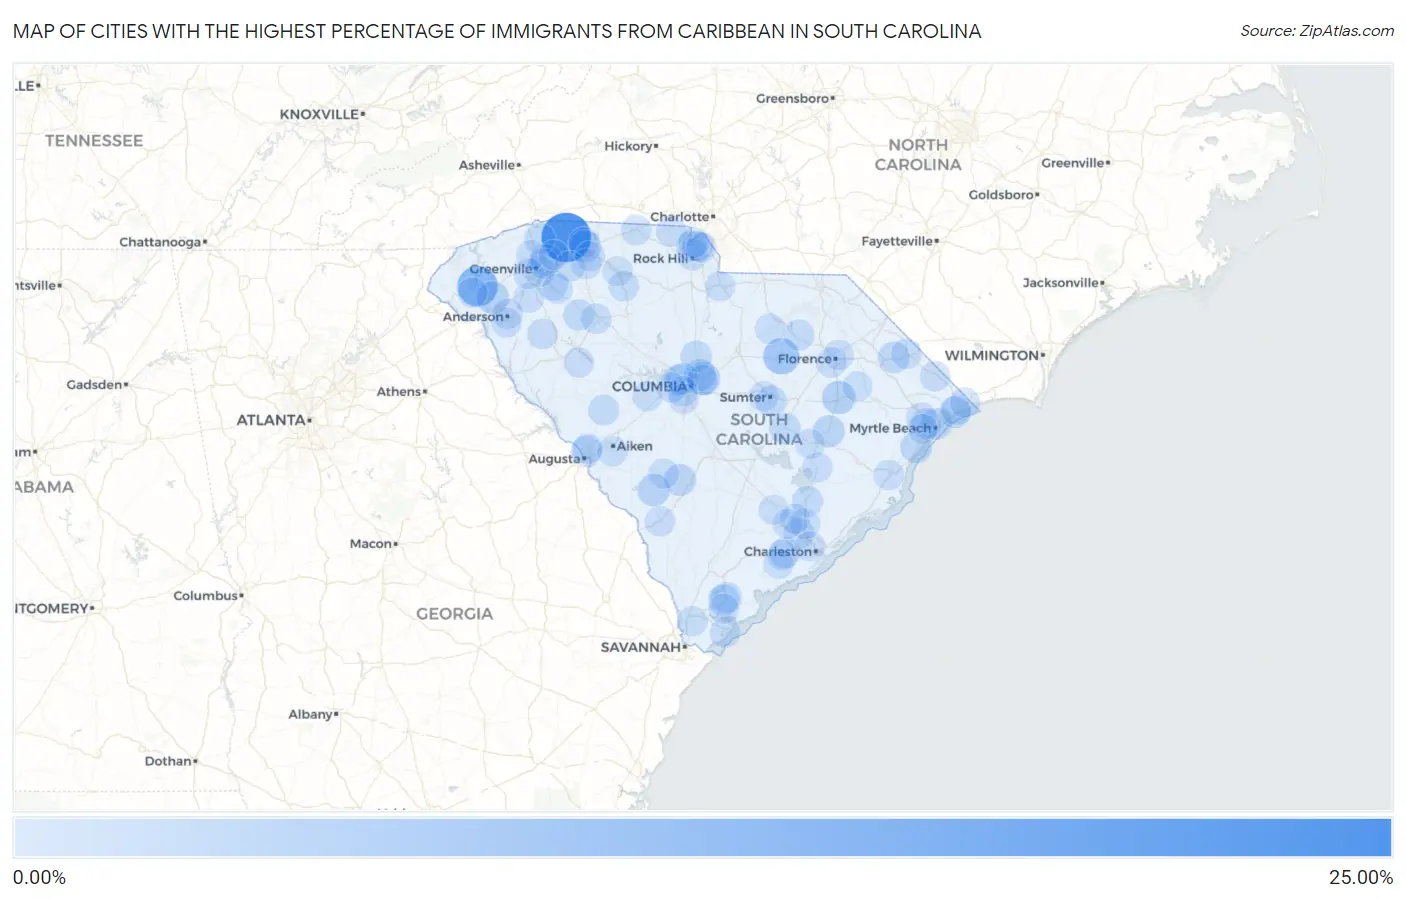
Map of Cities with the Highest Percentage of Immigrants from Caribbean in South Carolina
0.00%
25.00%
Cities with the Highest Percentage of Immigrants from Caribbean in South Carolina
| City | Caribbean | vs State | vs National | |
| 1. | Gramling | 20.25% | 0.33%(+19.9)#-1 | 1.37%(+18.9)#0 |
| 2. | Newry | 10.56% | 0.33%(+10.2)#0 | 1.37%(+9.18)#1 |
| 3. | Bishopville | 6.13% | 0.33%(+5.79)#1 | 1.37%(+4.76)#2 |
| 4. | Scranton | 3.46% | 0.33%(+3.12)#2 | 1.37%(+2.08)#3 |
| 5. | Woodfield | 3.19% | 0.33%(+2.86)#3 | 1.37%(+1.82)#4 |
| 6. | Centenary | 2.91% | 0.33%(+2.57)#4 | 1.37%(+1.53)#5 |
| 7. | Pendleton | 2.60% | 0.33%(+2.27)#5 | 1.37%(+1.23)#6 |
| 8. | Barnwell | 2.58% | 0.33%(+2.25)#6 | 1.37%(+1.21)#7 |
| 9. | Drayton | 2.57% | 0.33%(+2.24)#7 | 1.37%(+1.20)#8 |
| 10. | Valley Falls | 2.35% | 0.33%(+2.02)#8 | 1.37%(+0.978)#9 |
| 11. | Kingstree | 2.15% | 0.33%(+1.82)#9 | 1.37%(+0.782)#10 |
| 12. | Taylors | 1.92% | 0.33%(+1.59)#10 | 1.37%(+0.549)#11 |
| 13. | Denmark | 1.90% | 0.33%(+1.57)#11 | 1.37%(+0.529)#12 |
| 14. | Dentsville | 1.87% | 0.33%(+1.54)#12 | 1.37%(+0.500)#13 |
| 15. | Myrtle Beach | 1.65% | 0.33%(+1.32)#13 | 1.37%(+0.280)#14 |
| 16. | St Andrews | 1.62% | 0.33%(+1.29)#14 | 1.37%(+0.248)#15 |
| 17. | Murrells Inlet | 1.58% | 0.33%(+1.25)#15 | 1.37%(+0.211)#16 |
| 18. | Mullins | 1.54% | 0.33%(+1.21)#16 | 1.37%(+0.172)#17 |
| 19. | Atlantic Beach | 1.51% | 0.33%(+1.17)#17 | 1.37%(+0.134)#18 |
| 20. | Manning | 1.35% | 0.33%(+1.01)#18 | 1.37%(-0.026)#19 |
| 21. | Blythewood | 1.29% | 0.33%(+0.954)#19 | 1.37%(-0.084)#20 |
| 22. | Laurens | 1.23% | 0.33%(+0.895)#20 | 1.37%(-0.143)#21 |
| 23. | South Sumter | 1.21% | 0.33%(+0.881)#21 | 1.37%(-0.158)#22 |
| 24. | Beaufort | 1.20% | 0.33%(+0.866)#22 | 1.37%(-0.172)#974 |
| 25. | Burton | 1.20% | 0.33%(+0.863)#23 | 1.37%(-0.176)#975 |
| 26. | Hartsville | 1.13% | 0.33%(+0.793)#24 | 1.37%(-0.245)#976 |
| 27. | Tigerville | 1.04% | 0.33%(+0.703)#25 | 1.37%(-0.336)#977 |
| 28. | Moncks Corner | 1.00% | 0.33%(+0.669)#26 | 1.37%(-0.369)#978 |
| 29. | Carolina Forest | 0.98% | 0.33%(+0.649)#27 | 1.37%(-0.389)#979 |
| 30. | North Augusta | 0.97% | 0.33%(+0.636)#28 | 1.37%(-0.402)#980 |
| 31. | Johnston | 0.93% | 0.33%(+0.592)#29 | 1.37%(-0.446)#981 |
| 32. | Forestbrook | 0.90% | 0.33%(+0.570)#30 | 1.37%(-0.469)#982 |
| 33. | Edmund | 0.87% | 0.33%(+0.536)#31 | 1.37%(-0.502)#983 |
| 34. | Seven Oaks | 0.87% | 0.33%(+0.532)#32 | 1.37%(-0.507)#984 |
| 35. | Ravenel | 0.82% | 0.33%(+0.482)#33 | 1.37%(-0.556)#985 |
| 36. | Simpsonville | 0.82% | 0.33%(+0.482)#34 | 1.37%(-0.556)#986 |
| 37. | Clover | 0.76% | 0.33%(+0.431)#35 | 1.37%(-0.608)#987 |
| 38. | Rock Hill | 0.73% | 0.33%(+0.397)#36 | 1.37%(-0.642)#988 |
| 39. | India Hook | 0.73% | 0.33%(+0.396)#37 | 1.37%(-0.643)#989 |
| 40. | Clinton | 0.71% | 0.33%(+0.374)#38 | 1.37%(-0.664)#990 |
| 41. | Union | 0.68% | 0.33%(+0.345)#39 | 1.37%(-0.693)#991 |
| 42. | Columbia | 0.67% | 0.33%(+0.332)#40 | 1.37%(-0.706)#2,387 |
| 43. | Blacksburg | 0.66% | 0.33%(+0.328)#41 | 1.37%(-0.710)#2,388 |
| 44. | Greenville | 0.66% | 0.33%(+0.327)#42 | 1.37%(-0.712)#2,389 |
| 45. | Riverview | 0.65% | 0.33%(+0.313)#43 | 1.37%(-0.726)#2,390 |
| 46. | Anderson | 0.63% | 0.33%(+0.300)#44 | 1.37%(-0.739)#2,391 |
| 47. | Nichols | 0.63% | 0.33%(+0.291)#45 | 1.37%(-0.747)#2,392 |
| 48. | North Charleston | 0.62% | 0.33%(+0.284)#46 | 1.37%(-0.754)#2,393 |
| 49. | Boiling Springs | 0.61% | 0.33%(+0.274)#47 | 1.37%(-0.765)#2,394 |
| 50. | Roebuck | 0.60% | 0.33%(+0.265)#48 | 1.37%(-0.773)#2,395 |
| 51. | Reidville | 0.58% | 0.33%(+0.243)#49 | 1.37%(-0.796)#2,396 |
| 52. | Hilton Head Island | 0.56% | 0.33%(+0.231)#50 | 1.37%(-0.808)#2,397 |
| 53. | Loris | 0.56% | 0.33%(+0.223)#51 | 1.37%(-0.815)#2,398 |
| 54. | Capitol View | 0.54% | 0.33%(+0.210)#52 | 1.37%(-0.828)#2,399 |
| 55. | Arkwright | 0.54% | 0.33%(+0.207)#53 | 1.37%(-0.832)#2,400 |
| 56. | Aiken | 0.54% | 0.33%(+0.206)#54 | 1.37%(-0.832)#2,401 |
| 57. | Donalds | 0.53% | 0.33%(+0.201)#55 | 1.37%(-0.838)#2,402 |
| 58. | Welcome | 0.53% | 0.33%(+0.197)#56 | 1.37%(-0.841)#2,403 |
| 59. | Sumter | 0.49% | 0.33%(+0.161)#57 | 1.37%(-0.878)#2,404 |
| 60. | Springdale | 0.48% | 0.33%(+0.145)#58 | 1.37%(-0.893)#2,405 |
| 61. | Florence | 0.48% | 0.33%(+0.142)#59 | 1.37%(-0.897)#2,406 |
| 62. | Pelzer | 0.47% | 0.33%(+0.139)#60 | 1.37%(-0.899)#2,407 |
| 63. | Belvedere | 0.45% | 0.33%(+0.115)#61 | 1.37%(-0.923)#2,408 |
| 64. | Quinby | 0.45% | 0.33%(+0.112)#62 | 1.37%(-0.927)#2,409 |
| 65. | Bethune | 0.44% | 0.33%(+0.106)#63 | 1.37%(-0.932)#2,410 |
| 66. | Georgetown | 0.43% | 0.33%(+0.091)#64 | 1.37%(-0.947)#2,411 |
| 67. | Hardeeville | 0.41% | 0.33%(+0.076)#65 | 1.37%(-0.962)#2,412 |
| 68. | Allendale | 0.41% | 0.33%(+0.073)#66 | 1.37%(-0.965)#2,413 |
| 69. | White Knoll | 0.40% | 0.33%(+0.070)#67 | 1.37%(-0.969)#2,414 |
| 70. | Homeland Park | 0.40% | 0.33%(+0.069)#68 | 1.37%(-0.970)#2,415 |
| 71. | Goose Creek | 0.40% | 0.33%(+0.065)#69 | 1.37%(-0.973)#2,416 |
| 72. | Red Hill | 0.39% | 0.33%(+0.057)#70 | 1.37%(-0.981)#2,417 |
| 73. | Wade Hampton | 0.39% | 0.33%(+0.056)#71 | 1.37%(-0.982)#2,418 |
| 74. | Ridgeville | 0.39% | 0.33%(+0.054)#72 | 1.37%(-0.985)#2,419 |
| 75. | Spartanburg | 0.38% | 0.33%(+0.047)#73 | 1.37%(-0.991)#2,420 |
| 76. | Summit | 0.37% | 0.33%(+0.037)#74 | 1.37%(-1.00)#2,421 |
| 77. | Hollywood | 0.33% | 0.33%(-0.001)#75 | 1.37%(-1.04)#2,422 |
| 78. | Travelers Rest | 0.33% | 0.33%(-0.006)#76 | 1.37%(-1.04)#2,423 |
| 79. | Charleston | 0.31% | 0.33%(-0.023)#77 | 1.37%(-1.06)#2,424 |
| 80. | Port Royal | 0.31% | 0.33%(-0.025)#78 | 1.37%(-1.06)#2,425 |
| 81. | Seneca | 0.31% | 0.33%(-0.028)#79 | 1.37%(-1.07)#2,426 |
| 82. | Pine Ridge | 0.30% | 0.33%(-0.036)#80 | 1.37%(-1.07)#2,427 |
| 83. | Meggett | 0.30% | 0.33%(-0.037)#81 | 1.37%(-1.08)#2,428 |
| 84. | Blackville | 0.29% | 0.33%(-0.039)#82 | 1.37%(-1.08)#2,429 |
| 85. | Sangaree | 0.29% | 0.33%(-0.046)#83 | 1.37%(-1.08)#2,430 |
| 86. | Fountain Inn | 0.27% | 0.33%(-0.062)#84 | 1.37%(-1.10)#2,431 |
| 87. | Greer | 0.26% | 0.33%(-0.072)#85 | 1.37%(-1.11)#2,432 |
| 88. | Tega Cay | 0.26% | 0.33%(-0.077)#86 | 1.37%(-1.11)#2,433 |
| 89. | Lancaster | 0.24% | 0.33%(-0.090)#87 | 1.37%(-1.13)#2,434 |
| 90. | Greeleyville | 0.24% | 0.33%(-0.095)#88 | 1.37%(-1.13)#2,435 |
| 91. | Ninety Six | 0.23% | 0.33%(-0.101)#89 | 1.37%(-1.14)#2,436 |
| 92. | Fort Mill | 0.23% | 0.33%(-0.104)#90 | 1.37%(-1.14)#2,437 |
| 93. | North Myrtle Beach | 0.22% | 0.33%(-0.117)#91 | 1.37%(-1.15)#2,438 |
| 94. | St Stephen | 0.22% | 0.33%(-0.118)#92 | 1.37%(-1.16)#2,439 |
| 95. | Jonesville | 0.22% | 0.33%(-0.118)#93 | 1.37%(-1.16)#2,440 |
| 96. | Little River | 0.21% | 0.33%(-0.120)#94 | 1.37%(-1.16)#2,441 |
| 97. | Summerville | 0.19% | 0.33%(-0.139)#95 | 1.37%(-1.18)#2,442 |
| 98. | Lexington | 0.19% | 0.33%(-0.144)#96 | 1.37%(-1.18)#2,443 |
| 99. | Pamplico | 0.19% | 0.33%(-0.148)#97 | 1.37%(-1.19)#2,444 |
| 100. | Socastee | 0.18% | 0.33%(-0.158)#98 | 1.37%(-1.20)#2,445 |
Common Questions
What are the Top 10 Cities with the Highest Percentage of Immigrants from Caribbean in South Carolina?
Top 10 Cities with the Highest Percentage of Immigrants from Caribbean in South Carolina are:
#1
20.25%
#2
10.56%
#3
6.13%
#4
3.46%
#5
3.19%
#6
2.60%
#7
2.58%
#8
2.35%
#9
2.15%
#10
1.92%
What city has the Highest Percentage of Immigrants from Caribbean in South Carolina?
Gramling has the Highest Percentage of Immigrants from Caribbean in South Carolina with 20.25%.
What is the Percentage of Immigrants from Caribbean in the State of South Carolina?
Percentage of Immigrants from Caribbean in South Carolina is 0.33%.
What is the Percentage of Immigrants from Caribbean in the United States?
Percentage of Immigrants from Caribbean in the United States is 1.37%.