Blackville, SC Map & Demographics
Blackville Map
Blackville Overview
$24,872
PER CAPITA INCOME
$49,063
AVG FAMILY INCOME
$26,667
AVG HOUSEHOLD INCOME
44.9%
WAGE / INCOME GAP [ % ]
55.1¢/ $1
WAGE / INCOME GAP [ $ ]
0.53
INEQUALITY / GINI INDEX
2,034
TOTAL POPULATION
1,047
MALE POPULATION
987
FEMALE POPULATION
106.08
MALES / 100 FEMALES
94.27
FEMALES / 100 MALES
41.3
MEDIAN AGE
3.6
AVG FAMILY SIZE
2.7
AVG HOUSEHOLD SIZE
968
LABOR FORCE [ PEOPLE ]
57.3%
PERCENT IN LABOR FORCE
3.5%
UNEMPLOYMENT RATE
Blackville Zip Codes
Blackville Area Codes
Income in Blackville
Income Overview in Blackville
Per Capita Income in Blackville is $24,872, while median incomes of families and households are $49,063 and $26,667 respectively.
| Characteristic | Number | Measure |
| Per Capita Income | 2,034 | $24,872 |
| Median Family Income | 401 | $49,063 |
| Mean Family Income | 401 | $67,109 |
| Median Household Income | 752 | $26,667 |
| Mean Household Income | 752 | $55,872 |
| Income Deficit | 401 | $0 |
| Wage / Income Gap (%) | 2,034 | 44.93% |
| Wage / Income Gap ($) | 2,034 | 55.07¢ per $1 |
| Gini / Inequality Index | 2,034 | 0.53 |
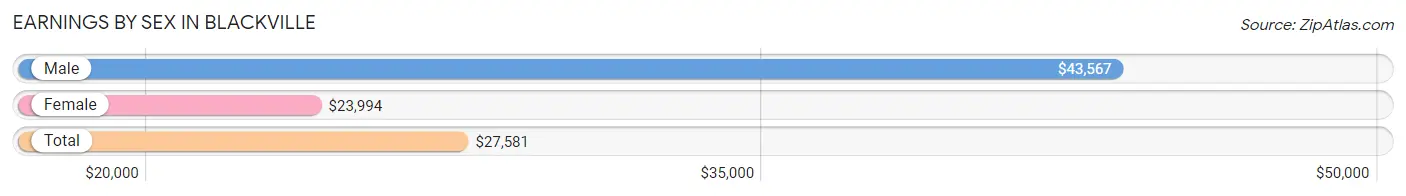
Earnings by Sex in Blackville
Average Earnings in Blackville are $27,581, $43,567 for men and $23,994 for women, a difference of 44.9%.
| Sex | Number | Average Earnings |
| Male | 503 (52.2%) | $43,567 |
| Female | 461 (47.8%) | $23,994 |
| Total | 964 (100.0%) | $27,581 |
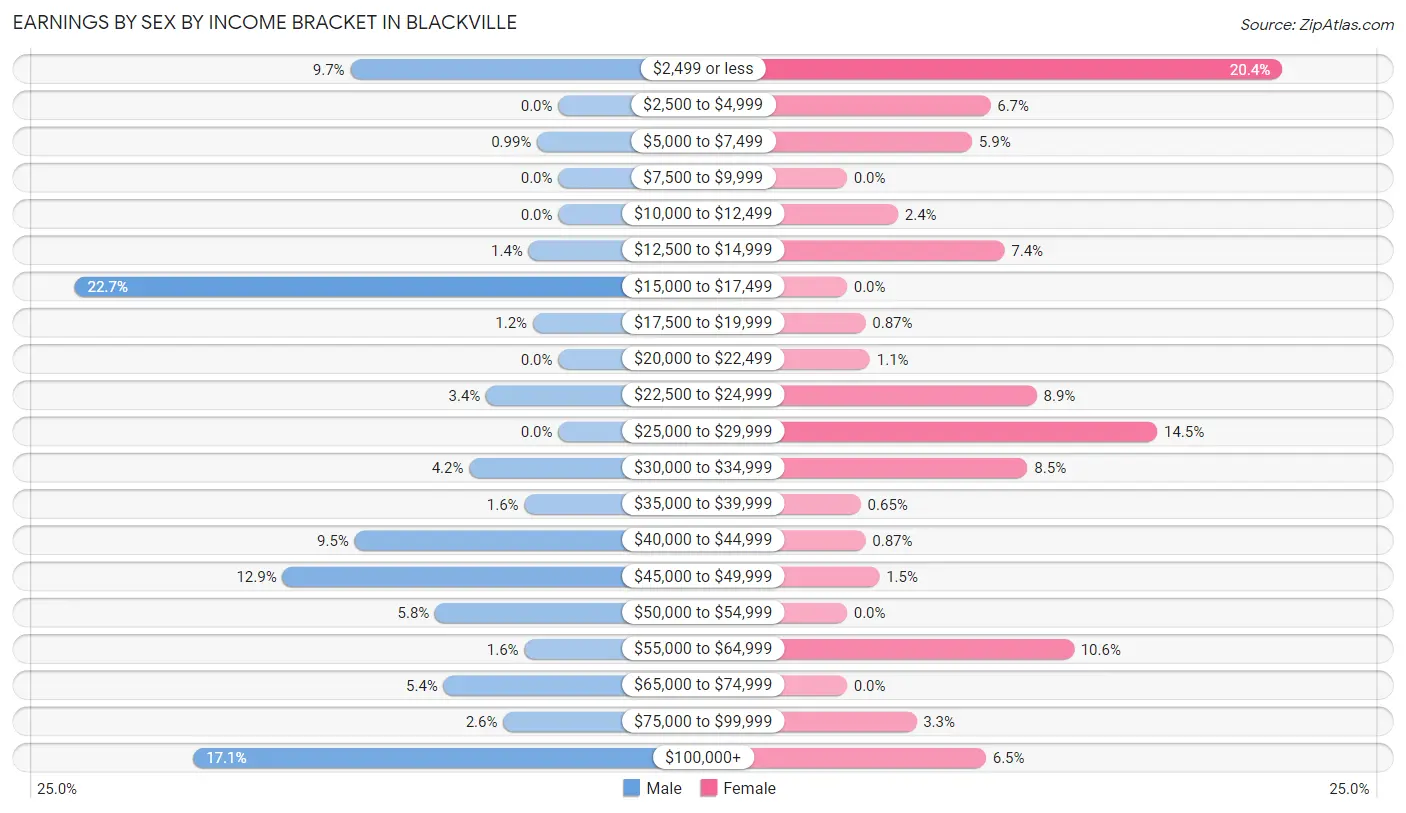
Earnings by Sex by Income Bracket in Blackville
The most common earnings brackets in Blackville are $15,000 to $17,499 for men (114 | 22.7%) and $2,499 or less for women (94 | 20.4%).
| Income | Male | Female |
| $2,499 or less | 49 (9.7%) | 94 (20.4%) |
| $2,500 to $4,999 | 0 (0.0%) | 31 (6.7%) |
| $5,000 to $7,499 | 5 (1.0%) | 27 (5.9%) |
| $7,500 to $9,999 | 0 (0.0%) | 0 (0.0%) |
| $10,000 to $12,499 | 0 (0.0%) | 11 (2.4%) |
| $12,500 to $14,999 | 7 (1.4%) | 34 (7.4%) |
| $15,000 to $17,499 | 114 (22.7%) | 0 (0.0%) |
| $17,500 to $19,999 | 6 (1.2%) | 4 (0.9%) |
| $20,000 to $22,499 | 0 (0.0%) | 5 (1.1%) |
| $22,500 to $24,999 | 17 (3.4%) | 41 (8.9%) |
| $25,000 to $29,999 | 0 (0.0%) | 67 (14.5%) |
| $30,000 to $34,999 | 21 (4.2%) | 39 (8.5%) |
| $35,000 to $39,999 | 8 (1.6%) | 3 (0.6%) |
| $40,000 to $44,999 | 48 (9.5%) | 4 (0.9%) |
| $45,000 to $49,999 | 65 (12.9%) | 7 (1.5%) |
| $50,000 to $54,999 | 29 (5.8%) | 0 (0.0%) |
| $55,000 to $64,999 | 8 (1.6%) | 49 (10.6%) |
| $65,000 to $74,999 | 27 (5.4%) | 0 (0.0%) |
| $75,000 to $99,999 | 13 (2.6%) | 15 (3.3%) |
| $100,000+ | 86 (17.1%) | 30 (6.5%) |
| Total | 503 (100.0%) | 461 (100.0%) |
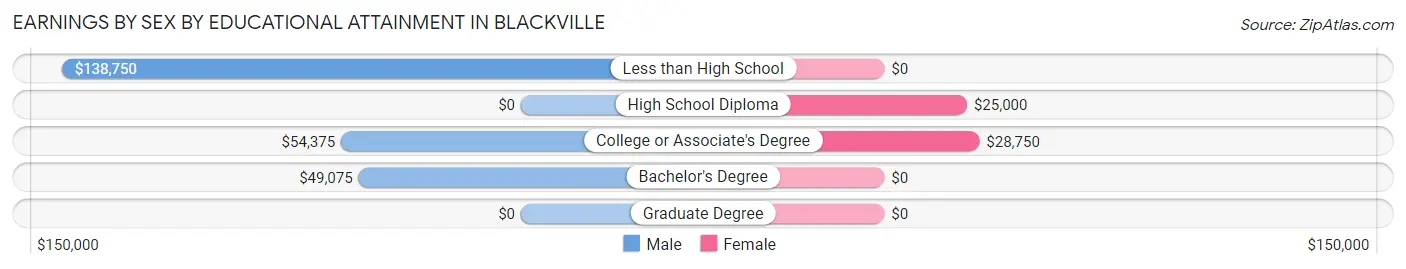
Earnings by Sex by Educational Attainment in Blackville
Average earnings in Blackville are $44,878 for men and $25,868 for women, a difference of 42.4%. Men with an educational attainment of less than high school enjoy the highest average annual earnings of $138,750, while those with bachelor's degree education earn the least with $49,075. Women with an educational attainment of college or associate's degree earn the most with the average annual earnings of $28,750, while those with high school diploma education have the smallest earnings of $25,000.
| Educational Attainment | Male Income | Female Income |
| Less than High School | $138,750 | $0 |
| High School Diploma | - | - |
| College or Associate's Degree | $54,375 | $28,750 |
| Bachelor's Degree | $49,075 | $0 |
| Graduate Degree | - | - |
| Total | $44,878 | $25,868 |
Family Income in Blackville
Family Income Brackets in Blackville
According to the Blackville family income data, there are 78 families falling into the $50,000 to $74,999 income range, which is the most common income bracket and makes up 19.5% of all families. Conversely, the $150,000 to $199,999 income bracket is the least frequent group with only 4 families (1.0%) belonging to this category.
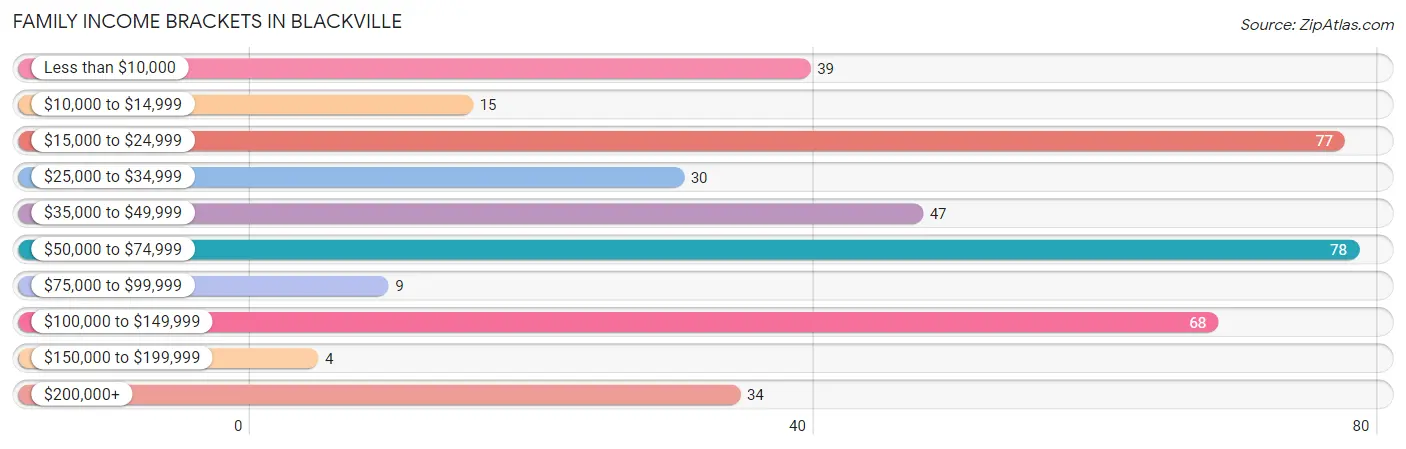
| Income Bracket | # Families | % Families |
| Less than $10,000 | 39 | 9.7% |
| $10,000 to $14,999 | 15 | 3.7% |
| $15,000 to $24,999 | 77 | 19.2% |
| $25,000 to $34,999 | 30 | 7.5% |
| $35,000 to $49,999 | 47 | 11.7% |
| $50,000 to $74,999 | 78 | 19.5% |
| $75,000 to $99,999 | 9 | 2.2% |
| $100,000 to $149,999 | 68 | 17.0% |
| $150,000 to $199,999 | 4 | 1.0% |
| $200,000+ | 34 | 8.5% |
Family Income by Famaliy Size in Blackville
2-person families (152 | 37.9%) account for the highest median family income in Blackville with $39,700 per family, while 2-person families (152 | 37.9%) have the highest median income of $19,850 per family member.
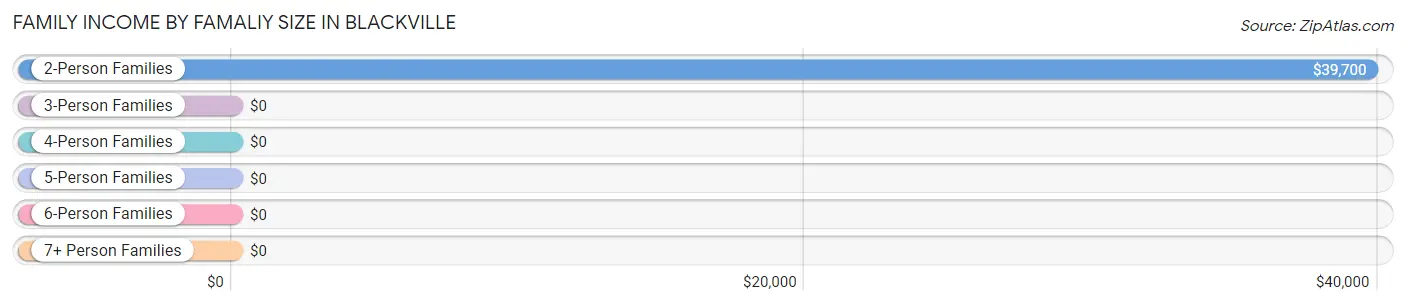
| Income Bracket | # Families | Median Income |
| 2-Person Families | 152 (37.9%) | $39,700 |
| 3-Person Families | 172 (42.9%) | $0 |
| 4-Person Families | 52 (13.0%) | $0 |
| 5-Person Families | 6 (1.5%) | $0 |
| 6-Person Families | 19 (4.7%) | $0 |
| 7+ Person Families | 0 (0.0%) | $0 |
| Total | 401 (100.0%) | $49,063 |
Family Income by Number of Earners in Blackville
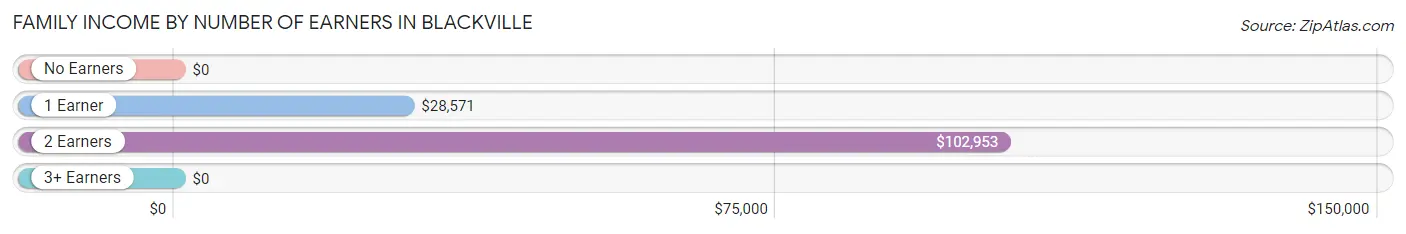
| Number of Earners | # Families | Median Income |
| No Earners | 53 (13.2%) | $0 |
| 1 Earner | 170 (42.4%) | $28,571 |
| 2 Earners | 167 (41.6%) | $102,953 |
| 3+ Earners | 11 (2.7%) | $0 |
| Total | 401 (100.0%) | $49,063 |
Household Income in Blackville
Household Income Brackets in Blackville
With 240 households falling in the category, the $15,000 to $24,999 income range is the most frequent in Blackville, accounting for 31.9% of all households. In contrast, only 27 households (3.6%) fall into the $75,000 to $99,999 income bracket, making it the least populous group.
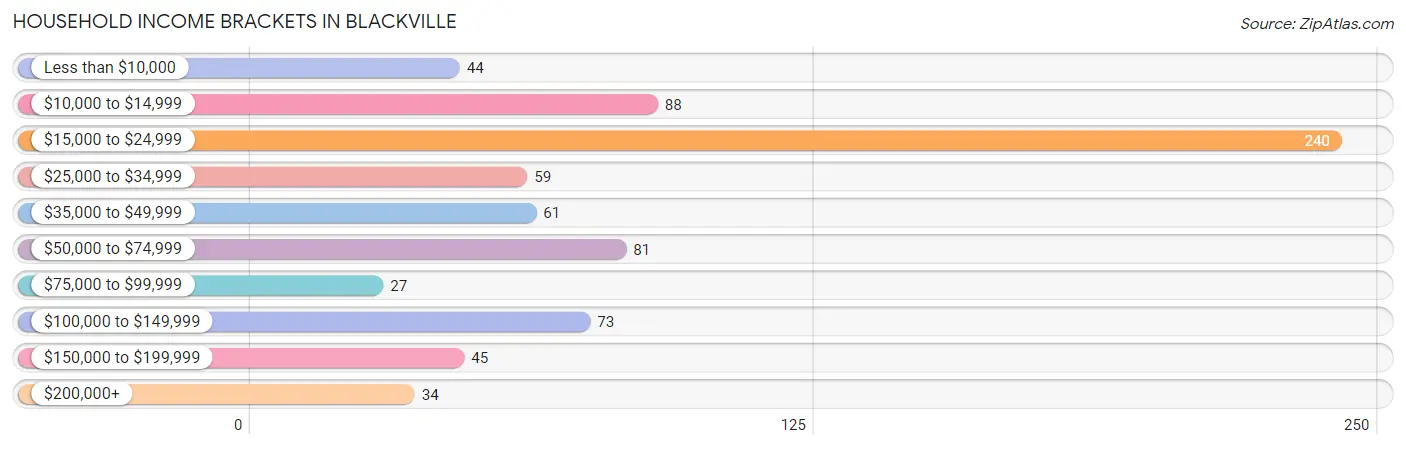
| Income Bracket | # Households | % Households |
| Less than $10,000 | 44 | 5.9% |
| $10,000 to $14,999 | 88 | 11.7% |
| $15,000 to $24,999 | 240 | 31.9% |
| $25,000 to $34,999 | 59 | 7.8% |
| $35,000 to $49,999 | 61 | 8.1% |
| $50,000 to $74,999 | 81 | 10.8% |
| $75,000 to $99,999 | 27 | 3.6% |
| $100,000 to $149,999 | 73 | 9.7% |
| $150,000 to $199,999 | 45 | 6.0% |
| $200,000+ | 34 | 4.5% |
Household Income by Householder Age in Blackville
The median household income in Blackville is $26,667, with the highest median household income of $103,534 found in the 25 to 44 years age bracket for the primary householder. A total of 176 households (23.4%) fall into this category. Meanwhile, the 15 to 24 years age bracket for the primary householder has the lowest median household income of $0, with 18 households (2.4%) in this group.
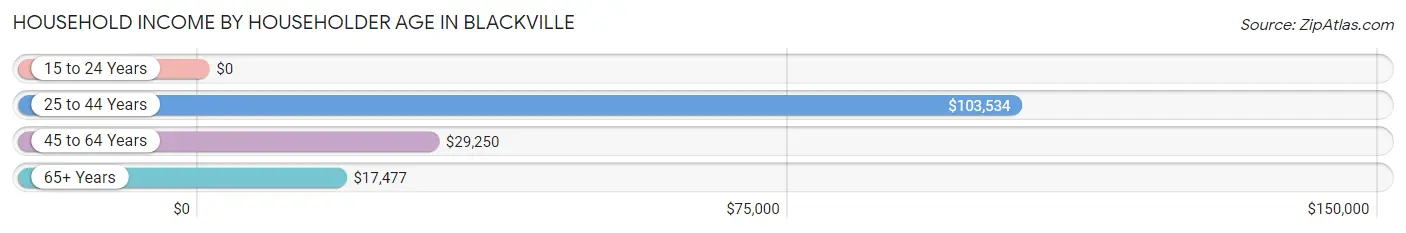
| Income Bracket | # Households | Median Income |
| 15 to 24 Years | 18 (2.4%) | $0 |
| 25 to 44 Years | 176 (23.4%) | $103,534 |
| 45 to 64 Years | 226 (30.0%) | $29,250 |
| 65+ Years | 332 (44.2%) | $17,477 |
| Total | 752 (100.0%) | $26,667 |
Poverty in Blackville
Income Below Poverty by Sex and Age in Blackville
With 19.5% poverty level for males and 37.2% for females among the residents of Blackville, 16 and 17 year old males and 6 to 11 year old females are the most vulnerable to poverty, with 8 males (61.5%) and 35 females (100.0%) in their respective age groups living below the poverty level.
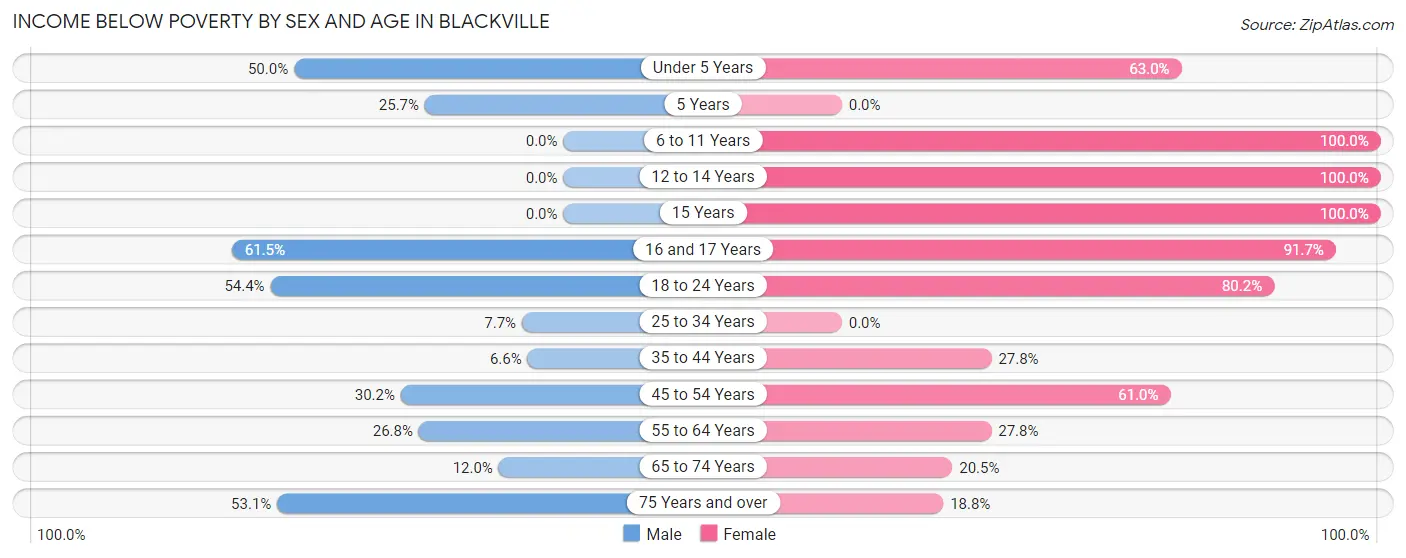
| Age Bracket | Male | Female |
| Under 5 Years | 11 (50.0%) | 29 (63.0%) |
| 5 Years | 18 (25.7%) | 0 (0.0%) |
| 6 to 11 Years | 0 (0.0%) | 35 (100.0%) |
| 12 to 14 Years | 0 (0.0%) | 26 (100.0%) |
| 15 Years | 0 (0.0%) | 14 (100.0%) |
| 16 and 17 Years | 8 (61.5%) | 22 (91.7%) |
| 18 to 24 Years | 56 (54.4%) | 77 (80.2%) |
| 25 to 34 Years | 11 (7.7%) | 0 (0.0%) |
| 35 to 44 Years | 17 (6.6%) | 35 (27.8%) |
| 45 to 54 Years | 35 (30.2%) | 25 (61.0%) |
| 55 to 64 Years | 22 (26.8%) | 48 (27.8%) |
| 65 to 74 Years | 9 (12.0%) | 24 (20.5%) |
| 75 Years and over | 17 (53.1%) | 32 (18.8%) |
| Total | 204 (19.5%) | 367 (37.2%) |
Income Above Poverty by Sex and Age in Blackville
According to the poverty statistics in Blackville, males aged 6 to 11 years and females aged 25 to 34 years are the age groups that are most secure financially, with 100.0% of males and 100.0% of females in these age groups living above the poverty line.
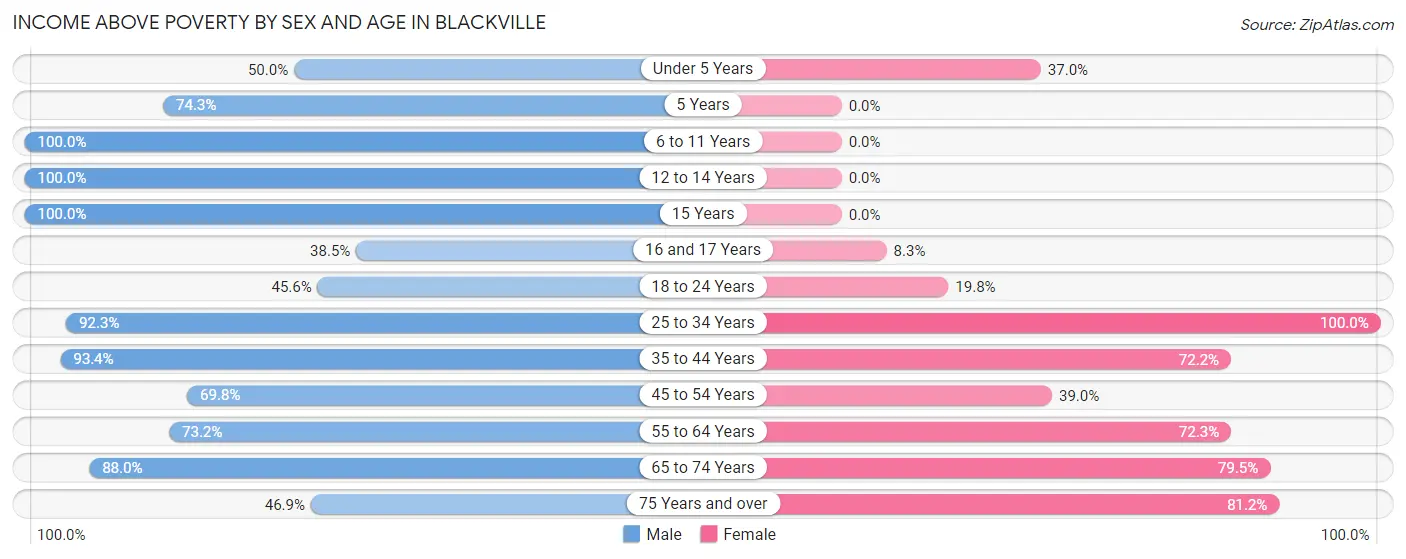
| Age Bracket | Male | Female |
| Under 5 Years | 11 (50.0%) | 17 (37.0%) |
| 5 Years | 52 (74.3%) | 0 (0.0%) |
| 6 to 11 Years | 34 (100.0%) | 0 (0.0%) |
| 12 to 14 Years | 77 (100.0%) | 0 (0.0%) |
| 15 Years | 21 (100.0%) | 0 (0.0%) |
| 16 and 17 Years | 5 (38.5%) | 2 (8.3%) |
| 18 to 24 Years | 47 (45.6%) | 19 (19.8%) |
| 25 to 34 Years | 132 (92.3%) | 119 (100.0%) |
| 35 to 44 Years | 239 (93.4%) | 91 (72.2%) |
| 45 to 54 Years | 81 (69.8%) | 16 (39.0%) |
| 55 to 64 Years | 60 (73.2%) | 125 (72.3%) |
| 65 to 74 Years | 66 (88.0%) | 93 (79.5%) |
| 75 Years and over | 15 (46.9%) | 138 (81.2%) |
| Total | 840 (80.5%) | 620 (62.8%) |
Income Below Poverty Among Married-Couple Families in Blackville
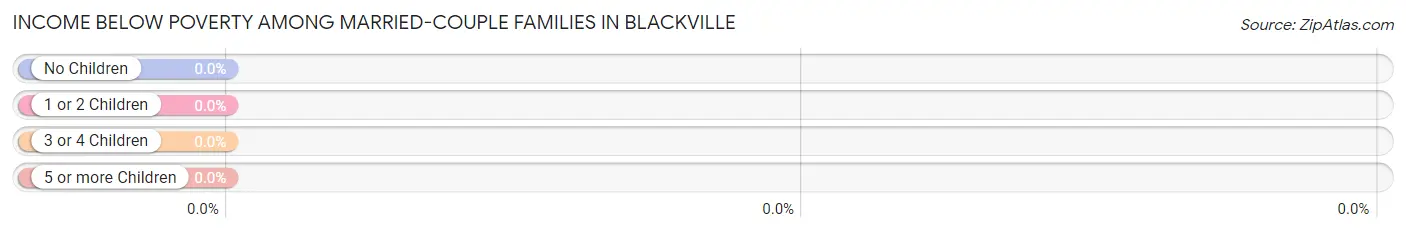
| Children | Above Poverty | Below Poverty |
| No Children | 81 (100.0%) | 0 (0.0%) |
| 1 or 2 Children | 97 (100.0%) | 0 (0.0%) |
| 3 or 4 Children | 0 (0.0%) | 0 (0.0%) |
| 5 or more Children | 0 (0.0%) | 0 (0.0%) |
| Total | 178 (100.0%) | 0 (0.0%) |
Income Below Poverty Among Single-Parent Households in Blackville
According to the poverty data in Blackville, 9.6% or 5 single-father households and 60.8% or 104 single-mother households are living below the poverty line. Among single-father households, those with no children have the highest poverty rate, with 5 households (9.6%) experiencing poverty. Likewise, among single-mother households, those with 3 or 4 children have the highest poverty rate, with 16 households (100.0%) falling below the poverty line.
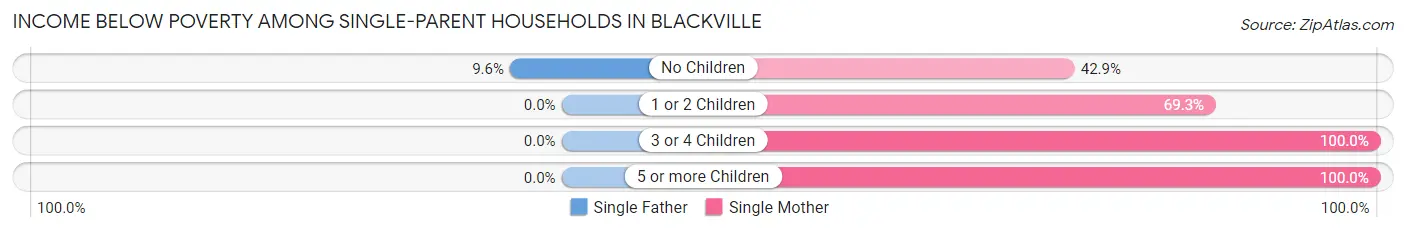
| Children | Single Father | Single Mother |
| No Children | 5 (9.6%) | 33 (42.9%) |
| 1 or 2 Children | 0 (0.0%) | 52 (69.3%) |
| 3 or 4 Children | 0 (0.0%) | 16 (100.0%) |
| 5 or more Children | 0 (0.0%) | 3 (100.0%) |
| Total | 5 (9.6%) | 104 (60.8%) |
Income Below Poverty Among Married-Couple vs Single-Parent Households in Blackville
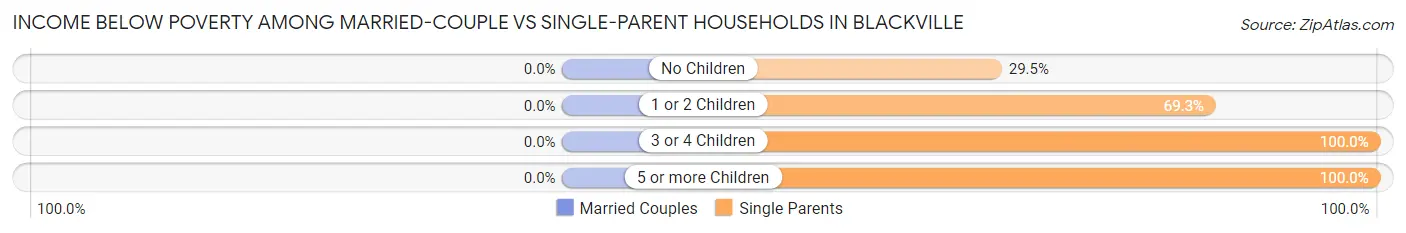
| Children | Married-Couple Families | Single-Parent Households |
| No Children | 0 (0.0%) | 38 (29.5%) |
| 1 or 2 Children | 0 (0.0%) | 52 (69.3%) |
| 3 or 4 Children | 0 (0.0%) | 16 (100.0%) |
| 5 or more Children | 0 (0.0%) | 3 (100.0%) |
| Total | 0 (0.0%) | 109 (48.9%) |
Race in Blackville
The most populous races in Blackville are Black / African American (1,705 | 83.8%), White / Caucasian (223 | 11.0%), and Hispanic or Latino (100 | 4.9%).
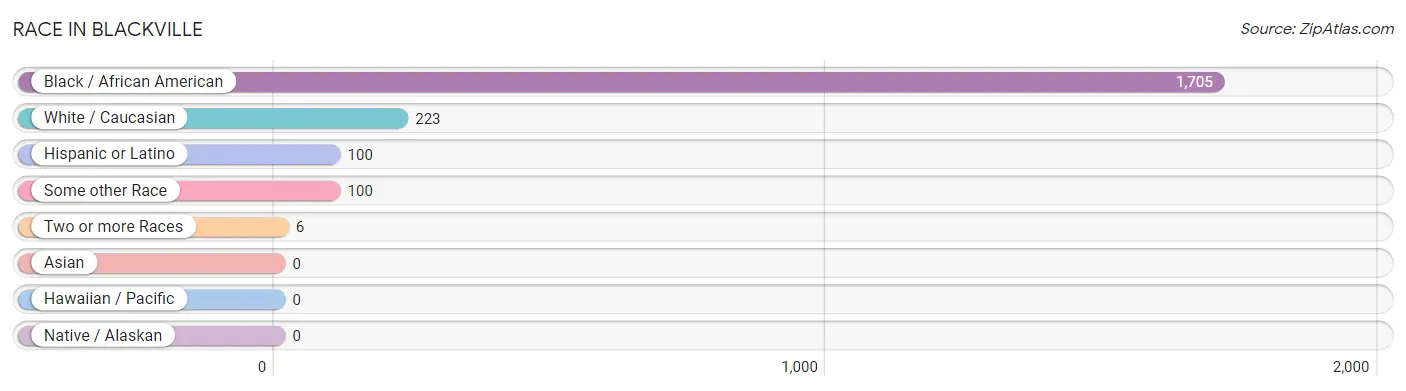
| Race | # Population | % Population |
| Asian | 0 | 0.0% |
| Black / African American | 1,705 | 83.8% |
| Hawaiian / Pacific | 0 | 0.0% |
| Hispanic or Latino | 100 | 4.9% |
| Native / Alaskan | 0 | 0.0% |
| White / Caucasian | 223 | 11.0% |
| Two or more Races | 6 | 0.3% |
| Some other Race | 100 | 4.9% |
| Total | 2,034 | 100.0% |
Ancestry in Blackville
The most populous ancestries reported in Blackville are American (103 | 5.1%), Puerto Rican (100 | 4.9%), African (45 | 2.2%), Subsaharan African (45 | 2.2%), and German (15 | 0.7%), together accounting for 15.1% of all Blackville residents.
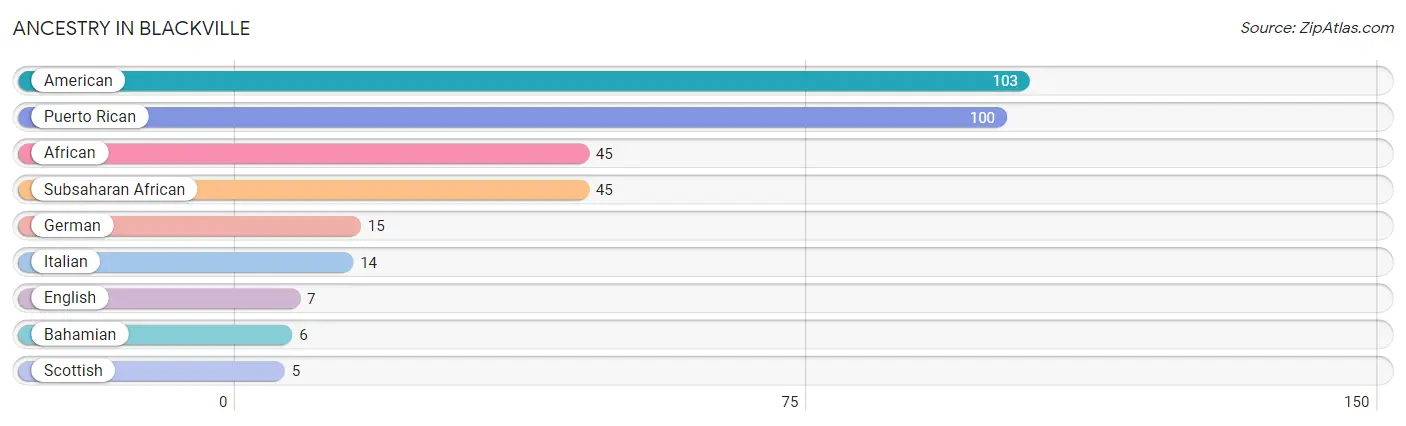
| Ancestry | # Population | % Population |
| African | 45 | 2.2% |
| American | 103 | 5.1% |
| Bahamian | 6 | 0.3% |
| English | 7 | 0.3% |
| German | 15 | 0.7% |
| Italian | 14 | 0.7% |
| Puerto Rican | 100 | 4.9% |
| Scottish | 5 | 0.3% |
| Subsaharan African | 45 | 2.2% | View All 9 Rows |
Immigrants in Blackville
The most numerous immigrant groups reported in Blackville came from Caribbean (6 | 0.3%), Latin America (6 | 0.3%), and Trinidad and Tobago (6 | 0.3%), together accounting for 0.9% of all Blackville residents.
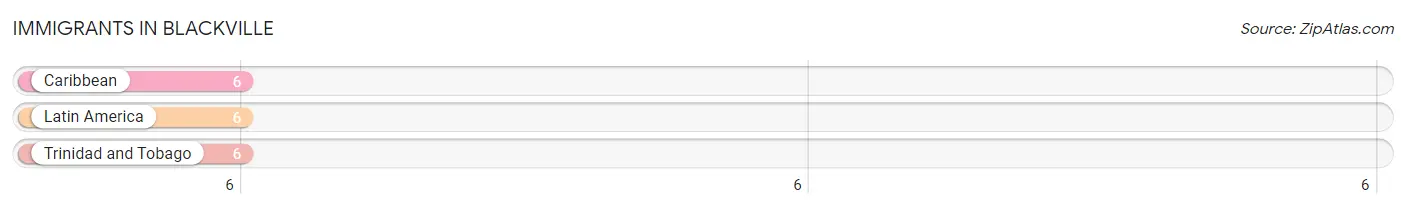
| Immigration Origin | # Population | % Population |
| Caribbean | 6 | 0.3% |
| Latin America | 6 | 0.3% |
| Trinidad and Tobago | 6 | 0.3% | View All 3 Rows |
Sex and Age in Blackville
Sex and Age in Blackville
The most populous age groups in Blackville are 40 to 44 Years (185 | 17.7%) for men and 75 to 79 Years (130 | 13.2%) for women.
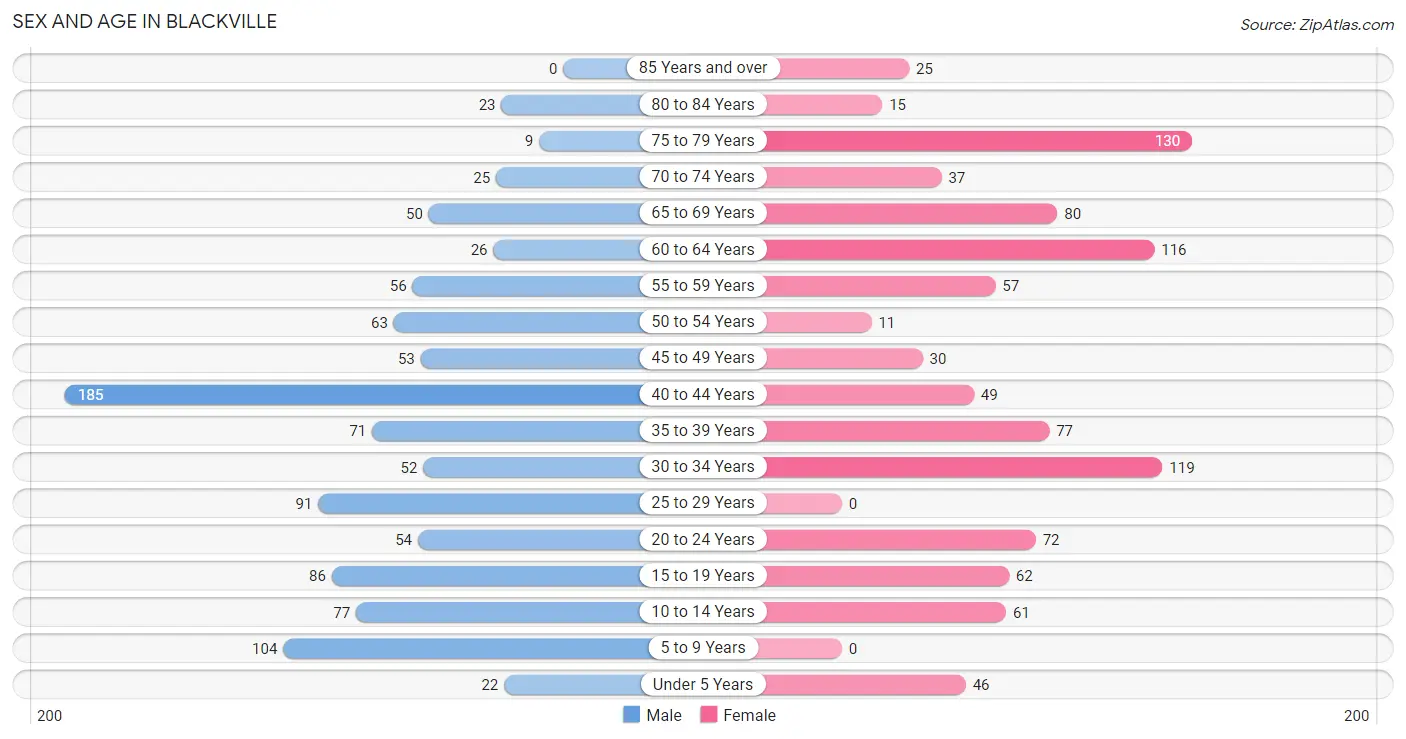
| Age Bracket | Male | Female |
| Under 5 Years | 22 (2.1%) | 46 (4.7%) |
| 5 to 9 Years | 104 (9.9%) | 0 (0.0%) |
| 10 to 14 Years | 77 (7.3%) | 61 (6.2%) |
| 15 to 19 Years | 86 (8.2%) | 62 (6.3%) |
| 20 to 24 Years | 54 (5.2%) | 72 (7.3%) |
| 25 to 29 Years | 91 (8.7%) | 0 (0.0%) |
| 30 to 34 Years | 52 (5.0%) | 119 (12.1%) |
| 35 to 39 Years | 71 (6.8%) | 77 (7.8%) |
| 40 to 44 Years | 185 (17.7%) | 49 (5.0%) |
| 45 to 49 Years | 53 (5.1%) | 30 (3.0%) |
| 50 to 54 Years | 63 (6.0%) | 11 (1.1%) |
| 55 to 59 Years | 56 (5.3%) | 57 (5.8%) |
| 60 to 64 Years | 26 (2.5%) | 116 (11.7%) |
| 65 to 69 Years | 50 (4.8%) | 80 (8.1%) |
| 70 to 74 Years | 25 (2.4%) | 37 (3.7%) |
| 75 to 79 Years | 9 (0.9%) | 130 (13.2%) |
| 80 to 84 Years | 23 (2.2%) | 15 (1.5%) |
| 85 Years and over | 0 (0.0%) | 25 (2.5%) |
| Total | 1,047 (100.0%) | 987 (100.0%) |
Families and Households in Blackville
Median Family Size in Blackville
The median family size in Blackville is 3.65 persons per family, with single female/mother families (171 | 42.6%) accounting for the largest median family size of 4.02 persons per family. On the other hand, single male/father families (52 | 13.0%) represent the smallest median family size with 2.94 persons per family.
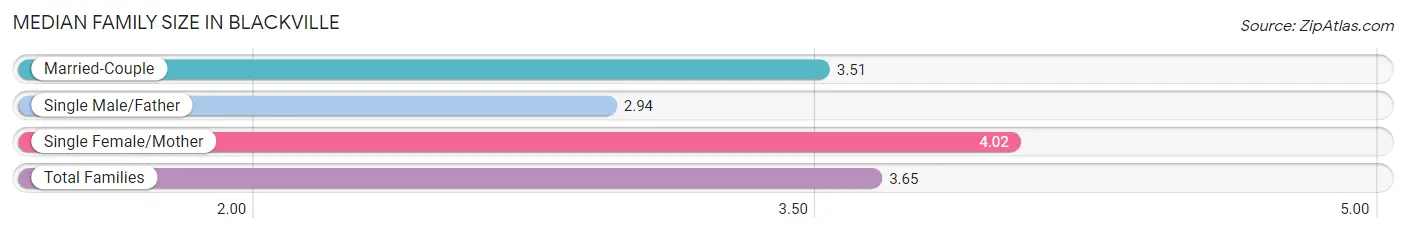
| Family Type | # Families | Family Size |
| Married-Couple | 178 (44.4%) | 3.51 |
| Single Male/Father | 52 (13.0%) | 2.94 |
| Single Female/Mother | 171 (42.6%) | 4.02 |
| Total Families | 401 (100.0%) | 3.65 |
Median Household Size in Blackville
The median household size in Blackville is 2.70 persons per household, with single female/mother households (171 | 22.7%) accounting for the largest median household size of 4.02 persons per household. non-family households (351 | 46.7%) represent the smallest median household size with 1.32 persons per household.
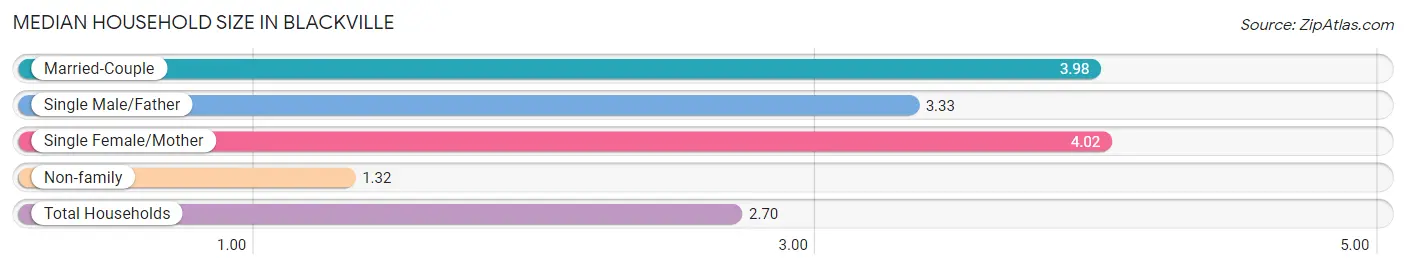
| Household Type | # Households | Household Size |
| Married-Couple | 178 (23.7%) | 3.98 |
| Single Male/Father | 52 (6.9%) | 3.33 |
| Single Female/Mother | 171 (22.7%) | 4.02 |
| Non-family | 351 (46.7%) | 1.32 |
| Total Households | 752 (100.0%) | 2.70 |
Household Size by Marriage Status in Blackville
Out of a total of 752 households in Blackville, 401 (53.3%) are family households, while 351 (46.7%) are nonfamily households. The most numerous type of family households are 3-person households, comprising 190, and the most common type of nonfamily households are 1-person households, comprising 258.
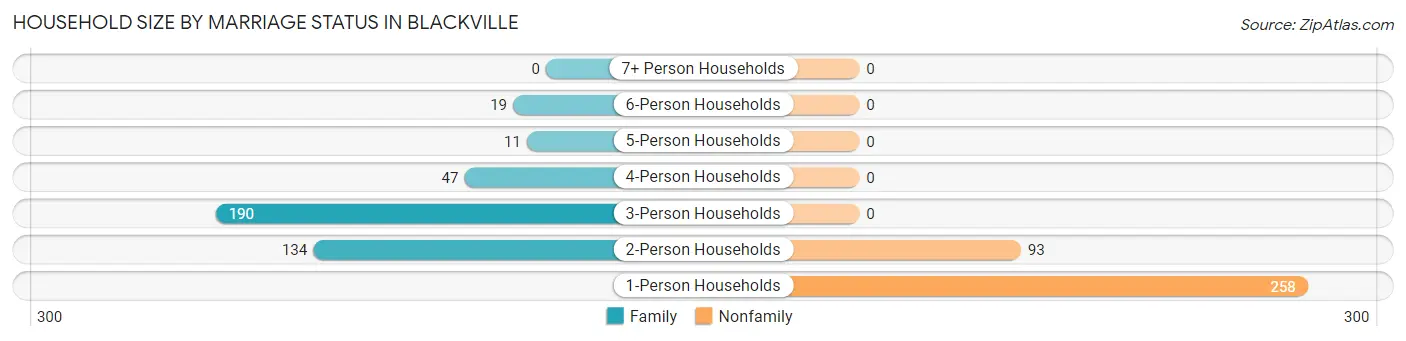
| Household Size | Family Households | Nonfamily Households |
| 1-Person Households | - | 258 (34.3%) |
| 2-Person Households | 134 (17.8%) | 93 (12.4%) |
| 3-Person Households | 190 (25.3%) | 0 (0.0%) |
| 4-Person Households | 47 (6.2%) | 0 (0.0%) |
| 5-Person Households | 11 (1.5%) | 0 (0.0%) |
| 6-Person Households | 19 (2.5%) | 0 (0.0%) |
| 7+ Person Households | 0 (0.0%) | 0 (0.0%) |
| Total | 401 (53.3%) | 351 (46.7%) |
Female Fertility in Blackville
Fertility by Age in Blackville
Average fertility rate in Blackville is 64.0 births per 1,000 women. Women in the age bracket of 35 to 50 years have the highest fertility rate with 122.0 births per 1,000 women. Women in the age bracket of 35 to 50 years acount for 73.1% of all women with births.
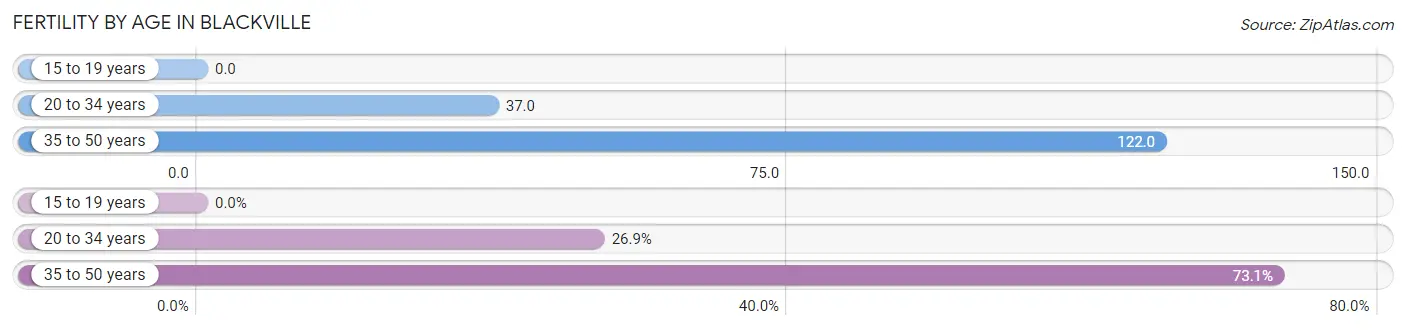
| Age Bracket | Women with Births | Births / 1,000 Women |
| 15 to 19 years | 0 (0.0%) | 0.0 |
| 20 to 34 years | 7 (26.9%) | 37.0 |
| 35 to 50 years | 19 (73.1%) | 122.0 |
| Total | 26 (100.0%) | 64.0 |
Fertility by Age by Marriage Status in Blackville
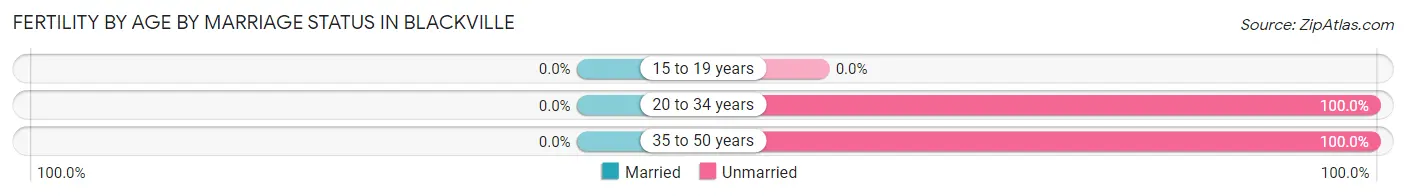
| Age Bracket | Married | Unmarried |
| 15 to 19 years | 0 (0.0%) | 0 (0.0%) |
| 20 to 34 years | 0 (0.0%) | 7 (100.0%) |
| 35 to 50 years | 0 (0.0%) | 19 (100.0%) |
| Total | 0 (0.0%) | 26 (100.0%) |
Fertility by Education in Blackville
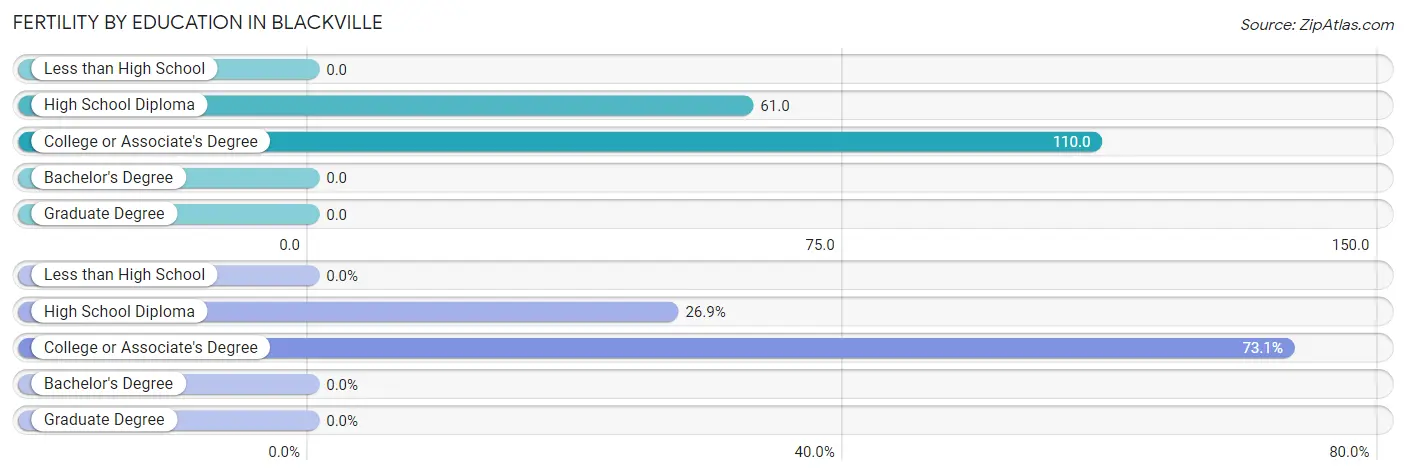
| Educational Attainment | Women with Births | Births / 1,000 Women |
| Less than High School | 0 (0.0%) | 0.0 |
| High School Diploma | 7 (26.9%) | 61.0 |
| College or Associate's Degree | 19 (73.1%) | 110.0 |
| Bachelor's Degree | 0 (0.0%) | 0.0 |
| Graduate Degree | 0 (0.0%) | 0.0 |
| Total | 26 (100.0%) | 64.0 |
Fertility by Education by Marriage Status in Blackville
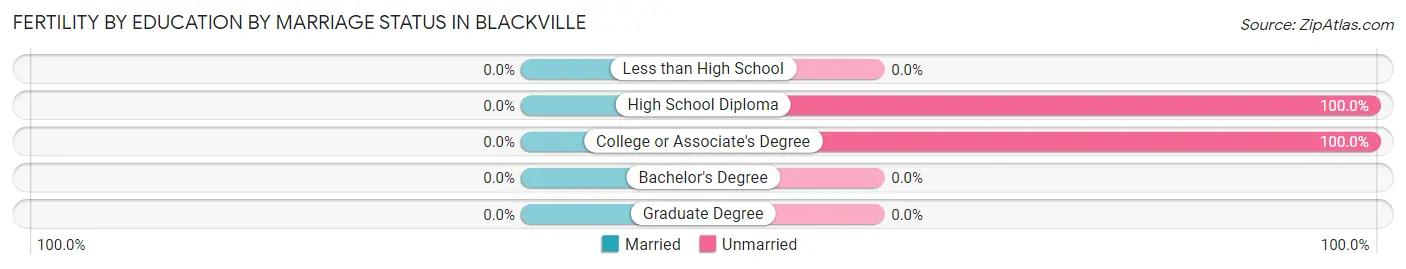
| Educational Attainment | Married | Unmarried |
| Less than High School | 0 (0.0%) | 0 (0.0%) |
| High School Diploma | 0 (0.0%) | 7 (100.0%) |
| College or Associate's Degree | 0 (0.0%) | 19 (100.0%) |
| Bachelor's Degree | 0 (0.0%) | 0 (0.0%) |
| Graduate Degree | 0 (0.0%) | 0 (0.0%) |
| Total | 0 (0.0%) | 26 (100.0%) |
Employment Characteristics in Blackville
Employment by Class of Employer in Blackville
Among the 927 employed individuals in Blackville, private company employees (733 | 79.1%), state government employees (104 | 11.2%), and not-for-profit organizations (44 | 4.8%) make up the most common classes of employment.
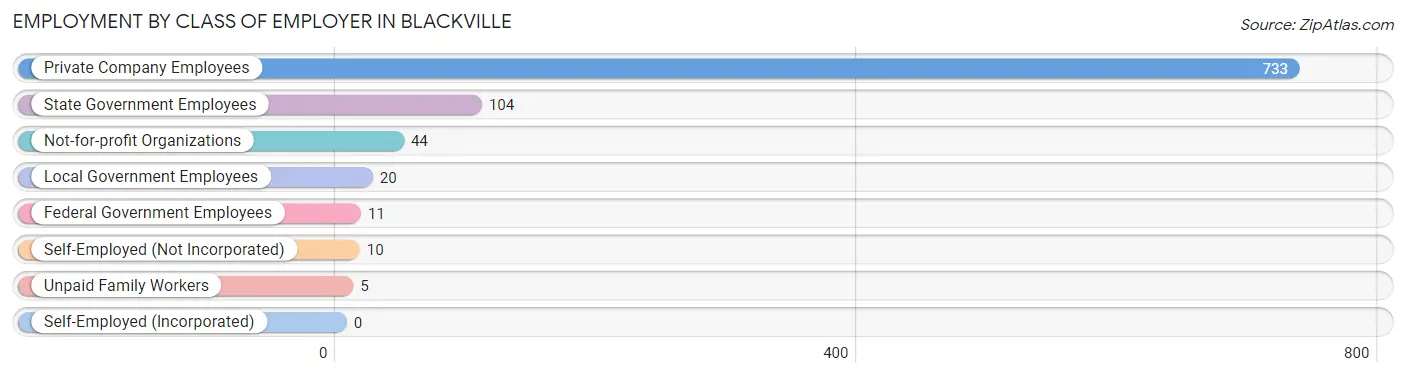
| Employer Class | # Employees | % Employees |
| Private Company Employees | 733 | 79.1% |
| Self-Employed (Incorporated) | 0 | 0.0% |
| Self-Employed (Not Incorporated) | 10 | 1.1% |
| Not-for-profit Organizations | 44 | 4.8% |
| Local Government Employees | 20 | 2.2% |
| State Government Employees | 104 | 11.2% |
| Federal Government Employees | 11 | 1.2% |
| Unpaid Family Workers | 5 | 0.5% |
| Total | 927 | 100.0% |
Employment Status by Age in Blackville
According to the labor force statistics for Blackville, out of the total population over 16 years of age (1,689), 57.3% or 968 individuals are in the labor force, with 3.5% or 34 of them unemployed. The age group with the highest labor force participation rate is 20 to 24 years, with 100.0% or 126 individuals in the labor force. Within the labor force, the 16 to 19 years age range has the highest percentage of unemployed individuals, with 44.4% or 4 of them being unemployed.
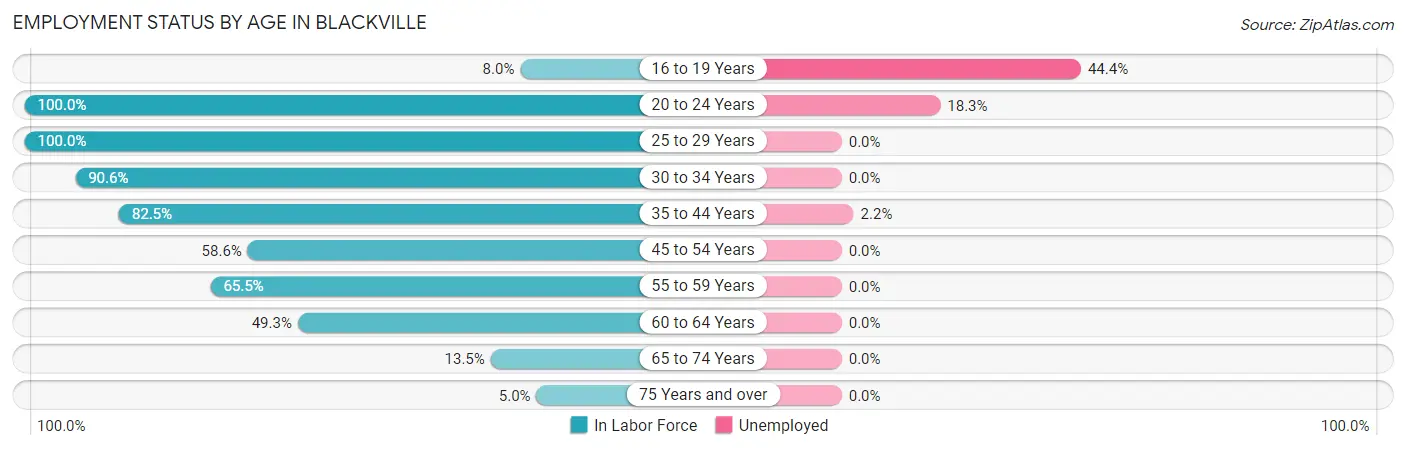
| Age Bracket | In Labor Force | Unemployed |
| 16 to 19 Years | 9 (8.0%) | 4 (44.4%) |
| 20 to 24 Years | 126 (100.0%) | 23 (18.3%) |
| 25 to 29 Years | 91 (100.0%) | 0 (0.0%) |
| 30 to 34 Years | 155 (90.6%) | 0 (0.0%) |
| 35 to 44 Years | 315 (82.5%) | 7 (2.2%) |
| 45 to 54 Years | 92 (58.6%) | 0 (0.0%) |
| 55 to 59 Years | 74 (65.5%) | 0 (0.0%) |
| 60 to 64 Years | 70 (49.3%) | 0 (0.0%) |
| 65 to 74 Years | 26 (13.5%) | 0 (0.0%) |
| 75 Years and over | 10 (5.0%) | 0 (0.0%) |
| Total | 968 (57.3%) | 34 (3.5%) |
Employment Status by Educational Attainment in Blackville
According to labor force statistics for Blackville, 75.5% of individuals (797) out of the total population between 25 and 64 years of age (1,056) are in the labor force, with 0.9% or 7 of them being unemployed. The group with the highest labor force participation rate are those with the educational attainment of bachelor's degree or higher, with 100.0% or 139 individuals in the labor force. Within the labor force, individuals with college / associate degree education have the highest percentage of unemployment, with 3.7% or 7 of them being unemployed.
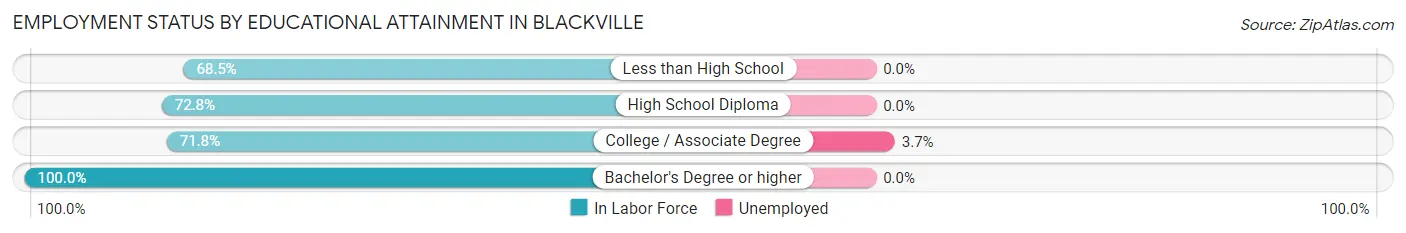
| Educational Attainment | In Labor Force | Unemployed |
| Less than High School | 111 (68.5%) | 0 (0.0%) |
| High School Diploma | 359 (72.8%) | 0 (0.0%) |
| College / Associate Degree | 188 (71.8%) | 10 (3.7%) |
| Bachelor's Degree or higher | 139 (100.0%) | 0 (0.0%) |
| Total | 797 (75.5%) | 10 (0.9%) |
Employment Occupations by Sex in Blackville
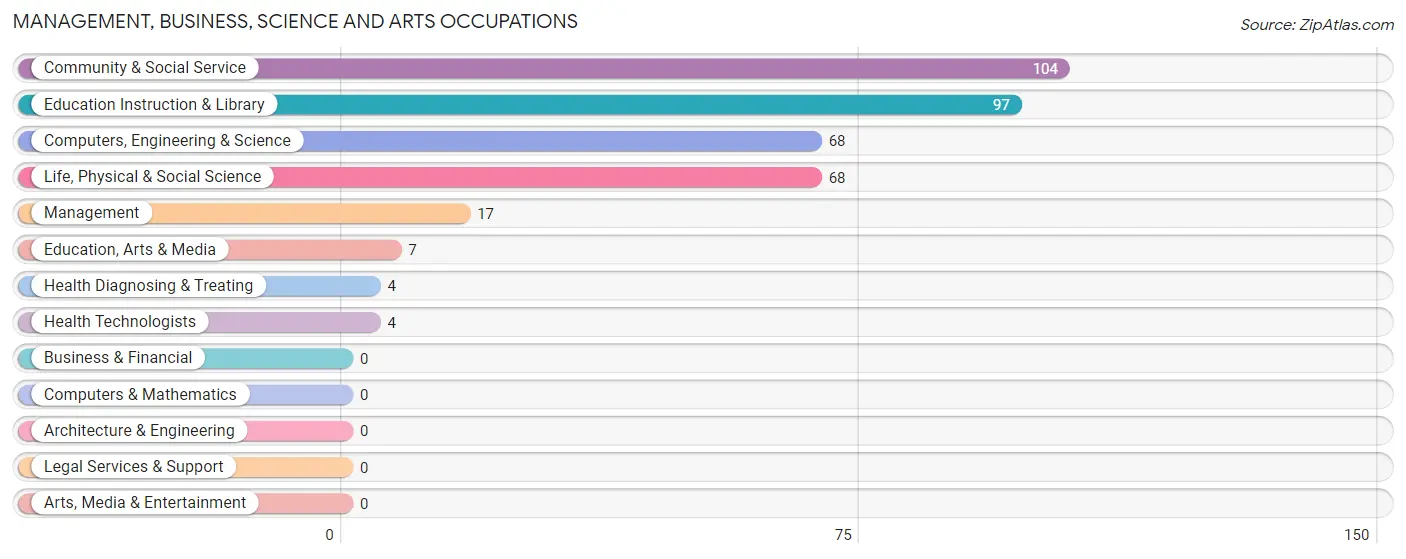
Management, Business, Science and Arts Occupations
The most common Management, Business, Science and Arts occupations in Blackville are Community & Social Service (104 | 11.1%), Education Instruction & Library (97 | 10.4%), Computers, Engineering & Science (68 | 7.3%), Life, Physical & Social Science (68 | 7.3%), and Management (17 | 1.8%).
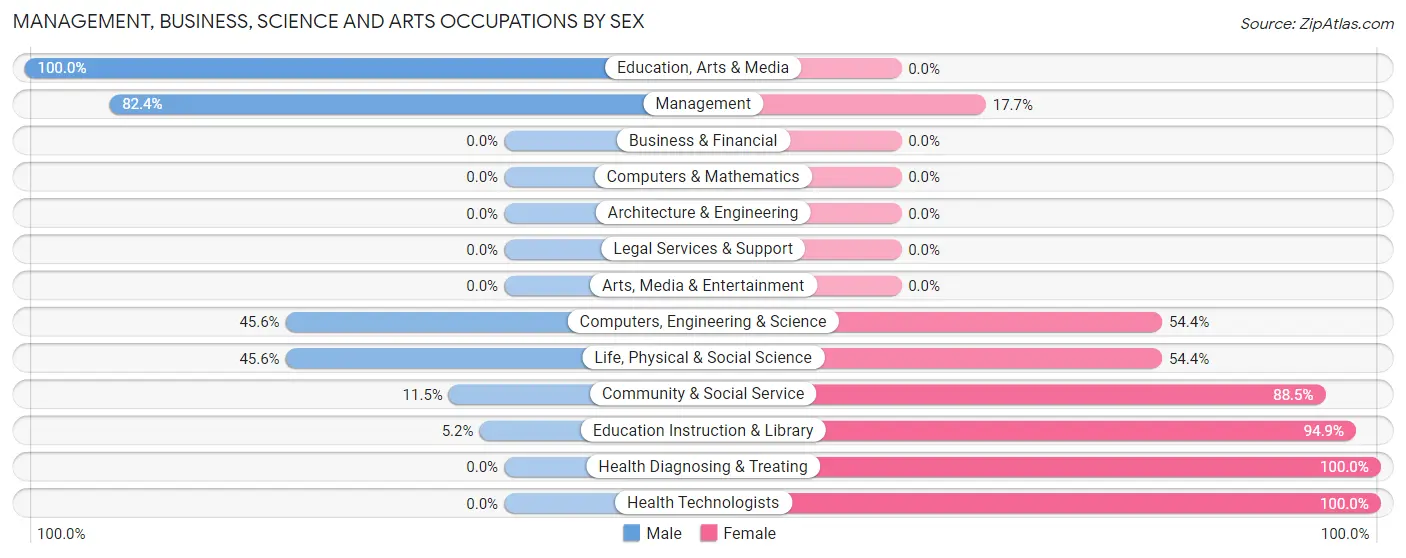
Management, Business, Science and Arts Occupations by Sex
Within the Management, Business, Science and Arts occupations in Blackville, the most male-oriented occupations are Education, Arts & Media (100.0%), Management (82.4%), and Computers, Engineering & Science (45.6%), while the most female-oriented occupations are Health Diagnosing & Treating (100.0%), Health Technologists (100.0%), and Education Instruction & Library (94.9%).
| Occupation | Male | Female |
| Management | 14 (82.4%) | 3 (17.6%) |
| Business & Financial | 0 (0.0%) | 0 (0.0%) |
| Computers, Engineering & Science | 31 (45.6%) | 37 (54.4%) |
| Computers & Mathematics | 0 (0.0%) | 0 (0.0%) |
| Architecture & Engineering | 0 (0.0%) | 0 (0.0%) |
| Life, Physical & Social Science | 31 (45.6%) | 37 (54.4%) |
| Community & Social Service | 12 (11.5%) | 92 (88.5%) |
| Education, Arts & Media | 7 (100.0%) | 0 (0.0%) |
| Legal Services & Support | 0 (0.0%) | 0 (0.0%) |
| Education Instruction & Library | 5 (5.1%) | 92 (94.9%) |
| Arts, Media & Entertainment | 0 (0.0%) | 0 (0.0%) |
| Health Diagnosing & Treating | 0 (0.0%) | 4 (100.0%) |
| Health Technologists | 0 (0.0%) | 4 (100.0%) |
| Total (Category) | 57 (29.5%) | 136 (70.5%) |
| Total (Overall) | 485 (51.9%) | 449 (48.1%) |
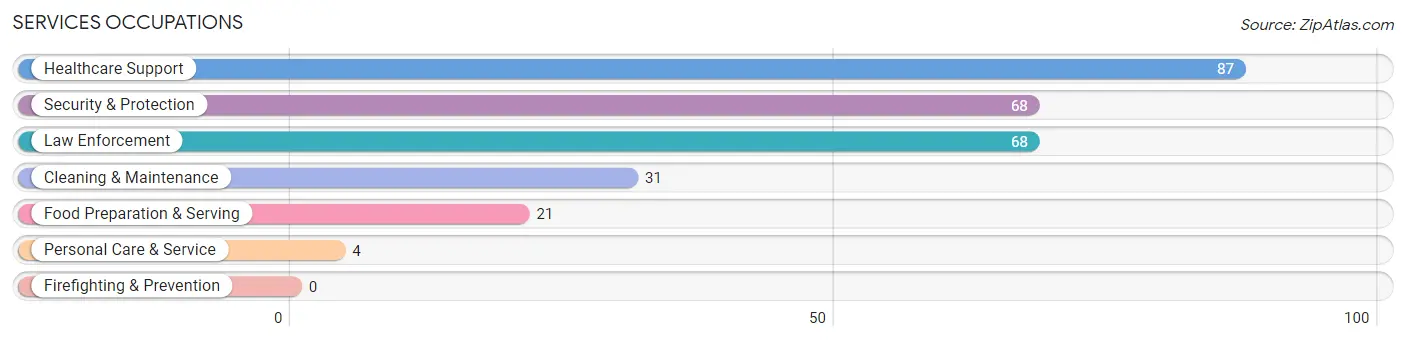
Services Occupations
The most common Services occupations in Blackville are Healthcare Support (87 | 9.3%), Security & Protection (68 | 7.3%), Law Enforcement (68 | 7.3%), Cleaning & Maintenance (31 | 3.3%), and Food Preparation & Serving (21 | 2.2%).
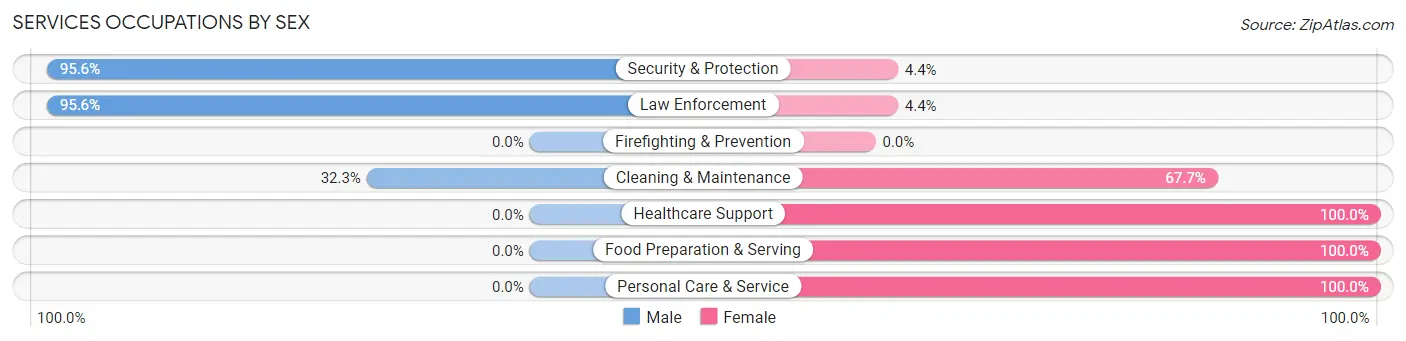
Services Occupations by Sex
Within the Services occupations in Blackville, the most male-oriented occupations are Security & Protection (95.6%), Law Enforcement (95.6%), and Cleaning & Maintenance (32.3%), while the most female-oriented occupations are Healthcare Support (100.0%), Food Preparation & Serving (100.0%), and Personal Care & Service (100.0%).
| Occupation | Male | Female |
| Healthcare Support | 0 (0.0%) | 87 (100.0%) |
| Security & Protection | 65 (95.6%) | 3 (4.4%) |
| Firefighting & Prevention | 0 (0.0%) | 0 (0.0%) |
| Law Enforcement | 65 (95.6%) | 3 (4.4%) |
| Food Preparation & Serving | 0 (0.0%) | 21 (100.0%) |
| Cleaning & Maintenance | 10 (32.3%) | 21 (67.7%) |
| Personal Care & Service | 0 (0.0%) | 4 (100.0%) |
| Total (Category) | 75 (35.5%) | 136 (64.4%) |
| Total (Overall) | 485 (51.9%) | 449 (48.1%) |
Sales and Office Occupations
The most common Sales and Office occupations in Blackville are Office & Administration (63 | 6.8%), and Sales & Related (62 | 6.6%).
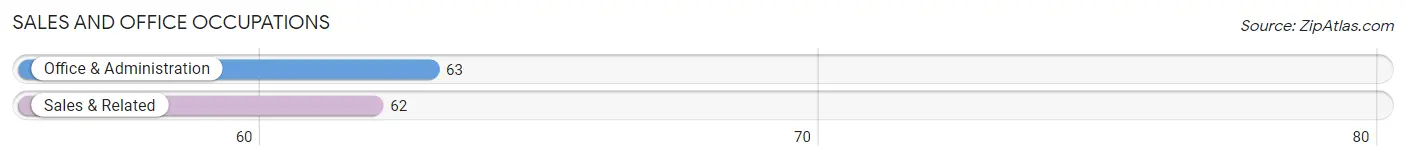
Sales and Office Occupations by Sex
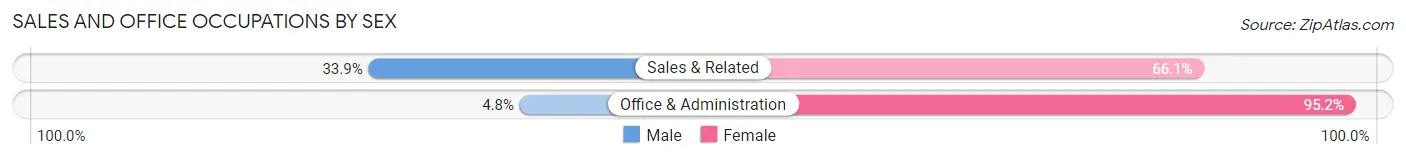
| Occupation | Male | Female |
| Sales & Related | 21 (33.9%) | 41 (66.1%) |
| Office & Administration | 3 (4.8%) | 60 (95.2%) |
| Total (Category) | 24 (19.2%) | 101 (80.8%) |
| Total (Overall) | 485 (51.9%) | 449 (48.1%) |
Natural Resources, Construction and Maintenance Occupations
The most common Natural Resources, Construction and Maintenance occupations in Blackville are Construction & Extraction (76 | 8.1%), Farming, Fishing & Forestry (17 | 1.8%), and Installation, Maintenance & Repair (8 | 0.9%).
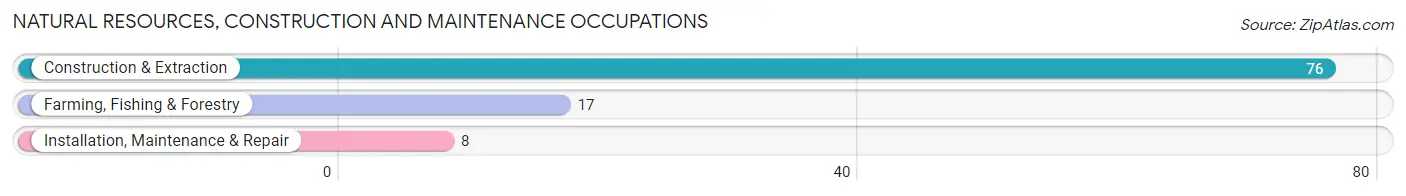
Natural Resources, Construction and Maintenance Occupations by Sex

| Occupation | Male | Female |
| Farming, Fishing & Forestry | 17 (100.0%) | 0 (0.0%) |
| Construction & Extraction | 76 (100.0%) | 0 (0.0%) |
| Installation, Maintenance & Repair | 8 (100.0%) | 0 (0.0%) |
| Total (Category) | 101 (100.0%) | 0 (0.0%) |
| Total (Overall) | 485 (51.9%) | 449 (48.1%) |
Production, Transportation and Moving Occupations
The most common Production, Transportation and Moving occupations in Blackville are Production (199 | 21.3%), Material Moving (92 | 9.9%), and Transportation (13 | 1.4%).
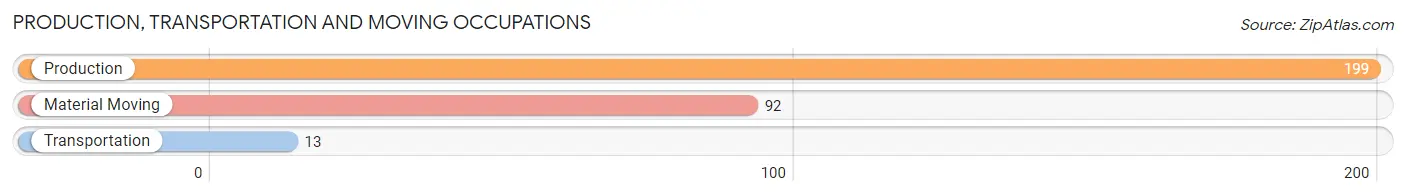
Production, Transportation and Moving Occupations by Sex
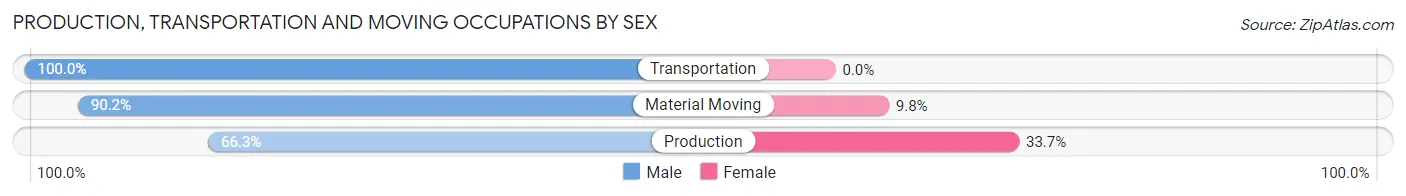
| Occupation | Male | Female |
| Production | 132 (66.3%) | 67 (33.7%) |
| Transportation | 13 (100.0%) | 0 (0.0%) |
| Material Moving | 83 (90.2%) | 9 (9.8%) |
| Total (Category) | 228 (75.0%) | 76 (25.0%) |
| Total (Overall) | 485 (51.9%) | 449 (48.1%) |
Employment Industries by Sex in Blackville
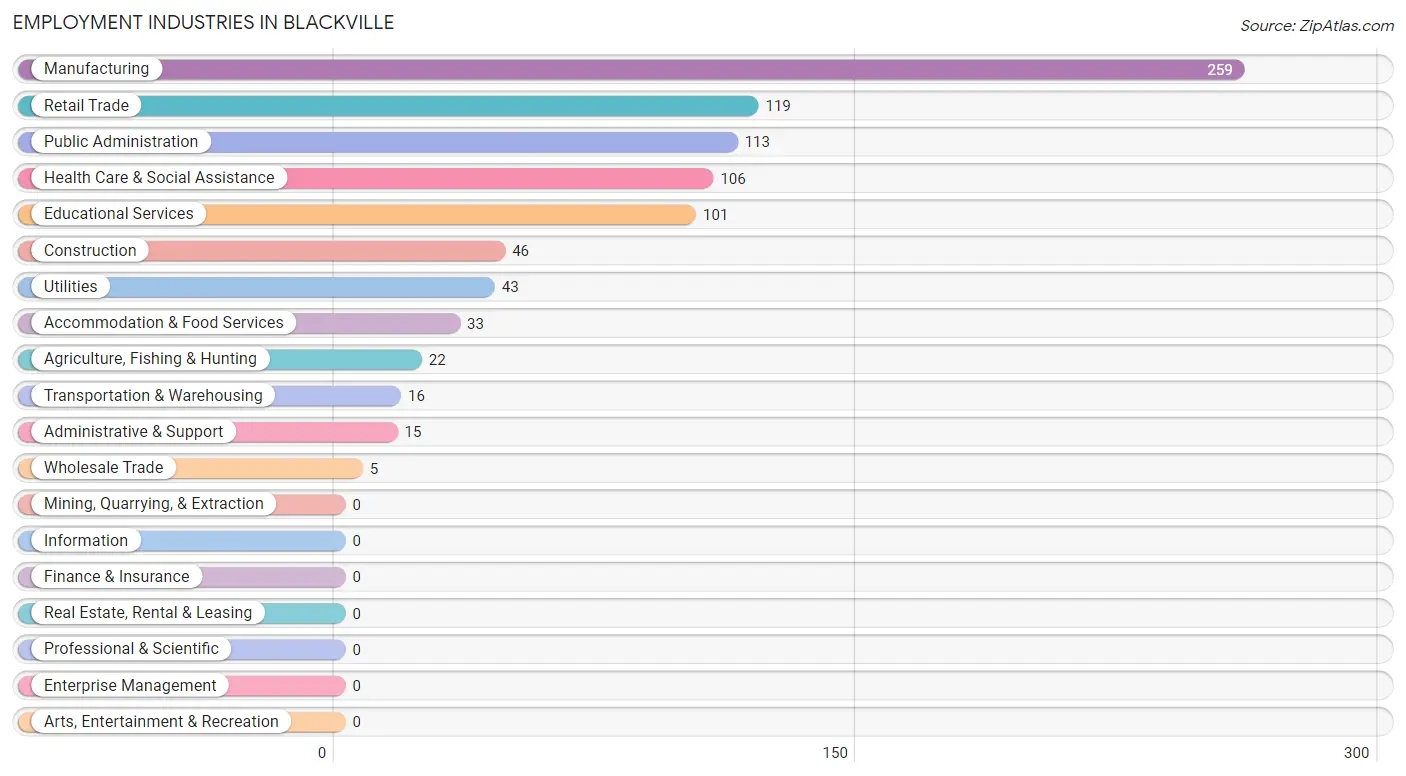
Employment Industries in Blackville
The major employment industries in Blackville include Manufacturing (259 | 27.7%), Retail Trade (119 | 12.7%), Public Administration (113 | 12.1%), Health Care & Social Assistance (106 | 11.4%), and Educational Services (101 | 10.8%).
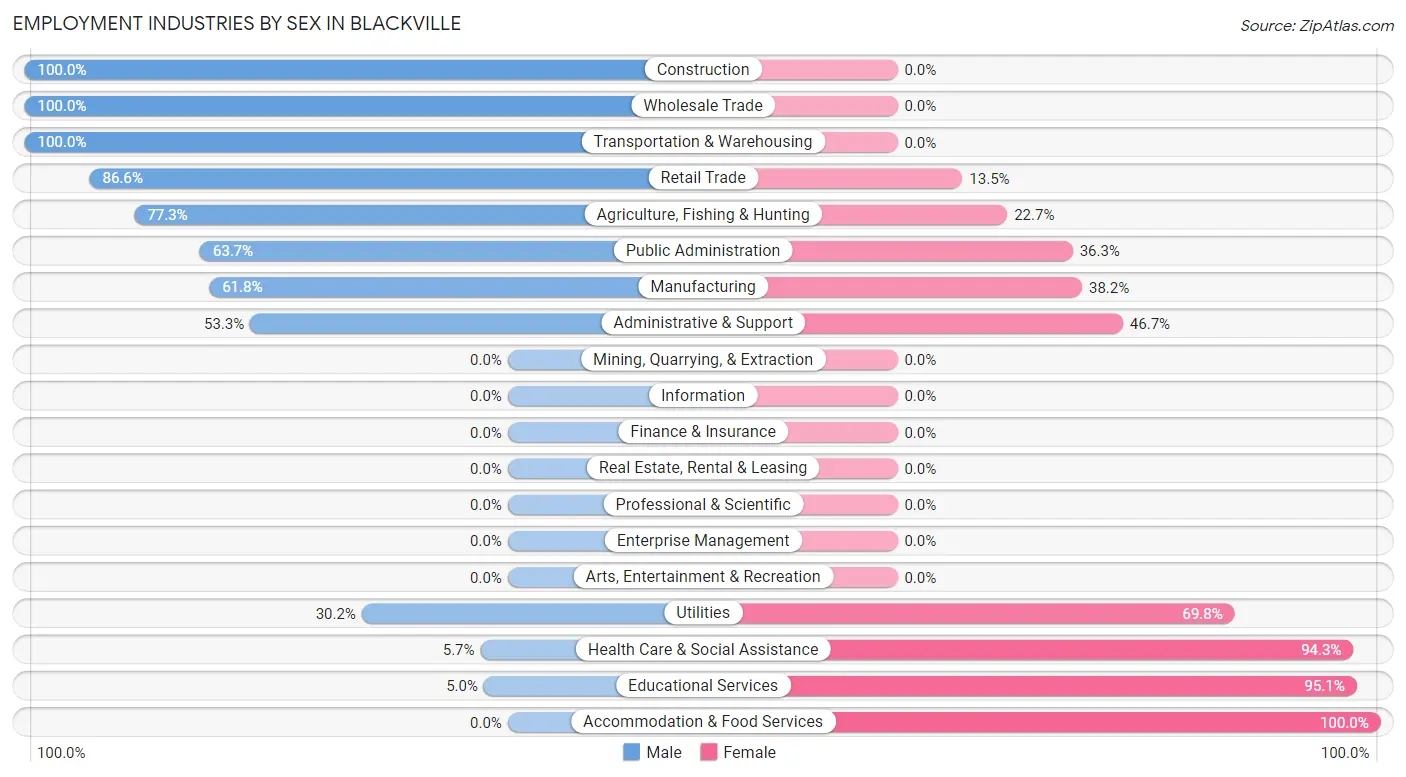
Employment Industries by Sex in Blackville
The Blackville industries that see more men than women are Construction (100.0%), Wholesale Trade (100.0%), and Transportation & Warehousing (100.0%), whereas the industries that tend to have a higher number of women are Accommodation & Food Services (100.0%), Educational Services (95.1%), and Health Care & Social Assistance (94.3%).
| Industry | Male | Female |
| Agriculture, Fishing & Hunting | 17 (77.3%) | 5 (22.7%) |
| Mining, Quarrying, & Extraction | 0 (0.0%) | 0 (0.0%) |
| Construction | 46 (100.0%) | 0 (0.0%) |
| Manufacturing | 160 (61.8%) | 99 (38.2%) |
| Wholesale Trade | 5 (100.0%) | 0 (0.0%) |
| Retail Trade | 103 (86.6%) | 16 (13.5%) |
| Transportation & Warehousing | 16 (100.0%) | 0 (0.0%) |
| Utilities | 13 (30.2%) | 30 (69.8%) |
| Information | 0 (0.0%) | 0 (0.0%) |
| Finance & Insurance | 0 (0.0%) | 0 (0.0%) |
| Real Estate, Rental & Leasing | 0 (0.0%) | 0 (0.0%) |
| Professional & Scientific | 0 (0.0%) | 0 (0.0%) |
| Enterprise Management | 0 (0.0%) | 0 (0.0%) |
| Administrative & Support | 8 (53.3%) | 7 (46.7%) |
| Educational Services | 5 (5.0%) | 96 (95.1%) |
| Health Care & Social Assistance | 6 (5.7%) | 100 (94.3%) |
| Arts, Entertainment & Recreation | 0 (0.0%) | 0 (0.0%) |
| Accommodation & Food Services | 0 (0.0%) | 33 (100.0%) |
| Public Administration | 72 (63.7%) | 41 (36.3%) |
| Total | 485 (51.9%) | 449 (48.1%) |
Education in Blackville
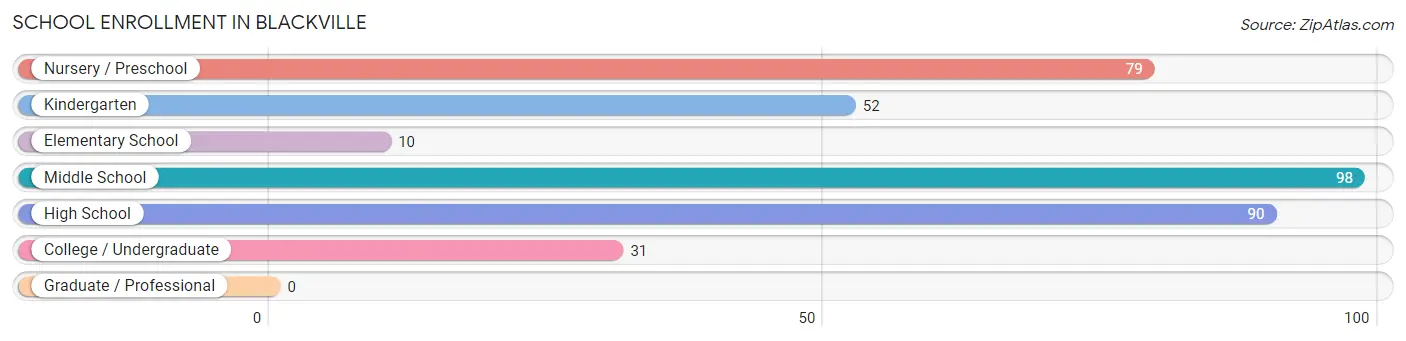
School Enrollment in Blackville
The most common levels of schooling among the 360 students in Blackville are middle school (98 | 27.2%), high school (90 | 25.0%), and nursery / preschool (79 | 21.9%).
| School Level | # Students | % Students |
| Nursery / Preschool | 79 | 21.9% |
| Kindergarten | 52 | 14.4% |
| Elementary School | 10 | 2.8% |
| Middle School | 98 | 27.2% |
| High School | 90 | 25.0% |
| College / Undergraduate | 31 | 8.6% |
| Graduate / Professional | 0 | 0.0% |
| Total | 360 | 100.0% |
School Enrollment by Age by Funding Source in Blackville
Out of a total of 360 students who are enrolled in schools in Blackville, 17 (4.7%) attend a private institution, while the remaining 343 (95.3%) are enrolled in public schools. The age group of 20 to 24 year olds has the highest likelihood of being enrolled in private schools, with 12 (46.2% in the age bracket) enrolled. Conversely, the age group of 3 to 4 year olds has the lowest likelihood of being enrolled in a private school, with 27 (100.0% in the age bracket) attending a public institution.
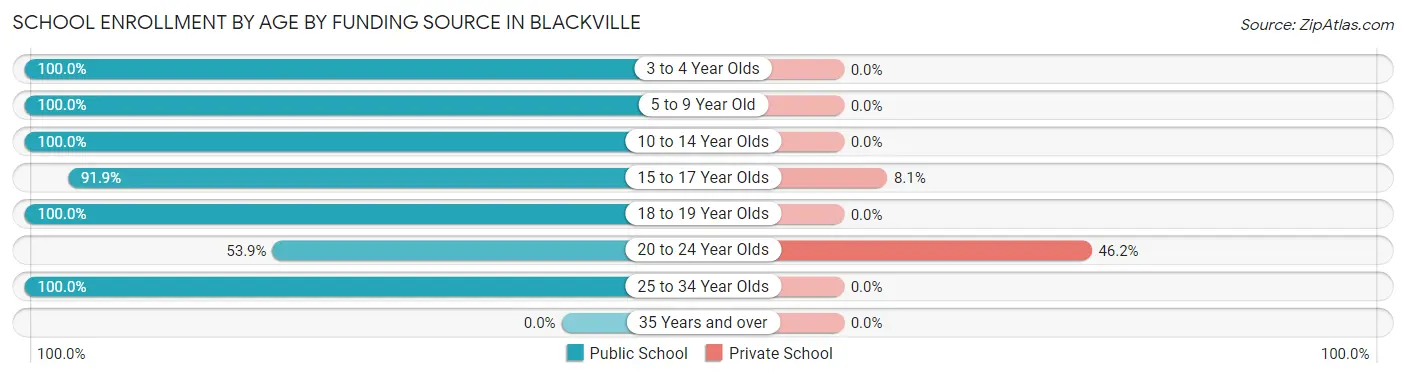
| Age Bracket | Public School | Private School |
| 3 to 4 Year Olds | 27 (100.0%) | 0 (0.0%) |
| 5 to 9 Year Old | 104 (100.0%) | 0 (0.0%) |
| 10 to 14 Year Olds | 108 (100.0%) | 0 (0.0%) |
| 15 to 17 Year Olds | 57 (91.9%) | 5 (8.1%) |
| 18 to 19 Year Olds | 28 (100.0%) | 0 (0.0%) |
| 20 to 24 Year Olds | 14 (53.8%) | 12 (46.2%) |
| 25 to 34 Year Olds | 5 (100.0%) | 0 (0.0%) |
| 35 Years and over | 0 (0.0%) | 0 (0.0%) |
| Total | 343 (95.3%) | 17 (4.7%) |
Educational Attainment by Field of Study in Blackville
Education (68 | 41.5%), arts & humanities (59 | 36.0%), business (9 | 5.5%), bio, nature & agricultural (8 | 4.9%), and liberal arts & history (8 | 4.9%) are the most common fields of study among 164 individuals in Blackville who have obtained a bachelor's degree or higher.
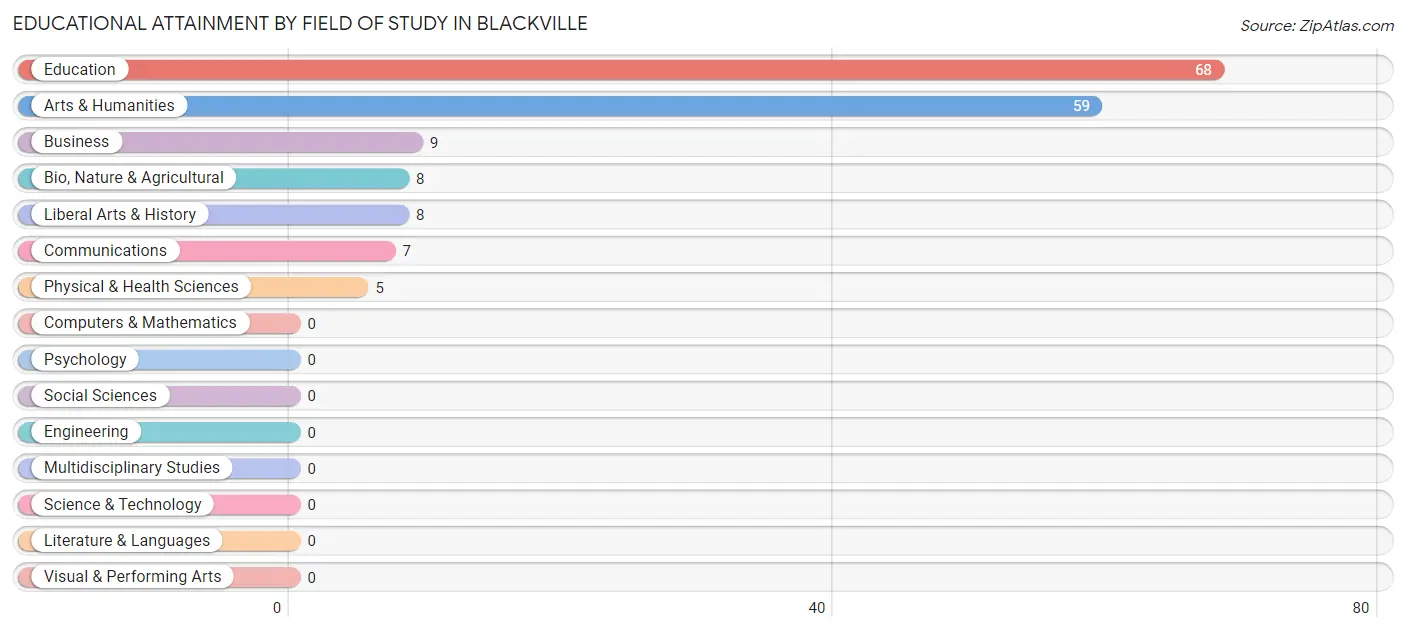
| Field of Study | # Graduates | % Graduates |
| Computers & Mathematics | 0 | 0.0% |
| Bio, Nature & Agricultural | 8 | 4.9% |
| Physical & Health Sciences | 5 | 3.0% |
| Psychology | 0 | 0.0% |
| Social Sciences | 0 | 0.0% |
| Engineering | 0 | 0.0% |
| Multidisciplinary Studies | 0 | 0.0% |
| Science & Technology | 0 | 0.0% |
| Business | 9 | 5.5% |
| Education | 68 | 41.5% |
| Literature & Languages | 0 | 0.0% |
| Liberal Arts & History | 8 | 4.9% |
| Visual & Performing Arts | 0 | 0.0% |
| Communications | 7 | 4.3% |
| Arts & Humanities | 59 | 36.0% |
| Total | 164 | 100.0% |
Transportation & Commute in Blackville
Vehicle Availability by Sex in Blackville
The most prevalent vehicle ownership categories in Blackville are males with 2 vehicles (209, accounting for 43.7%) and females with 2 vehicles (224, making up 46.6%).
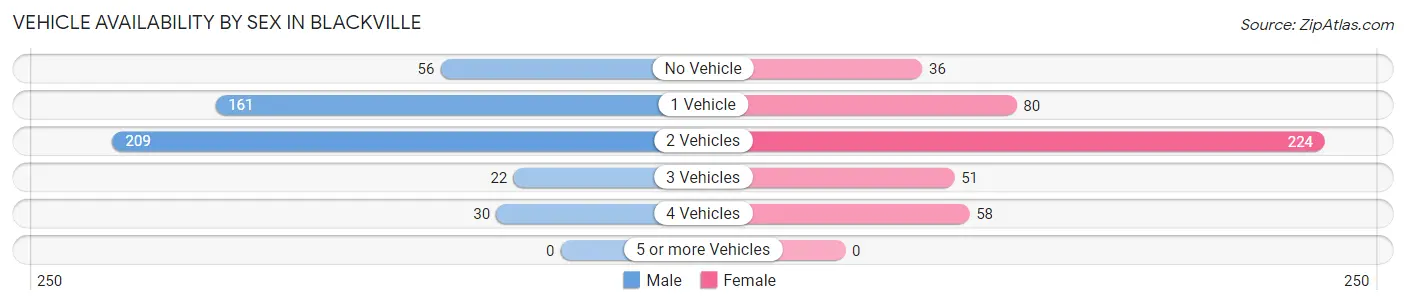
| Vehicles Available | Male | Female |
| No Vehicle | 56 (11.7%) | 36 (8.0%) |
| 1 Vehicle | 161 (33.7%) | 80 (17.8%) |
| 2 Vehicles | 209 (43.7%) | 224 (49.9%) |
| 3 Vehicles | 22 (4.6%) | 51 (11.4%) |
| 4 Vehicles | 30 (6.3%) | 58 (12.9%) |
| 5 or more Vehicles | 0 (0.0%) | 0 (0.0%) |
| Total | 478 (100.0%) | 449 (100.0%) |
Commute Time in Blackville
The most frequently occuring commute durations in Blackville are 30 to 34 minutes (208 commuters, 22.4%), 5 to 9 minutes (190 commuters, 20.5%), and 40 to 44 minutes (153 commuters, 16.5%).
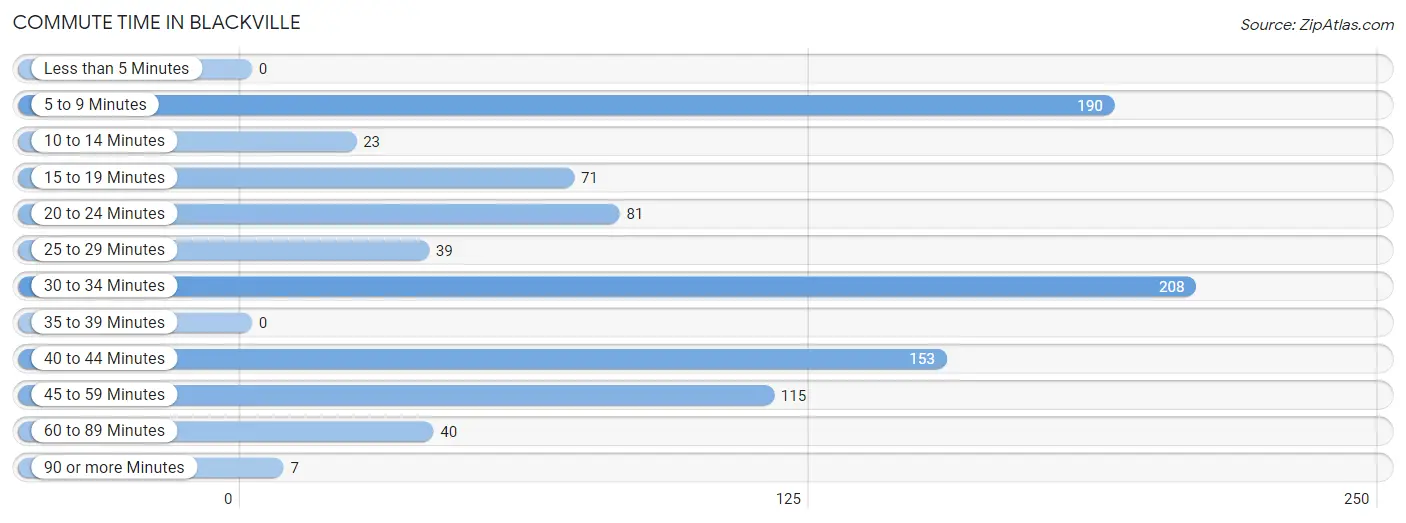
| Commute Time | # Commuters | % Commuters |
| Less than 5 Minutes | 0 | 0.0% |
| 5 to 9 Minutes | 190 | 20.5% |
| 10 to 14 Minutes | 23 | 2.5% |
| 15 to 19 Minutes | 71 | 7.7% |
| 20 to 24 Minutes | 81 | 8.7% |
| 25 to 29 Minutes | 39 | 4.2% |
| 30 to 34 Minutes | 208 | 22.4% |
| 35 to 39 Minutes | 0 | 0.0% |
| 40 to 44 Minutes | 153 | 16.5% |
| 45 to 59 Minutes | 115 | 12.4% |
| 60 to 89 Minutes | 40 | 4.3% |
| 90 or more Minutes | 7 | 0.8% |
Commute Time by Sex in Blackville
The most common commute times in Blackville are 30 to 34 minutes (161 commuters, 33.7%) for males and 45 to 59 minutes (95 commuters, 21.2%) for females.
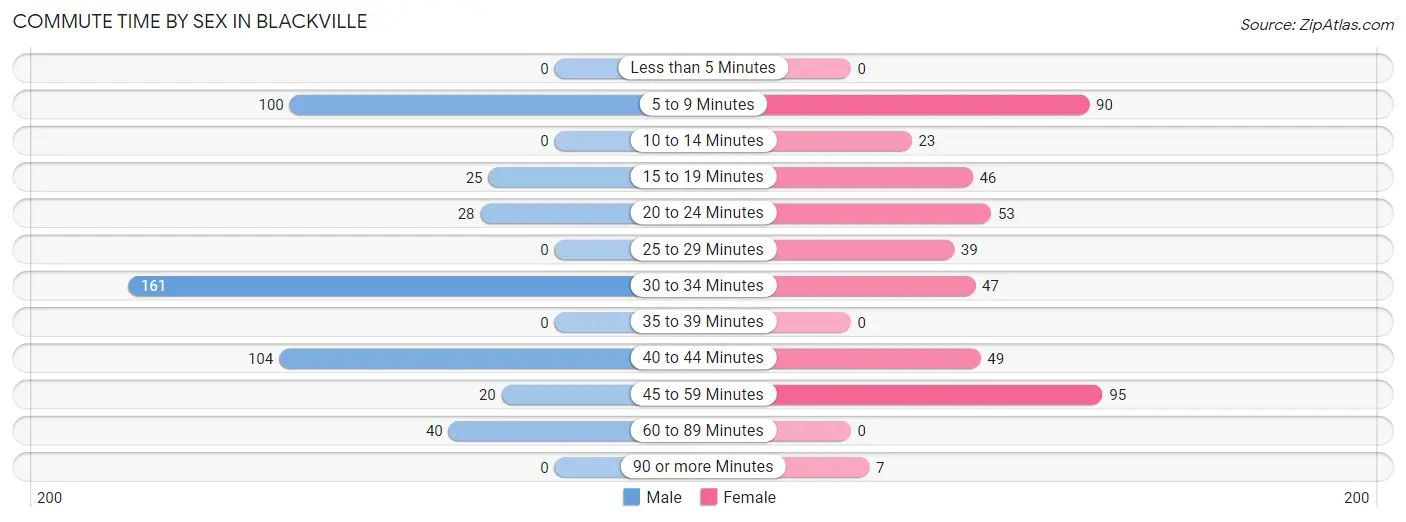
| Commute Time | Male | Female |
| Less than 5 Minutes | 0 (0.0%) | 0 (0.0%) |
| 5 to 9 Minutes | 100 (20.9%) | 90 (20.0%) |
| 10 to 14 Minutes | 0 (0.0%) | 23 (5.1%) |
| 15 to 19 Minutes | 25 (5.2%) | 46 (10.2%) |
| 20 to 24 Minutes | 28 (5.9%) | 53 (11.8%) |
| 25 to 29 Minutes | 0 (0.0%) | 39 (8.7%) |
| 30 to 34 Minutes | 161 (33.7%) | 47 (10.5%) |
| 35 to 39 Minutes | 0 (0.0%) | 0 (0.0%) |
| 40 to 44 Minutes | 104 (21.8%) | 49 (10.9%) |
| 45 to 59 Minutes | 20 (4.2%) | 95 (21.2%) |
| 60 to 89 Minutes | 40 (8.4%) | 0 (0.0%) |
| 90 or more Minutes | 0 (0.0%) | 7 (1.6%) |
Time of Departure to Work by Sex in Blackville
The most frequent times of departure to work in Blackville are 5:00 AM to 5:29 AM (151, 31.6%) for males and 7:00 AM to 7:29 AM (105, 23.4%) for females.
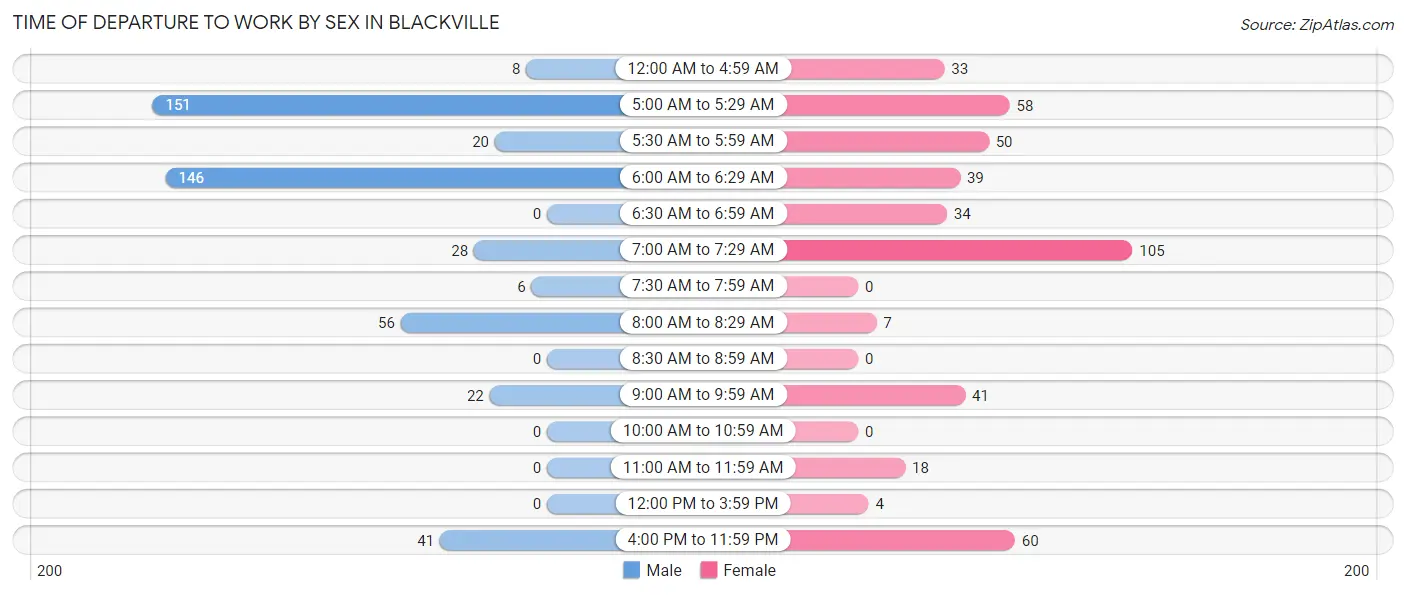
| Time of Departure | Male | Female |
| 12:00 AM to 4:59 AM | 8 (1.7%) | 33 (7.3%) |
| 5:00 AM to 5:29 AM | 151 (31.6%) | 58 (12.9%) |
| 5:30 AM to 5:59 AM | 20 (4.2%) | 50 (11.1%) |
| 6:00 AM to 6:29 AM | 146 (30.5%) | 39 (8.7%) |
| 6:30 AM to 6:59 AM | 0 (0.0%) | 34 (7.6%) |
| 7:00 AM to 7:29 AM | 28 (5.9%) | 105 (23.4%) |
| 7:30 AM to 7:59 AM | 6 (1.3%) | 0 (0.0%) |
| 8:00 AM to 8:29 AM | 56 (11.7%) | 7 (1.6%) |
| 8:30 AM to 8:59 AM | 0 (0.0%) | 0 (0.0%) |
| 9:00 AM to 9:59 AM | 22 (4.6%) | 41 (9.1%) |
| 10:00 AM to 10:59 AM | 0 (0.0%) | 0 (0.0%) |
| 11:00 AM to 11:59 AM | 0 (0.0%) | 18 (4.0%) |
| 12:00 PM to 3:59 PM | 0 (0.0%) | 4 (0.9%) |
| 4:00 PM to 11:59 PM | 41 (8.6%) | 60 (13.4%) |
| Total | 478 (100.0%) | 449 (100.0%) |
Housing Occupancy in Blackville
Occupancy by Ownership in Blackville
Of the total 752 dwellings in Blackville, owner-occupied units account for 410 (54.5%), while renter-occupied units make up 342 (45.5%).
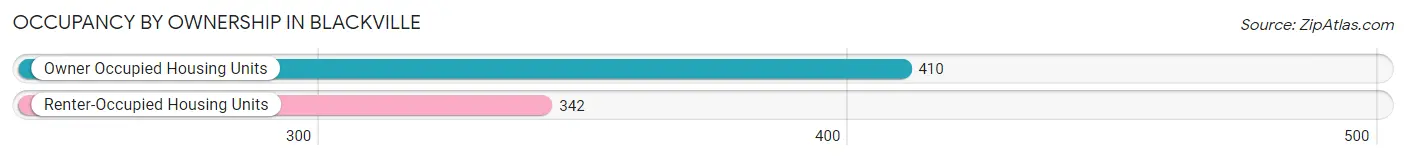
| Occupancy | # Housing Units | % Housing Units |
| Owner Occupied Housing Units | 410 | 54.5% |
| Renter-Occupied Housing Units | 342 | 45.5% |
| Total Occupied Housing Units | 752 | 100.0% |
Occupancy by Household Size in Blackville
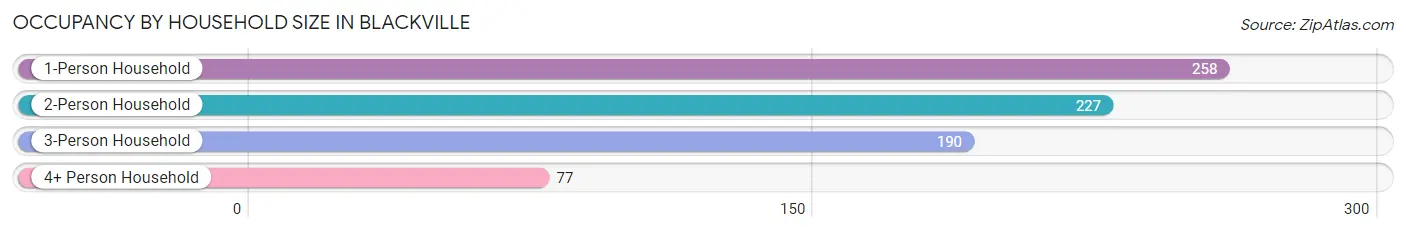
| Household Size | # Housing Units | % Housing Units |
| 1-Person Household | 258 | 34.3% |
| 2-Person Household | 227 | 30.2% |
| 3-Person Household | 190 | 25.3% |
| 4+ Person Household | 77 | 10.2% |
| Total Housing Units | 752 | 100.0% |
Occupancy by Ownership by Household Size in Blackville
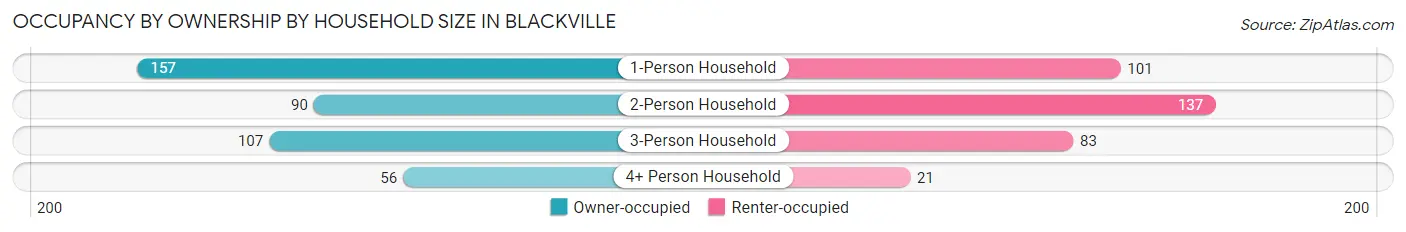
| Household Size | Owner-occupied | Renter-occupied |
| 1-Person Household | 157 (60.9%) | 101 (39.2%) |
| 2-Person Household | 90 (39.7%) | 137 (60.4%) |
| 3-Person Household | 107 (56.3%) | 83 (43.7%) |
| 4+ Person Household | 56 (72.7%) | 21 (27.3%) |
| Total Housing Units | 410 (54.5%) | 342 (45.5%) |
Occupancy by Educational Attainment in Blackville
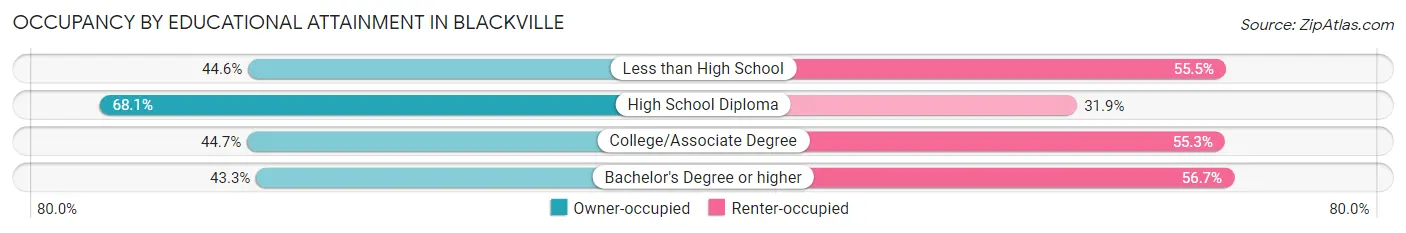
| Household Size | Owner-occupied | Renter-occupied |
| Less than High School | 90 (44.6%) | 112 (55.4%) |
| High School Diploma | 220 (68.1%) | 103 (31.9%) |
| College/Associate Degree | 55 (44.7%) | 68 (55.3%) |
| Bachelor's Degree or higher | 45 (43.3%) | 59 (56.7%) |
Occupancy by Age of Householder in Blackville
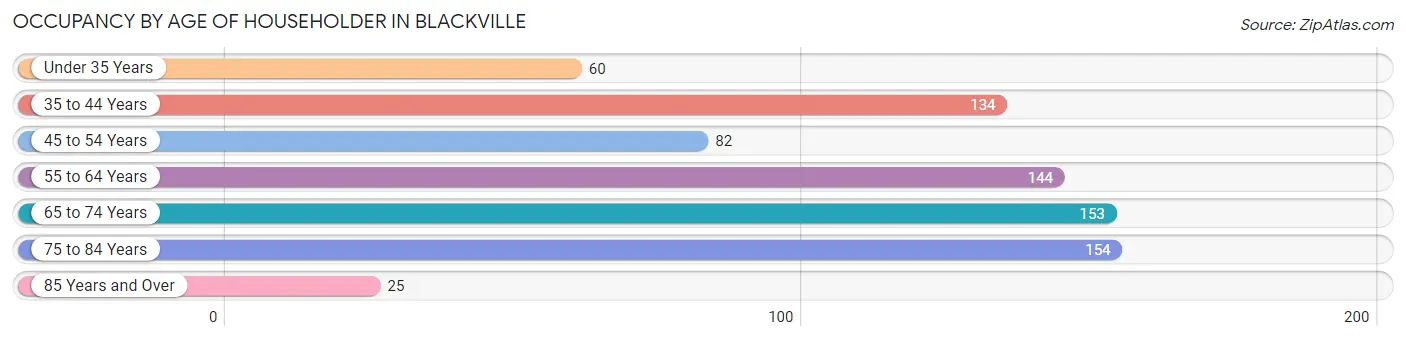
| Age Bracket | # Households | % Households |
| Under 35 Years | 60 | 8.0% |
| 35 to 44 Years | 134 | 17.8% |
| 45 to 54 Years | 82 | 10.9% |
| 55 to 64 Years | 144 | 19.2% |
| 65 to 74 Years | 153 | 20.3% |
| 75 to 84 Years | 154 | 20.5% |
| 85 Years and Over | 25 | 3.3% |
| Total | 752 | 100.0% |
Housing Finances in Blackville
Median Income by Occupancy in Blackville
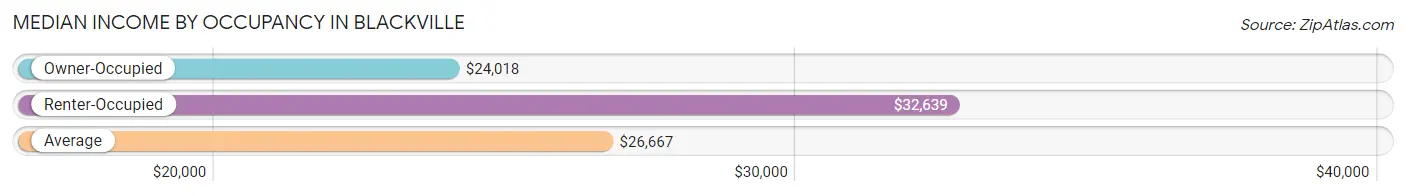
| Occupancy Type | # Households | Median Income |
| Owner-Occupied | 410 (54.5%) | $24,018 |
| Renter-Occupied | 342 (45.5%) | $32,639 |
| Average | 752 (100.0%) | $26,667 |
Occupancy by Householder Income Bracket in Blackville
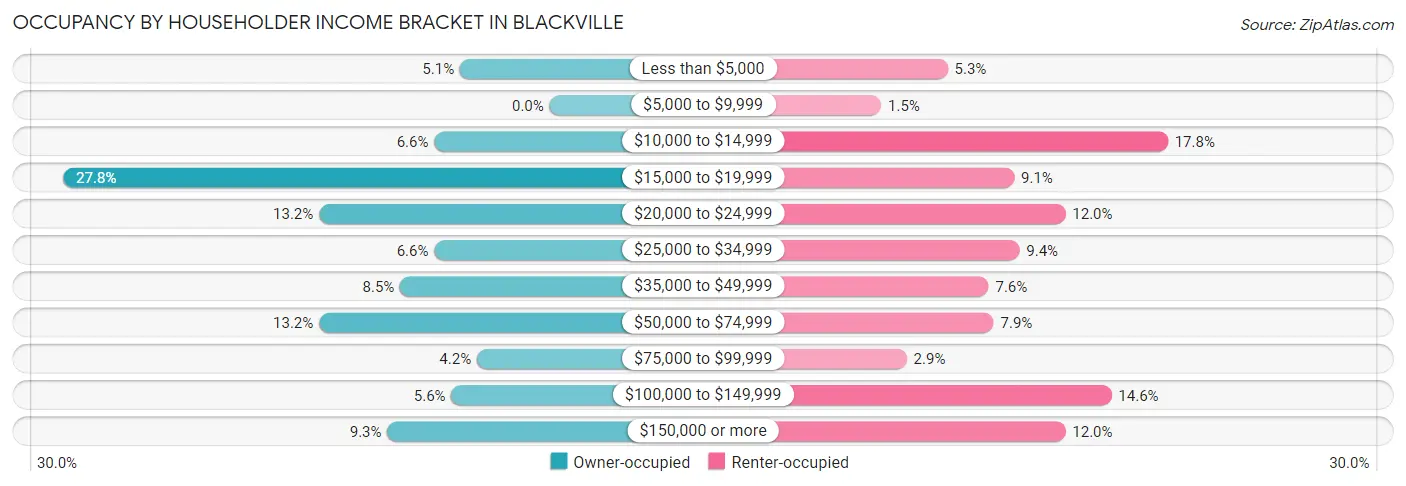
| Income Bracket | Owner-occupied | Renter-occupied |
| Less than $5,000 | 21 (5.1%) | 18 (5.3%) |
| $5,000 to $9,999 | 0 (0.0%) | 5 (1.5%) |
| $10,000 to $14,999 | 27 (6.6%) | 61 (17.8%) |
| $15,000 to $19,999 | 114 (27.8%) | 31 (9.1%) |
| $20,000 to $24,999 | 54 (13.2%) | 41 (12.0%) |
| $25,000 to $34,999 | 27 (6.6%) | 32 (9.4%) |
| $35,000 to $49,999 | 35 (8.5%) | 26 (7.6%) |
| $50,000 to $74,999 | 54 (13.2%) | 27 (7.9%) |
| $75,000 to $99,999 | 17 (4.2%) | 10 (2.9%) |
| $100,000 to $149,999 | 23 (5.6%) | 50 (14.6%) |
| $150,000 or more | 38 (9.3%) | 41 (12.0%) |
| Total | 410 (100.0%) | 342 (100.0%) |
Monthly Housing Cost Tiers in Blackville
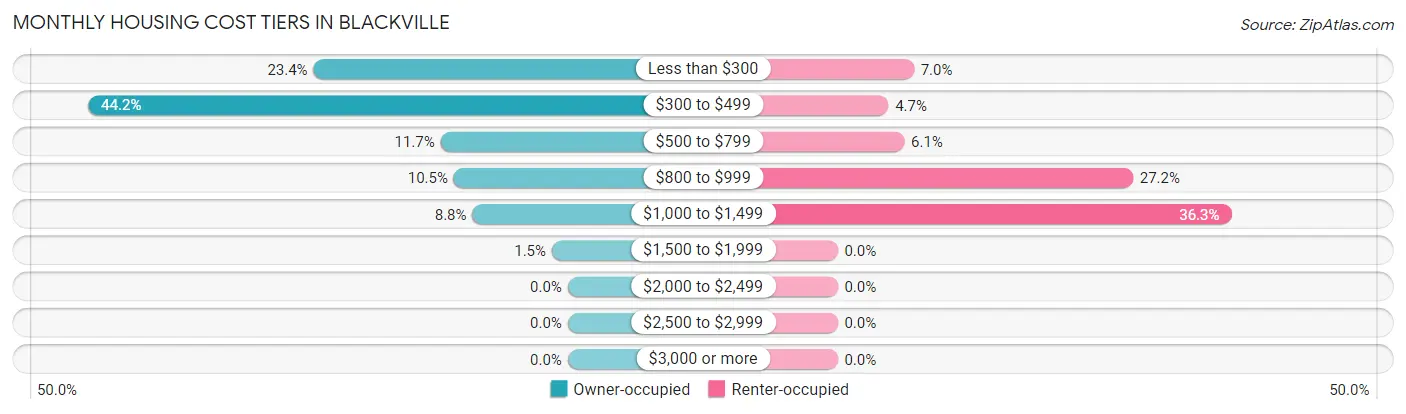
| Monthly Cost | Owner-occupied | Renter-occupied |
| Less than $300 | 96 (23.4%) | 24 (7.0%) |
| $300 to $499 | 181 (44.2%) | 16 (4.7%) |
| $500 to $799 | 48 (11.7%) | 21 (6.1%) |
| $800 to $999 | 43 (10.5%) | 93 (27.2%) |
| $1,000 to $1,499 | 36 (8.8%) | 124 (36.3%) |
| $1,500 to $1,999 | 6 (1.5%) | 0 (0.0%) |
| $2,000 to $2,499 | 0 (0.0%) | 0 (0.0%) |
| $2,500 to $2,999 | 0 (0.0%) | 0 (0.0%) |
| $3,000 or more | 0 (0.0%) | 0 (0.0%) |
| Total | 410 (100.0%) | 342 (100.0%) |
Physical Housing Characteristics in Blackville
Housing Structures in Blackville
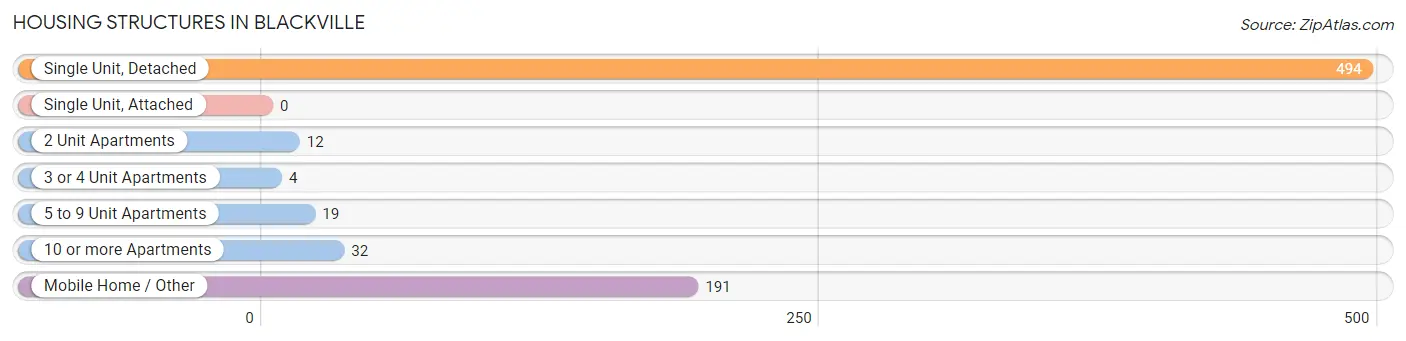
| Structure Type | # Housing Units | % Housing Units |
| Single Unit, Detached | 494 | 65.7% |
| Single Unit, Attached | 0 | 0.0% |
| 2 Unit Apartments | 12 | 1.6% |
| 3 or 4 Unit Apartments | 4 | 0.5% |
| 5 to 9 Unit Apartments | 19 | 2.5% |
| 10 or more Apartments | 32 | 4.3% |
| Mobile Home / Other | 191 | 25.4% |
| Total | 752 | 100.0% |
Housing Structures by Occupancy in Blackville
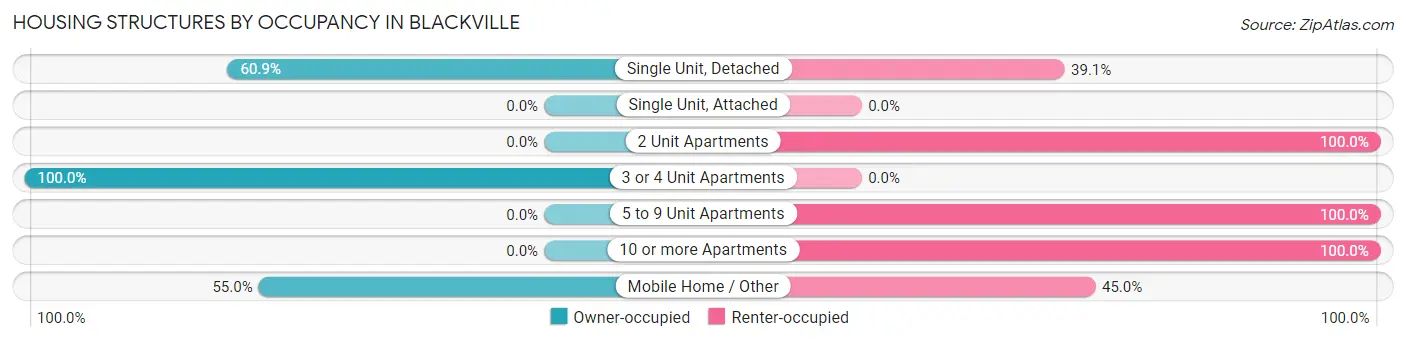
| Structure Type | Owner-occupied | Renter-occupied |
| Single Unit, Detached | 301 (60.9%) | 193 (39.1%) |
| Single Unit, Attached | 0 (0.0%) | 0 (0.0%) |
| 2 Unit Apartments | 0 (0.0%) | 12 (100.0%) |
| 3 or 4 Unit Apartments | 4 (100.0%) | 0 (0.0%) |
| 5 to 9 Unit Apartments | 0 (0.0%) | 19 (100.0%) |
| 10 or more Apartments | 0 (0.0%) | 32 (100.0%) |
| Mobile Home / Other | 105 (55.0%) | 86 (45.0%) |
| Total | 410 (54.5%) | 342 (45.5%) |
Housing Structures by Number of Rooms in Blackville
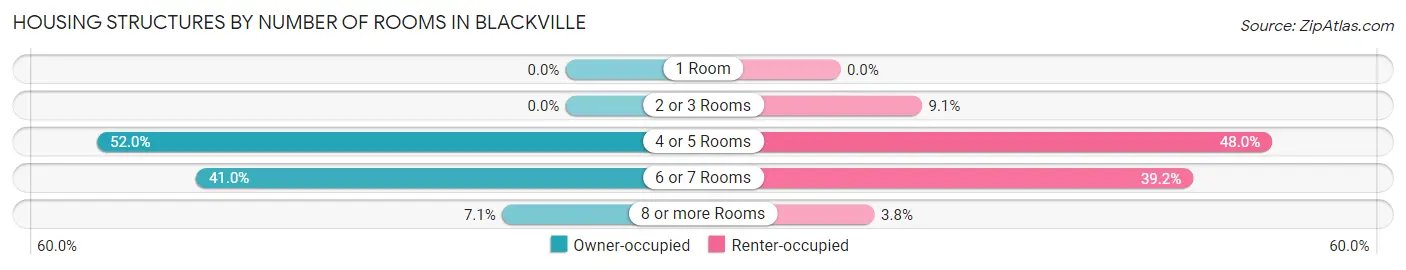
| Number of Rooms | Owner-occupied | Renter-occupied |
| 1 Room | 0 (0.0%) | 0 (0.0%) |
| 2 or 3 Rooms | 0 (0.0%) | 31 (9.1%) |
| 4 or 5 Rooms | 213 (51.9%) | 164 (47.9%) |
| 6 or 7 Rooms | 168 (41.0%) | 134 (39.2%) |
| 8 or more Rooms | 29 (7.1%) | 13 (3.8%) |
| Total | 410 (100.0%) | 342 (100.0%) |
Housing Structure by Heating Type in Blackville
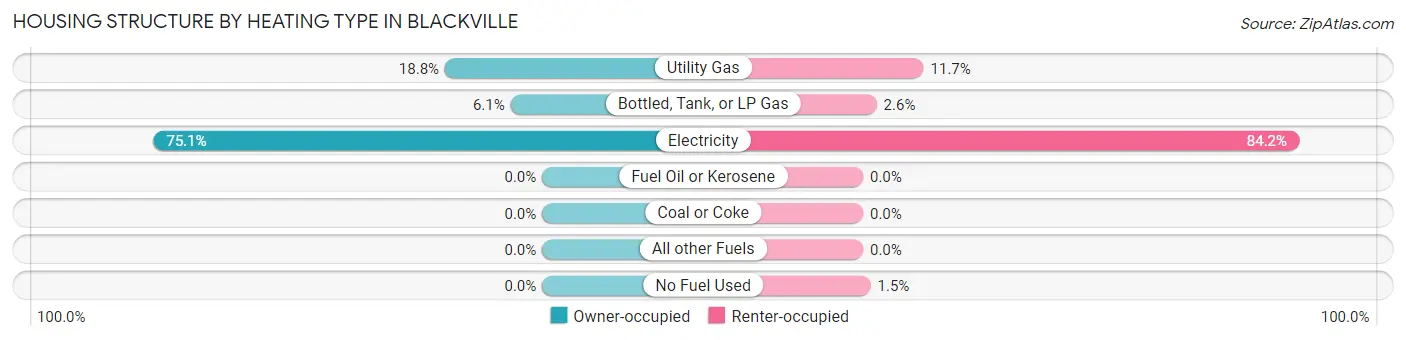
| Heating Type | Owner-occupied | Renter-occupied |
| Utility Gas | 77 (18.8%) | 40 (11.7%) |
| Bottled, Tank, or LP Gas | 25 (6.1%) | 9 (2.6%) |
| Electricity | 308 (75.1%) | 288 (84.2%) |
| Fuel Oil or Kerosene | 0 (0.0%) | 0 (0.0%) |
| Coal or Coke | 0 (0.0%) | 0 (0.0%) |
| All other Fuels | 0 (0.0%) | 0 (0.0%) |
| No Fuel Used | 0 (0.0%) | 5 (1.5%) |
| Total | 410 (100.0%) | 342 (100.0%) |
Household Vehicle Usage in Blackville
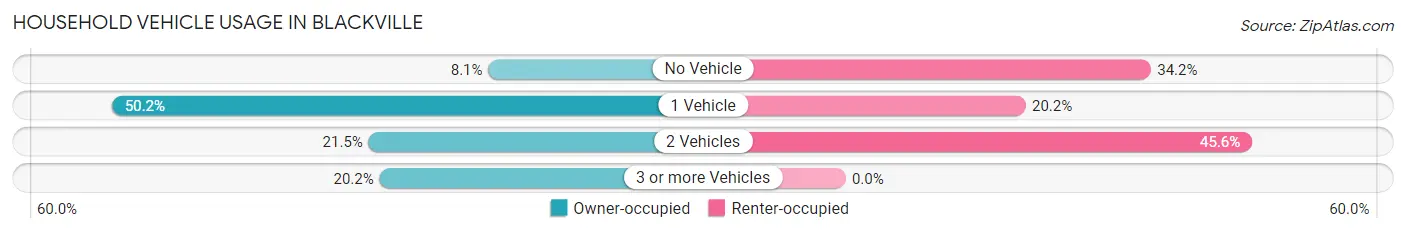
| Vehicles per Household | Owner-occupied | Renter-occupied |
| No Vehicle | 33 (8.1%) | 117 (34.2%) |
| 1 Vehicle | 206 (50.2%) | 69 (20.2%) |
| 2 Vehicles | 88 (21.5%) | 156 (45.6%) |
| 3 or more Vehicles | 83 (20.2%) | 0 (0.0%) |
| Total | 410 (100.0%) | 342 (100.0%) |
Real Estate & Mortgages in Blackville
Real Estate and Mortgage Overview in Blackville
| Characteristic | Without Mortgage | With Mortgage |
| Housing Units | 312 | 98 |
| Median Property Value | $55,200 | $100,000 |
| Median Household Income | $22,589 | $38 |
| Monthly Housing Costs | $335 | $0 |
| Real Estate Taxes | $354 | $4 |
Property Value by Mortgage Status in Blackville
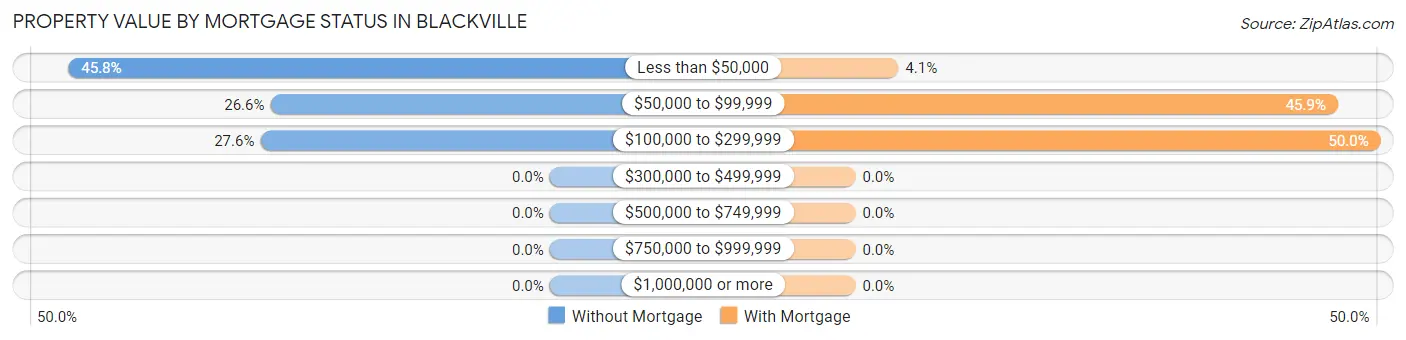
| Property Value | Without Mortgage | With Mortgage |
| Less than $50,000 | 143 (45.8%) | 4 (4.1%) |
| $50,000 to $99,999 | 83 (26.6%) | 45 (45.9%) |
| $100,000 to $299,999 | 86 (27.6%) | 49 (50.0%) |
| $300,000 to $499,999 | 0 (0.0%) | 0 (0.0%) |
| $500,000 to $749,999 | 0 (0.0%) | 0 (0.0%) |
| $750,000 to $999,999 | 0 (0.0%) | 0 (0.0%) |
| $1,000,000 or more | 0 (0.0%) | 0 (0.0%) |
| Total | 312 (100.0%) | 98 (100.0%) |
Household Income by Mortgage Status in Blackville
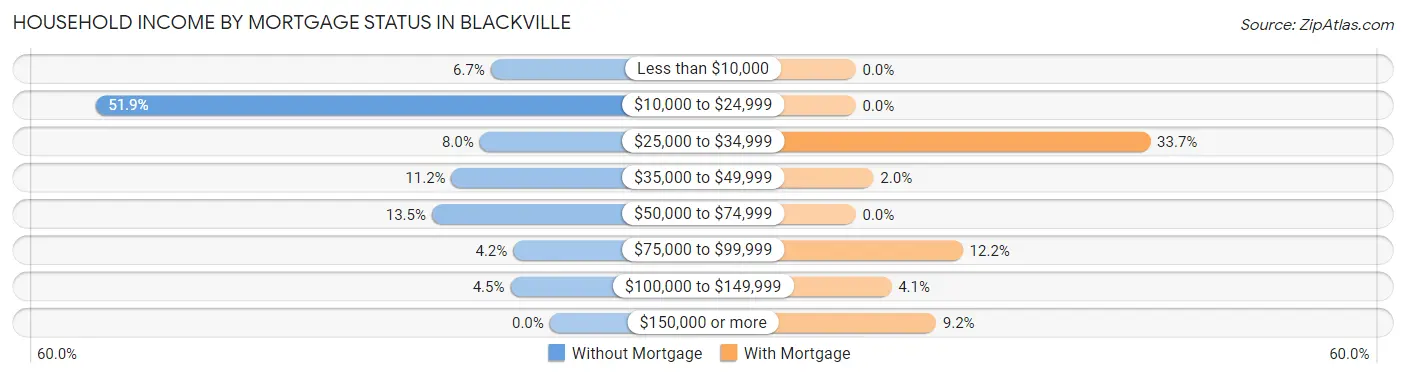
| Household Income | Without Mortgage | With Mortgage |
| Less than $10,000 | 21 (6.7%) | 0 (0.0%) |
| $10,000 to $24,999 | 162 (51.9%) | 0 (0.0%) |
| $25,000 to $34,999 | 25 (8.0%) | 33 (33.7%) |
| $35,000 to $49,999 | 35 (11.2%) | 2 (2.0%) |
| $50,000 to $74,999 | 42 (13.5%) | 0 (0.0%) |
| $75,000 to $99,999 | 13 (4.2%) | 12 (12.2%) |
| $100,000 to $149,999 | 14 (4.5%) | 4 (4.1%) |
| $150,000 or more | 0 (0.0%) | 9 (9.2%) |
| Total | 312 (100.0%) | 98 (100.0%) |
Property Value to Household Income Ratio in Blackville
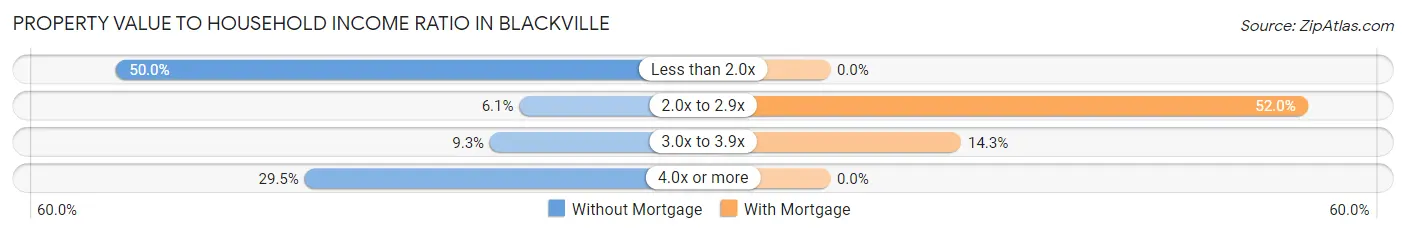
| Value-to-Income Ratio | Without Mortgage | With Mortgage |
| Less than 2.0x | 156 (50.0%) | 0 (0.0%) |
| 2.0x to 2.9x | 19 (6.1%) | 51 (52.0%) |
| 3.0x to 3.9x | 29 (9.3%) | 14 (14.3%) |
| 4.0x or more | 92 (29.5%) | 0 (0.0%) |
| Total | 312 (100.0%) | 98 (100.0%) |
Real Estate Taxes by Mortgage Status in Blackville
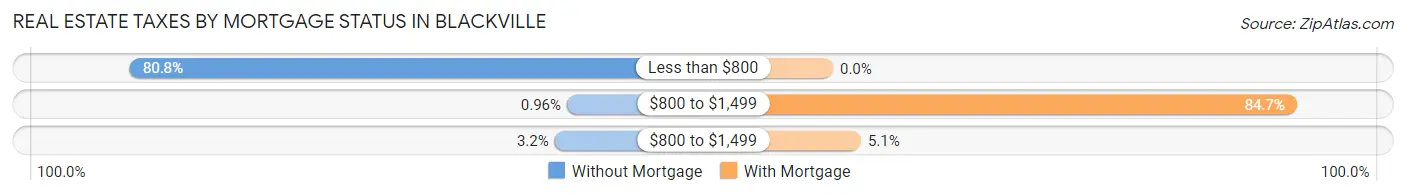
| Property Taxes | Without Mortgage | With Mortgage |
| Less than $800 | 252 (80.8%) | 0 (0.0%) |
| $800 to $1,499 | 3 (1.0%) | 83 (84.7%) |
| $800 to $1,499 | 10 (3.2%) | 5 (5.1%) |
| Total | 312 (100.0%) | 98 (100.0%) |
Health & Disability in Blackville
Health Insurance Coverage by Age in Blackville
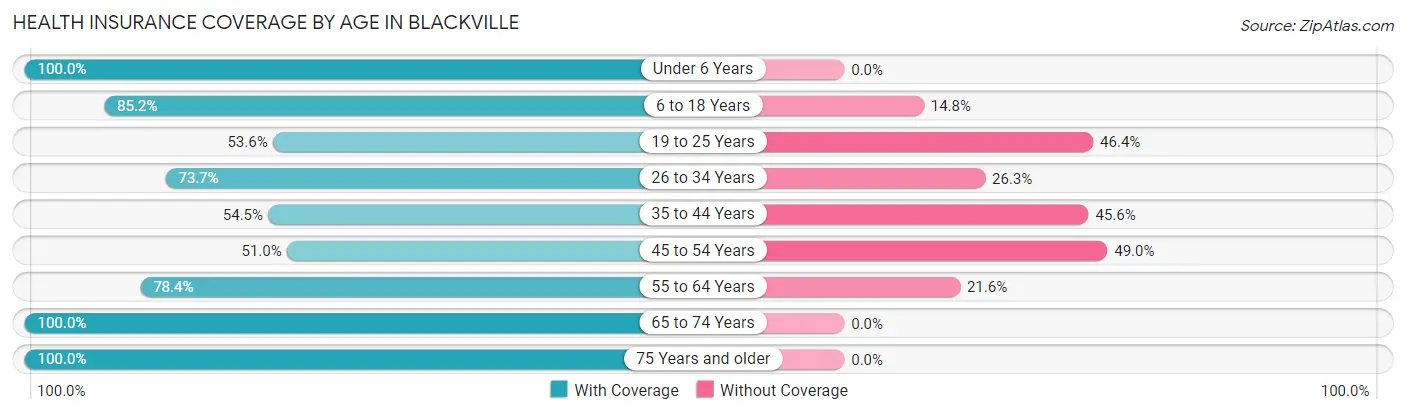
| Age Bracket | With Coverage | Without Coverage |
| Under 6 Years | 138 (100.0%) | 0 (0.0%) |
| 6 to 18 Years | 270 (85.2%) | 47 (14.8%) |
| 19 to 25 Years | 112 (53.6%) | 97 (46.4%) |
| 26 to 34 Years | 132 (73.7%) | 47 (26.3%) |
| 35 to 44 Years | 208 (54.4%) | 174 (45.6%) |
| 45 to 54 Years | 80 (51.0%) | 77 (49.0%) |
| 55 to 64 Years | 200 (78.4%) | 55 (21.6%) |
| 65 to 74 Years | 192 (100.0%) | 0 (0.0%) |
| 75 Years and older | 202 (100.0%) | 0 (0.0%) |
| Total | 1,534 (75.5%) | 497 (24.5%) |
Health Insurance Coverage by Citizenship Status in Blackville
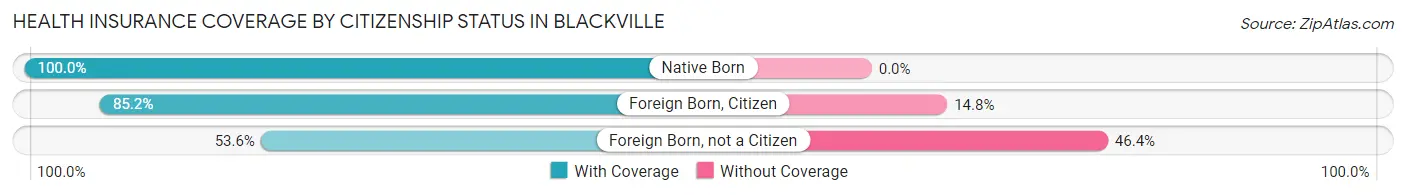
| Citizenship Status | With Coverage | Without Coverage |
| Native Born | 138 (100.0%) | 0 (0.0%) |
| Foreign Born, Citizen | 270 (85.2%) | 47 (14.8%) |
| Foreign Born, not a Citizen | 112 (53.6%) | 97 (46.4%) |
Health Insurance Coverage by Household Income in Blackville
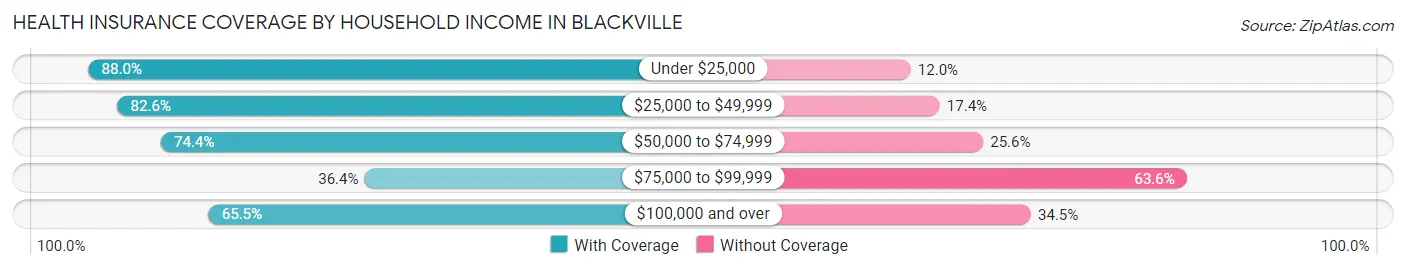
| Household Income | With Coverage | Without Coverage |
| Under $25,000 | 652 (88.0%) | 89 (12.0%) |
| $25,000 to $49,999 | 284 (82.6%) | 60 (17.4%) |
| $50,000 to $74,999 | 195 (74.4%) | 67 (25.6%) |
| $75,000 to $99,999 | 56 (36.4%) | 98 (63.6%) |
| $100,000 and over | 347 (65.5%) | 183 (34.5%) |
Public vs Private Health Insurance Coverage by Age in Blackville
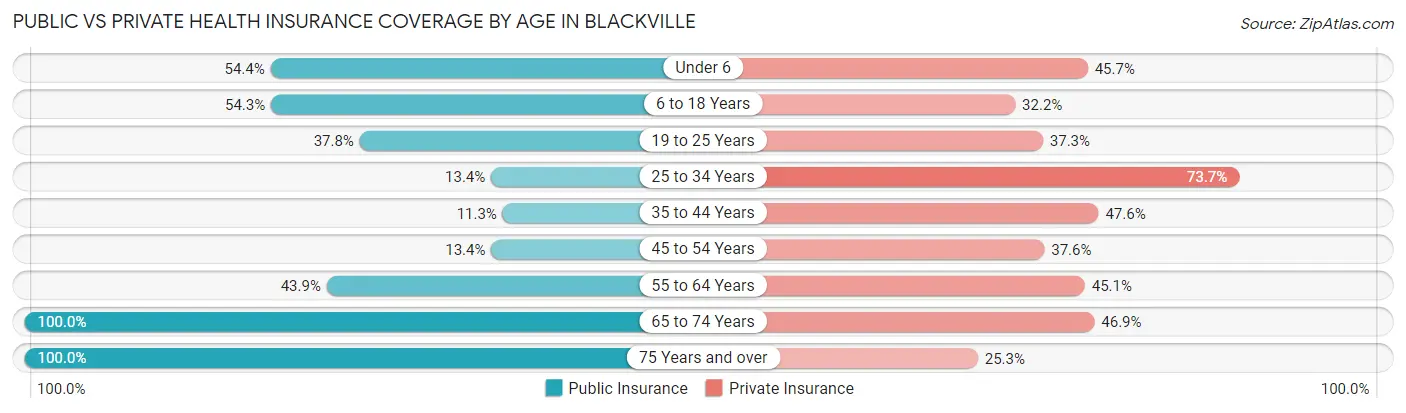
| Age Bracket | Public Insurance | Private Insurance |
| Under 6 | 75 (54.3%) | 63 (45.7%) |
| 6 to 18 Years | 172 (54.3%) | 102 (32.2%) |
| 19 to 25 Years | 79 (37.8%) | 78 (37.3%) |
| 25 to 34 Years | 24 (13.4%) | 132 (73.7%) |
| 35 to 44 Years | 43 (11.3%) | 182 (47.6%) |
| 45 to 54 Years | 21 (13.4%) | 59 (37.6%) |
| 55 to 64 Years | 112 (43.9%) | 115 (45.1%) |
| 65 to 74 Years | 192 (100.0%) | 90 (46.9%) |
| 75 Years and over | 202 (100.0%) | 51 (25.3%) |
| Total | 920 (45.3%) | 872 (42.9%) |
Disability Status by Sex by Age in Blackville
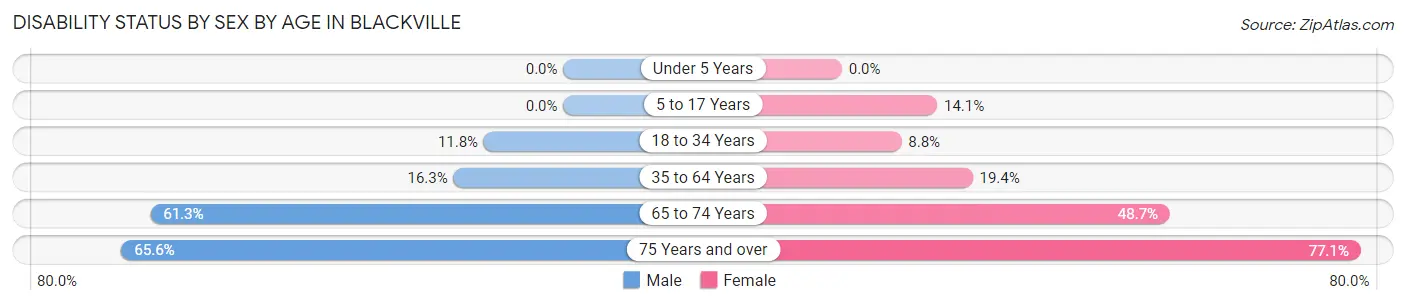
| Age Bracket | Male | Female |
| Under 5 Years | 0 (0.0%) | 0 (0.0%) |
| 5 to 17 Years | 0 (0.0%) | 14 (14.1%) |
| 18 to 34 Years | 29 (11.8%) | 19 (8.8%) |
| 35 to 64 Years | 74 (16.3%) | 66 (19.4%) |
| 65 to 74 Years | 46 (61.3%) | 57 (48.7%) |
| 75 Years and over | 21 (65.6%) | 131 (77.1%) |
Disability Class by Sex by Age in Blackville
Disability Class: Hearing Difficulty
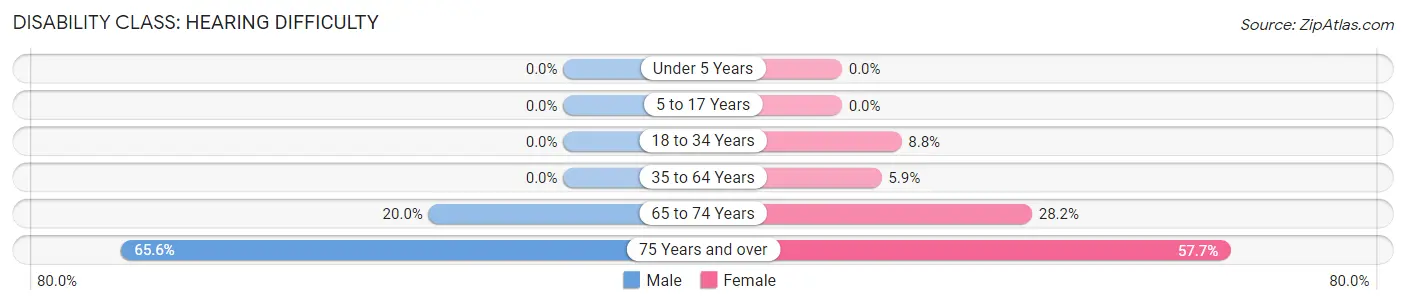
| Age Bracket | Male | Female |
| Under 5 Years | 0 (0.0%) | 0 (0.0%) |
| 5 to 17 Years | 0 (0.0%) | 0 (0.0%) |
| 18 to 34 Years | 0 (0.0%) | 19 (8.8%) |
| 35 to 64 Years | 0 (0.0%) | 20 (5.9%) |
| 65 to 74 Years | 15 (20.0%) | 33 (28.2%) |
| 75 Years and over | 21 (65.6%) | 98 (57.7%) |
Disability Class: Vision Difficulty
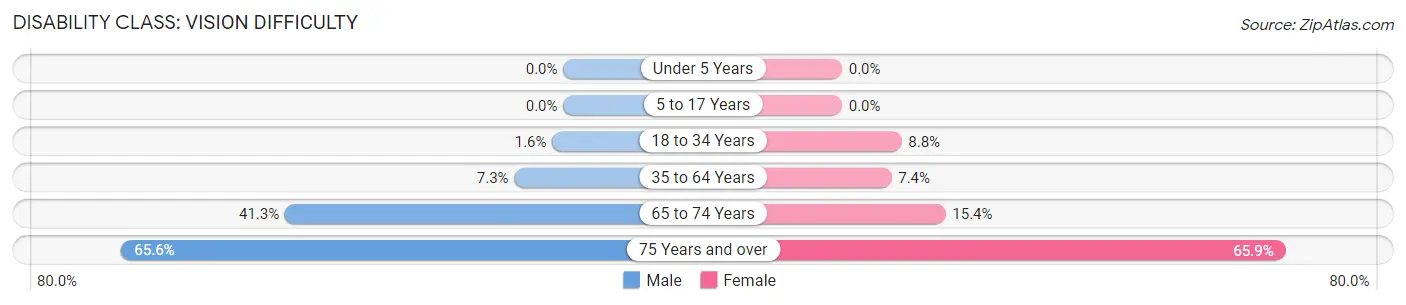
| Age Bracket | Male | Female |
| Under 5 Years | 0 (0.0%) | 0 (0.0%) |
| 5 to 17 Years | 0 (0.0%) | 0 (0.0%) |
| 18 to 34 Years | 4 (1.6%) | 19 (8.8%) |
| 35 to 64 Years | 33 (7.3%) | 25 (7.3%) |
| 65 to 74 Years | 31 (41.3%) | 18 (15.4%) |
| 75 Years and over | 21 (65.6%) | 112 (65.9%) |
Disability Class: Cognitive Difficulty
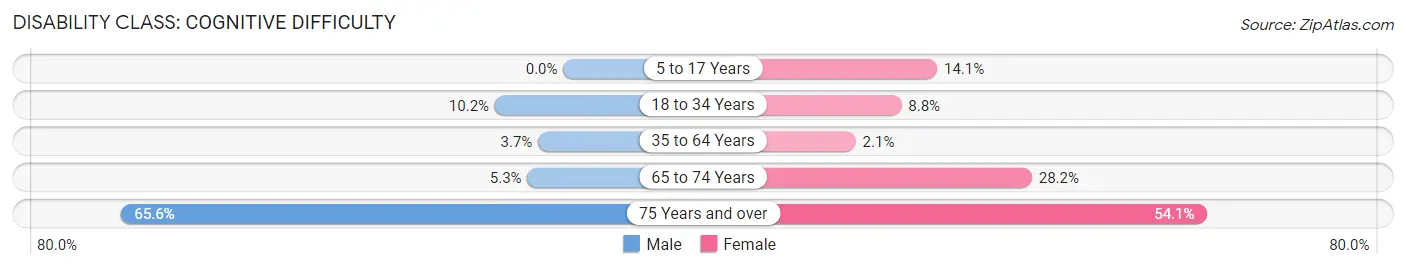
| Age Bracket | Male | Female |
| 5 to 17 Years | 0 (0.0%) | 14 (14.1%) |
| 18 to 34 Years | 25 (10.2%) | 19 (8.8%) |
| 35 to 64 Years | 17 (3.7%) | 7 (2.1%) |
| 65 to 74 Years | 4 (5.3%) | 33 (28.2%) |
| 75 Years and over | 21 (65.6%) | 92 (54.1%) |
Disability Class: Ambulatory Difficulty
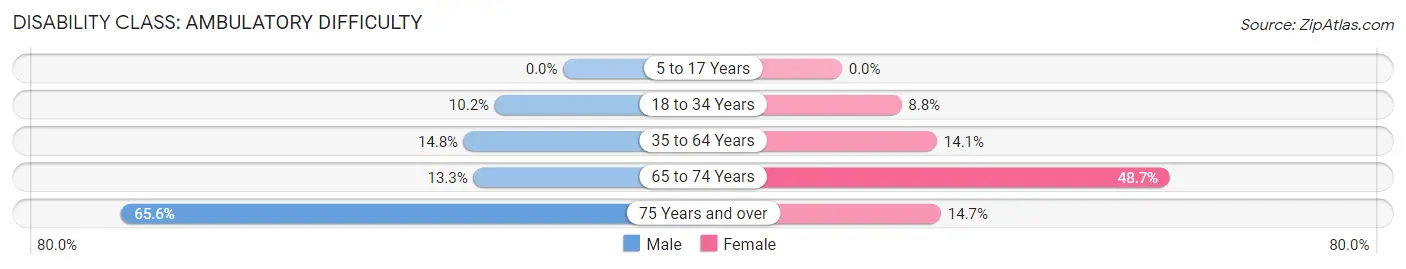
| Age Bracket | Male | Female |
| 5 to 17 Years | 0 (0.0%) | 0 (0.0%) |
| 18 to 34 Years | 25 (10.2%) | 19 (8.8%) |
| 35 to 64 Years | 67 (14.8%) | 48 (14.1%) |
| 65 to 74 Years | 10 (13.3%) | 57 (48.7%) |
| 75 Years and over | 21 (65.6%) | 25 (14.7%) |
Disability Class: Self-Care Difficulty
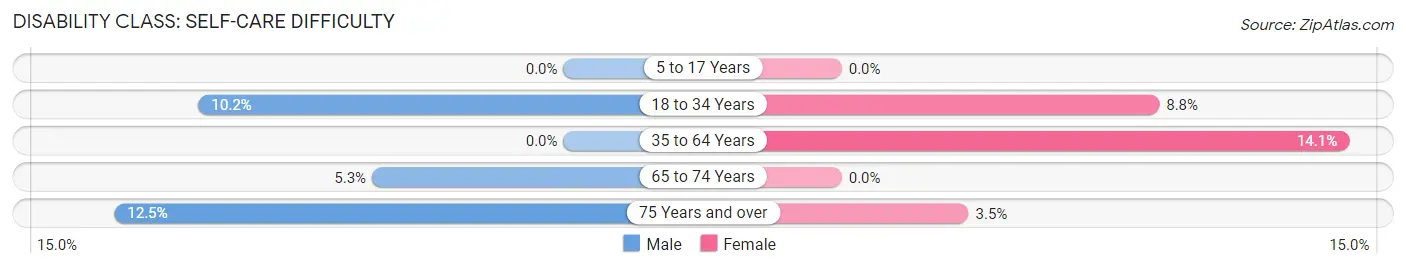
| Age Bracket | Male | Female |
| 5 to 17 Years | 0 (0.0%) | 0 (0.0%) |
| 18 to 34 Years | 25 (10.2%) | 19 (8.8%) |
| 35 to 64 Years | 0 (0.0%) | 48 (14.1%) |
| 65 to 74 Years | 4 (5.3%) | 0 (0.0%) |
| 75 Years and over | 4 (12.5%) | 6 (3.5%) |
Technology Access in Blackville
Computing Device Access in Blackville
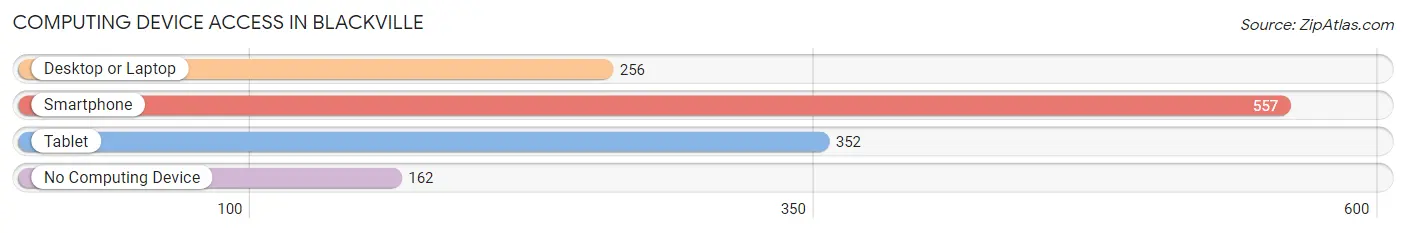
| Device Type | # Households | % Households |
| Desktop or Laptop | 256 | 34.0% |
| Smartphone | 557 | 74.1% |
| Tablet | 352 | 46.8% |
| No Computing Device | 162 | 21.5% |
| Total | 752 | 100.0% |
Internet Access in Blackville
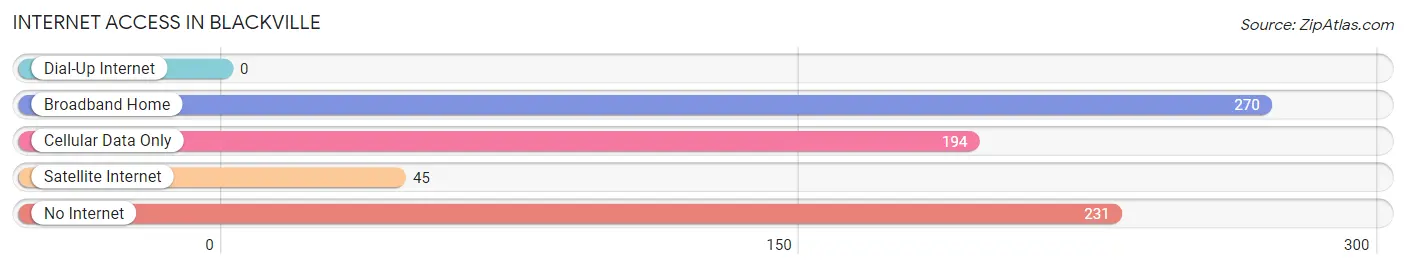
| Internet Type | # Households | % Households |
| Dial-Up Internet | 0 | 0.0% |
| Broadband Home | 270 | 35.9% |
| Cellular Data Only | 194 | 25.8% |
| Satellite Internet | 45 | 6.0% |
| No Internet | 231 | 30.7% |
| Total | 752 | 100.0% |
Blackville Summary
Blackville, SC is a small town located in Barnwell County, South Carolina. It is situated on the banks of the Salkehatchie River, approximately 30 miles east of Augusta, Georgia. The town was founded in 1820 and is the oldest settlement in Barnwell County. The population of Blackville was 1,845 in the 2010 census.
Geography
Blackville is located in the Piedmont region of South Carolina, which is characterized by rolling hills and flat plains. The town is situated on the banks of the Salkehatchie River, which is a tributary of the Savannah River. The town is located in the heart of the South Carolina Sandhills, which is a region of sandy soils and pine forests. The town is located in the Eastern Time Zone and has an elevation of approximately 200 feet.
Economy
The economy of Blackville is largely based on agriculture and manufacturing. The town is home to several large farms, which produce cotton, corn, soybeans, and other crops. The town is also home to several manufacturing companies, which produce a variety of products, including furniture, textiles, and automotive parts. The town is also home to several small businesses, including restaurants, retail stores, and service providers.
Demographics
As of the 2010 census, the population of Blackville was 1,845. The racial makeup of the town was 79.3% White, 17.7% African American, 0.3% Native American, 0.3% Asian, 0.1% Pacific Islander, and 2.3% from other races. The median household income was $30,938, and the median family income was $37,813. The per capita income was $15,945.
The town is served by the Barnwell County School District, which includes Blackville-Hilda High School. The town is also home to several churches, including the First Baptist Church of Blackville, the Blackville United Methodist Church, and the Blackville Presbyterian Church.
Conclusion
Blackville, SC is a small town located in Barnwell County, South Carolina. It is situated on the banks of the Salkehatchie River, approximately 30 miles east of Augusta, Georgia. The town was founded in 1820 and is the oldest settlement in Barnwell County. The population of Blackville was 1,845 in the 2010 census. The economy of Blackville is largely based on agriculture and manufacturing, and the town is home to several large farms and manufacturing companies. The racial makeup of the town was 79.3% White, 17.7% African American, 0.3% Native American, 0.3% Asian, 0.1% Pacific Islander, and 2.3% from other races. The median household income was $30,938, and the median family income was $37,813. The town is served by the Barnwell County School District, and is home to several churches.
Common Questions
What is Per Capita Income in Blackville?
Per Capita income in Blackville is $24,872.
What is the Median Family Income in Blackville?
Median Family Income in Blackville is $49,063.
What is the Median Household income in Blackville?
Median Household Income in Blackville is $26,667.
What is Income or Wage Gap in Blackville?
Income or Wage Gap in Blackville is 44.9%.
Women in Blackville earn 55.1 cents for every dollar earned by a man.
What is Inequality or Gini Index in Blackville?
Inequality or Gini Index in Blackville is 0.53.
What is the Total Population of Blackville?
Total Population of Blackville is 2,034.
What is the Total Male Population of Blackville?
Total Male Population of Blackville is 1,047.
What is the Total Female Population of Blackville?
Total Female Population of Blackville is 987.
What is the Ratio of Males per 100 Females in Blackville?
There are 106.08 Males per 100 Females in Blackville.
What is the Ratio of Females per 100 Males in Blackville?
There are 94.27 Females per 100 Males in Blackville.
What is the Median Population Age in Blackville?
Median Population Age in Blackville is 41.3 Years.
What is the Average Family Size in Blackville
Average Family Size in Blackville is 3.6 People.
What is the Average Household Size in Blackville
Average Household Size in Blackville is 2.7 People.
How Large is the Labor Force in Blackville?
There are 968 People in the Labor Forcein in Blackville.
What is the Percentage of People in the Labor Force in Blackville?
57.3% of People are in the Labor Force in Blackville.
What is the Unemployment Rate in Blackville?
Unemployment Rate in Blackville is 3.5%.