Fountain Inn, SC Map & Demographics
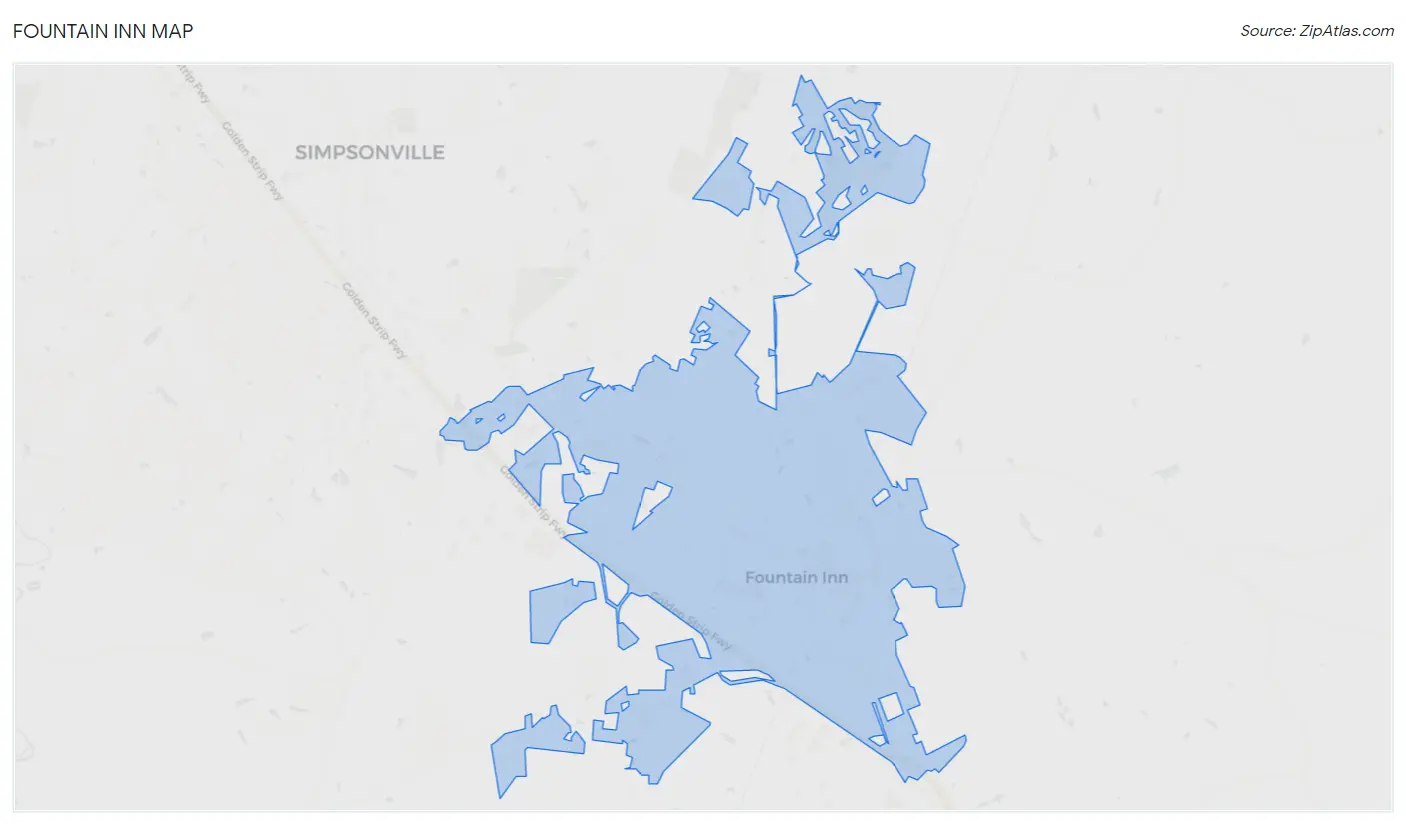
Fountain Inn Map
Fountain Inn Overview
$30,185
PER CAPITA INCOME
$79,670
AVG FAMILY INCOME
$73,665
AVG HOUSEHOLD INCOME
22.6%
WAGE / INCOME GAP [ % ]
77.4¢/ $1
WAGE / INCOME GAP [ $ ]
$10,279
FAMILY INCOME DEFICIT
0.37
INEQUALITY / GINI INDEX
10,675
TOTAL POPULATION
5,191
MALE POPULATION
5,484
FEMALE POPULATION
94.66
MALES / 100 FEMALES
105.64
FEMALES / 100 MALES
33.4
MEDIAN AGE
3.0
AVG FAMILY SIZE
2.7
AVG HOUSEHOLD SIZE
5,338
LABOR FORCE [ PEOPLE ]
67.1%
PERCENT IN LABOR FORCE
9.6%
UNEMPLOYMENT RATE
Fountain Inn Zip Codes
Fountain Inn Area Codes
Income in Fountain Inn
Income Overview in Fountain Inn
Per Capita Income in Fountain Inn is $30,185, while median incomes of families and households are $79,670 and $73,665 respectively.
| Characteristic | Number | Measure |
| Per Capita Income | 10,675 | $30,185 |
| Median Family Income | 3,015 | $79,670 |
| Mean Family Income | 3,015 | $84,392 |
| Median Household Income | 3,879 | $73,665 |
| Mean Household Income | 3,879 | $81,634 |
| Income Deficit | 3,015 | $10,279 |
| Wage / Income Gap (%) | 10,675 | 22.60% |
| Wage / Income Gap ($) | 10,675 | 77.40¢ per $1 |
| Gini / Inequality Index | 10,675 | 0.37 |
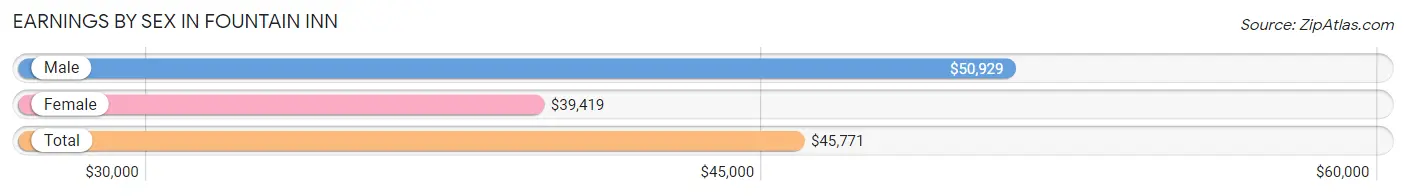
Earnings by Sex in Fountain Inn
Average Earnings in Fountain Inn are $45,771, $50,929 for men and $39,419 for women, a difference of 22.6%.
| Sex | Number | Average Earnings |
| Male | 2,733 (51.2%) | $50,929 |
| Female | 2,608 (48.8%) | $39,419 |
| Total | 5,341 (100.0%) | $45,771 |
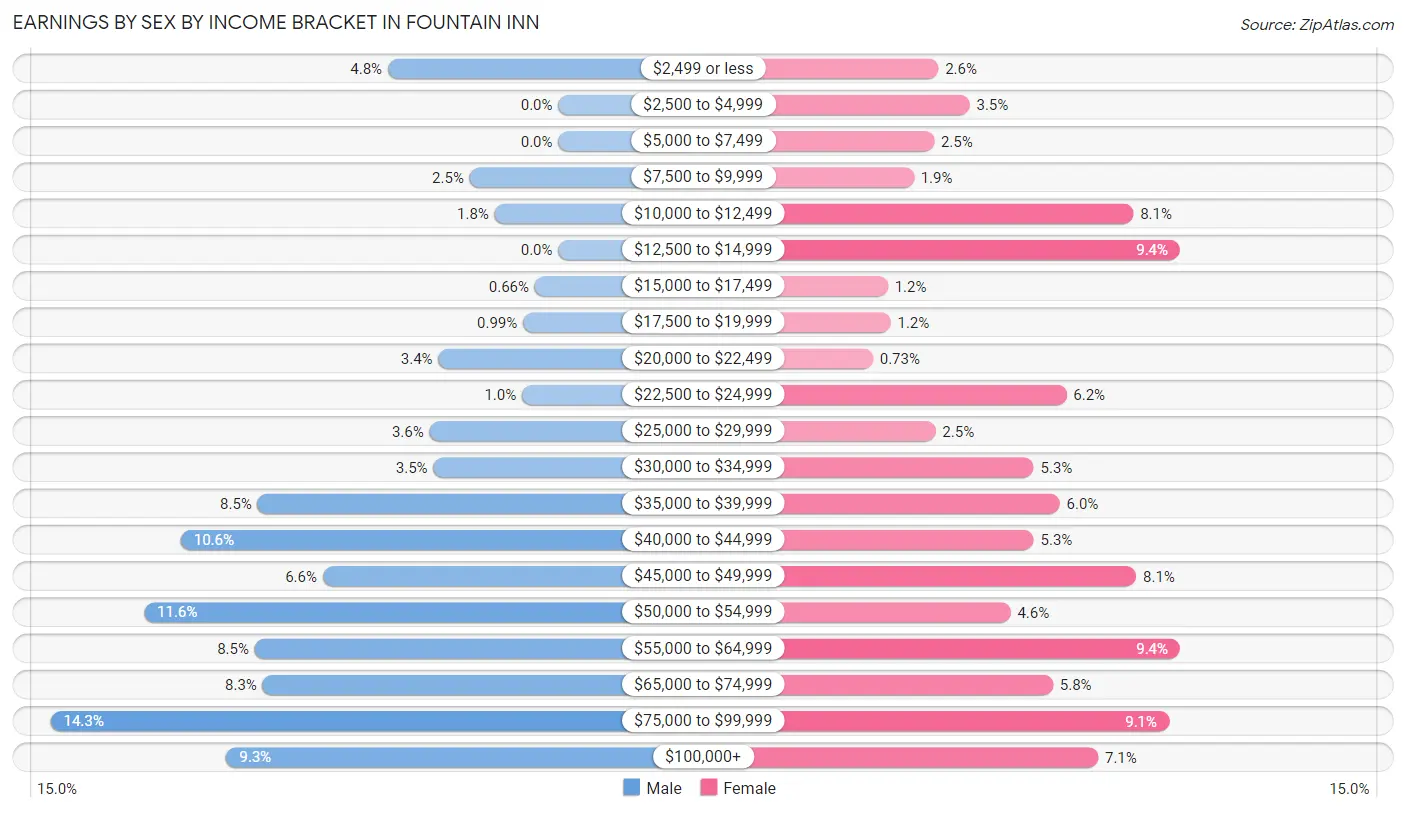
Earnings by Sex by Income Bracket in Fountain Inn
The most common earnings brackets in Fountain Inn are $75,000 to $99,999 for men (390 | 14.3%) and $12,500 to $14,999 for women (244 | 9.4%).
| Income | Male | Female |
| $2,499 or less | 131 (4.8%) | 67 (2.6%) |
| $2,500 to $4,999 | 0 (0.0%) | 90 (3.5%) |
| $5,000 to $7,499 | 0 (0.0%) | 64 (2.5%) |
| $7,500 to $9,999 | 68 (2.5%) | 49 (1.9%) |
| $10,000 to $12,499 | 49 (1.8%) | 210 (8.1%) |
| $12,500 to $14,999 | 0 (0.0%) | 244 (9.4%) |
| $15,000 to $17,499 | 18 (0.7%) | 30 (1.1%) |
| $17,500 to $19,999 | 27 (1.0%) | 32 (1.2%) |
| $20,000 to $22,499 | 92 (3.4%) | 19 (0.7%) |
| $22,500 to $24,999 | 28 (1.0%) | 161 (6.2%) |
| $25,000 to $29,999 | 99 (3.6%) | 65 (2.5%) |
| $30,000 to $34,999 | 96 (3.5%) | 137 (5.2%) |
| $35,000 to $39,999 | 231 (8.5%) | 156 (6.0%) |
| $40,000 to $44,999 | 290 (10.6%) | 137 (5.2%) |
| $45,000 to $49,999 | 181 (6.6%) | 212 (8.1%) |
| $50,000 to $54,999 | 318 (11.6%) | 120 (4.6%) |
| $55,000 to $64,999 | 233 (8.5%) | 244 (9.4%) |
| $65,000 to $74,999 | 227 (8.3%) | 151 (5.8%) |
| $75,000 to $99,999 | 390 (14.3%) | 236 (9.0%) |
| $100,000+ | 255 (9.3%) | 184 (7.1%) |
| Total | 2,733 (100.0%) | 2,608 (100.0%) |
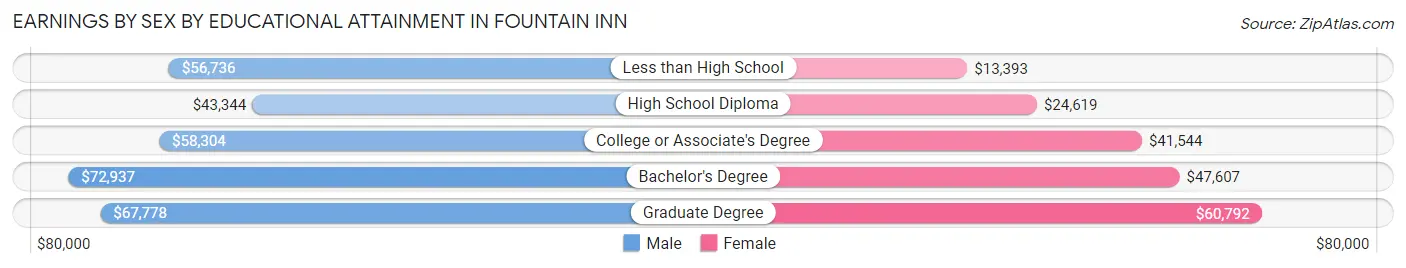
Earnings by Sex by Educational Attainment in Fountain Inn
Average earnings in Fountain Inn are $53,155 for men and $39,506 for women, a difference of 25.7%. Men with an educational attainment of bachelor's degree enjoy the highest average annual earnings of $72,937, while those with high school diploma education earn the least with $43,344. Women with an educational attainment of graduate degree earn the most with the average annual earnings of $60,792, while those with less than high school education have the smallest earnings of $13,393.
| Educational Attainment | Male Income | Female Income |
| Less than High School | $56,736 | $13,393 |
| High School Diploma | $43,344 | $24,619 |
| College or Associate's Degree | $58,304 | $41,544 |
| Bachelor's Degree | $72,937 | $47,607 |
| Graduate Degree | $67,778 | $60,792 |
| Total | $53,155 | $39,506 |
Family Income in Fountain Inn
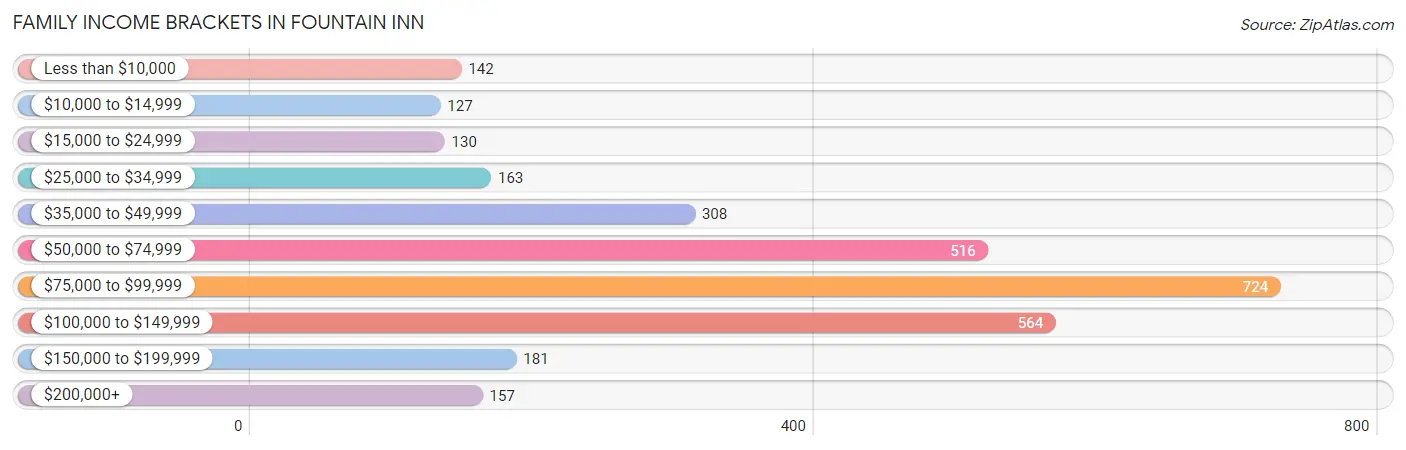
Family Income Brackets in Fountain Inn
According to the Fountain Inn family income data, there are 724 families falling into the $75,000 to $99,999 income range, which is the most common income bracket and makes up 24.0% of all families. Conversely, the $10,000 to $14,999 income bracket is the least frequent group with only 127 families (4.2%) belonging to this category.
| Income Bracket | # Families | % Families |
| Less than $10,000 | 142 | 4.7% |
| $10,000 to $14,999 | 127 | 4.2% |
| $15,000 to $24,999 | 130 | 4.3% |
| $25,000 to $34,999 | 163 | 5.4% |
| $35,000 to $49,999 | 308 | 10.2% |
| $50,000 to $74,999 | 516 | 17.1% |
| $75,000 to $99,999 | 724 | 24.0% |
| $100,000 to $149,999 | 564 | 18.7% |
| $150,000 to $199,999 | 181 | 6.0% |
| $200,000+ | 157 | 5.2% |
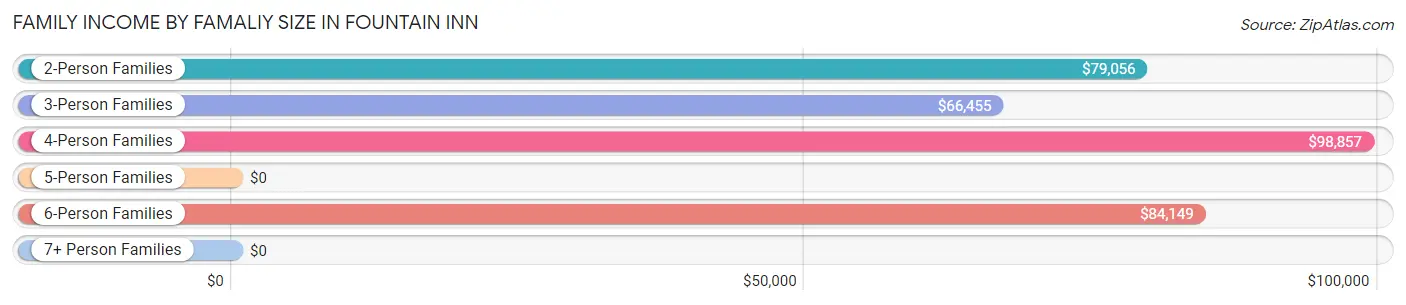
Family Income by Famaliy Size in Fountain Inn
4-person families (480 | 15.9%) account for the highest median family income in Fountain Inn with $98,857 per family, while 2-person families (1,370 | 45.4%) have the highest median income of $39,528 per family member.
| Income Bracket | # Families | Median Income |
| 2-Person Families | 1,370 (45.4%) | $79,056 |
| 3-Person Families | 808 (26.8%) | $66,455 |
| 4-Person Families | 480 (15.9%) | $98,857 |
| 5-Person Families | 251 (8.3%) | $0 |
| 6-Person Families | 103 (3.4%) | $84,149 |
| 7+ Person Families | 3 (0.1%) | $0 |
| Total | 3,015 (100.0%) | $79,670 |
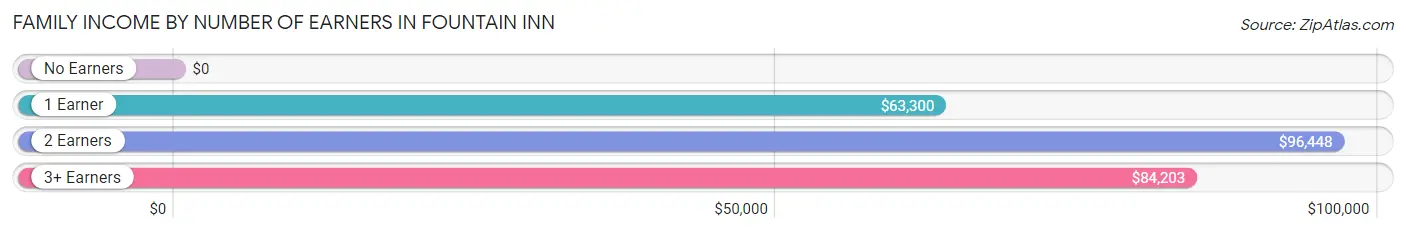
Family Income by Number of Earners in Fountain Inn
| Number of Earners | # Families | Median Income |
| No Earners | 274 (9.1%) | $0 |
| 1 Earner | 1,310 (43.4%) | $63,300 |
| 2 Earners | 1,337 (44.3%) | $96,448 |
| 3+ Earners | 94 (3.1%) | $84,203 |
| Total | 3,015 (100.0%) | $79,670 |
Household Income in Fountain Inn
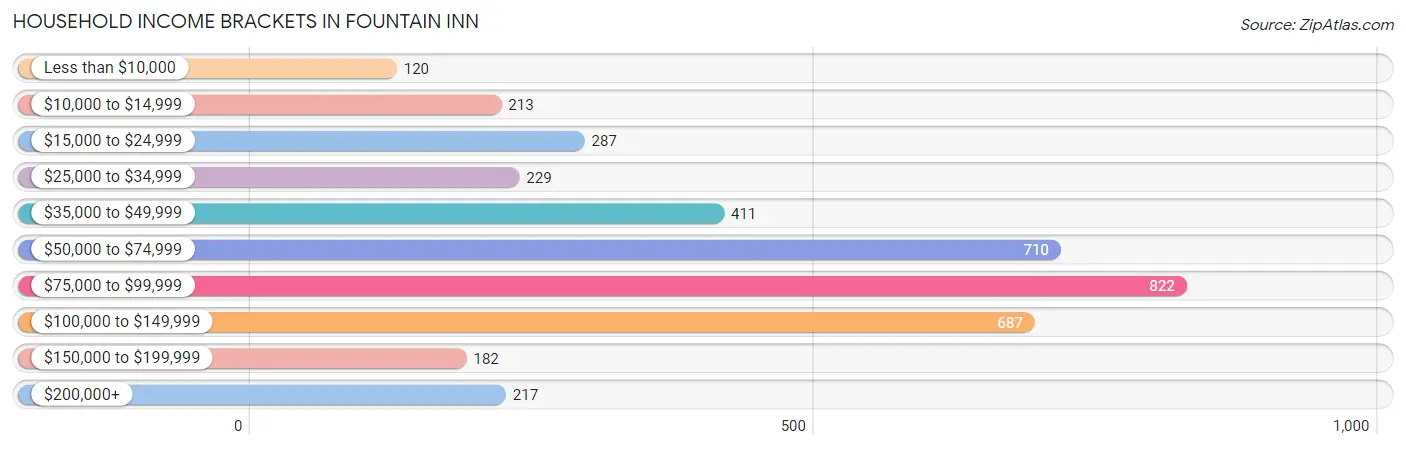
Household Income Brackets in Fountain Inn
With 822 households falling in the category, the $75,000 to $99,999 income range is the most frequent in Fountain Inn, accounting for 21.2% of all households. In contrast, only 120 households (3.1%) fall into the less than $10,000 income bracket, making it the least populous group.
| Income Bracket | # Households | % Households |
| Less than $10,000 | 120 | 3.1% |
| $10,000 to $14,999 | 213 | 5.5% |
| $15,000 to $24,999 | 287 | 7.4% |
| $25,000 to $34,999 | 229 | 5.9% |
| $35,000 to $49,999 | 411 | 10.6% |
| $50,000 to $74,999 | 710 | 18.3% |
| $75,000 to $99,999 | 822 | 21.2% |
| $100,000 to $149,999 | 687 | 17.7% |
| $150,000 to $199,999 | 182 | 4.7% |
| $200,000+ | 217 | 5.6% |
Household Income by Householder Age in Fountain Inn
The median household income in Fountain Inn is $73,665, with the highest median household income of $98,056 found in the 15 to 24 years age bracket for the primary householder. A total of 150 households (3.9%) fall into this category. Meanwhile, the 65+ years age bracket for the primary householder has the lowest median household income of $52,120, with 525 households (13.5%) in this group.
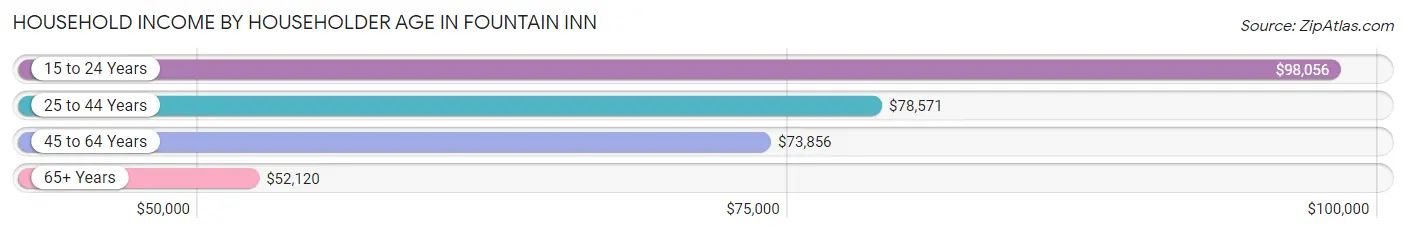
| Income Bracket | # Households | Median Income |
| 15 to 24 Years | 150 (3.9%) | $98,056 |
| 25 to 44 Years | 1,712 (44.1%) | $78,571 |
| 45 to 64 Years | 1,492 (38.5%) | $73,856 |
| 65+ Years | 525 (13.5%) | $52,120 |
| Total | 3,879 (100.0%) | $73,665 |
Poverty in Fountain Inn
Income Below Poverty by Sex and Age in Fountain Inn
With 16.7% poverty level for males and 14.0% for females among the residents of Fountain Inn, 25 to 34 year old males and 15 year old females are the most vulnerable to poverty, with 292 males (32.7%) and 9 females (33.3%) in their respective age groups living below the poverty level.
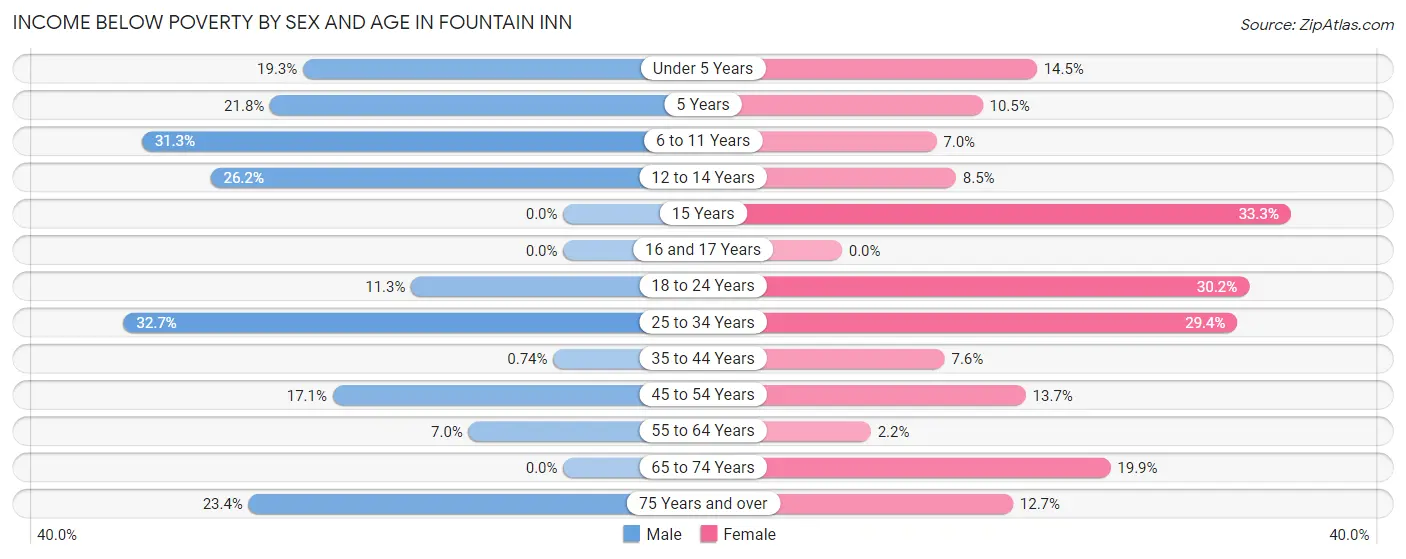
| Age Bracket | Male | Female |
| Under 5 Years | 108 (19.3%) | 55 (14.5%) |
| 5 Years | 32 (21.8%) | 7 (10.4%) |
| 6 to 11 Years | 169 (31.3%) | 42 (7.0%) |
| 12 to 14 Years | 33 (26.2%) | 20 (8.5%) |
| 15 Years | 0 (0.0%) | 9 (33.3%) |
| 16 and 17 Years | 0 (0.0%) | 0 (0.0%) |
| 18 to 24 Years | 48 (11.3%) | 62 (30.2%) |
| 25 to 34 Years | 292 (32.7%) | 323 (29.4%) |
| 35 to 44 Years | 6 (0.7%) | 62 (7.6%) |
| 45 to 54 Years | 107 (17.1%) | 71 (13.7%) |
| 55 to 64 Years | 39 (7.0%) | 17 (2.1%) |
| 65 to 74 Years | 0 (0.0%) | 66 (19.9%) |
| 75 Years and over | 32 (23.4%) | 24 (12.7%) |
| Total | 866 (16.7%) | 758 (14.0%) |
Income Above Poverty by Sex and Age in Fountain Inn
According to the poverty statistics in Fountain Inn, males aged 15 years and females aged 16 and 17 years are the age groups that are most secure financially, with 100.0% of males and 100.0% of females in these age groups living above the poverty line.
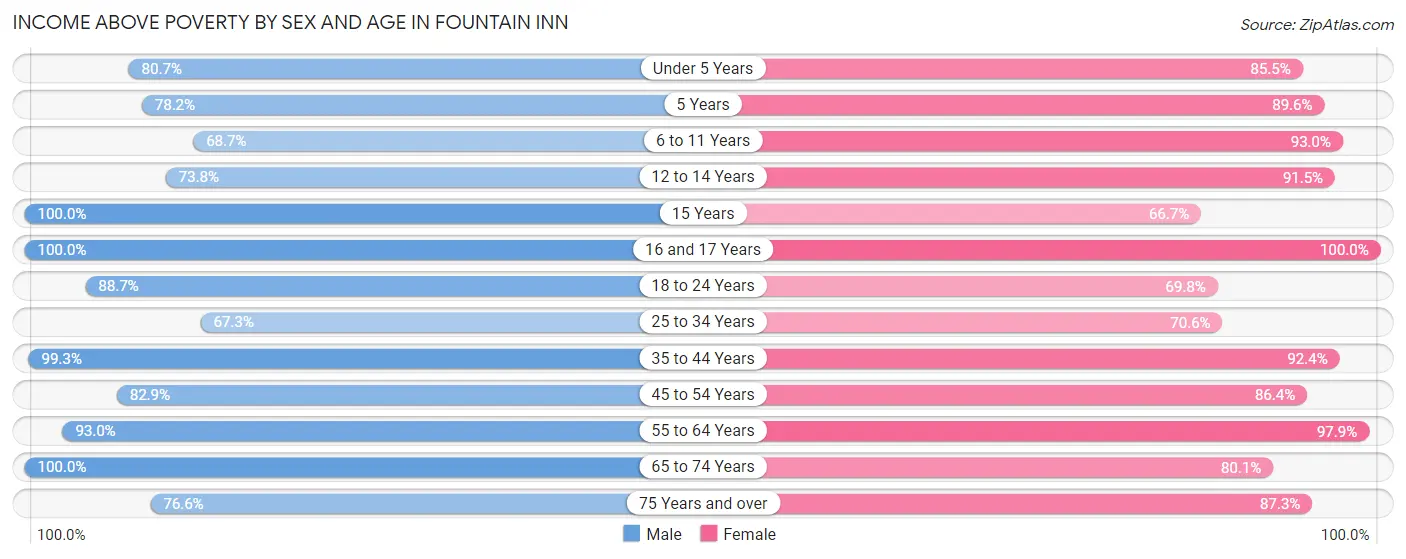
| Age Bracket | Male | Female |
| Under 5 Years | 451 (80.7%) | 325 (85.5%) |
| 5 Years | 115 (78.2%) | 60 (89.5%) |
| 6 to 11 Years | 371 (68.7%) | 556 (93.0%) |
| 12 to 14 Years | 93 (73.8%) | 216 (91.5%) |
| 15 Years | 39 (100.0%) | 18 (66.7%) |
| 16 and 17 Years | 68 (100.0%) | 155 (100.0%) |
| 18 to 24 Years | 377 (88.7%) | 143 (69.8%) |
| 25 to 34 Years | 602 (67.3%) | 777 (70.6%) |
| 35 to 44 Years | 802 (99.3%) | 751 (92.4%) |
| 45 to 54 Years | 518 (82.9%) | 449 (86.4%) |
| 55 to 64 Years | 516 (93.0%) | 773 (97.9%) |
| 65 to 74 Years | 251 (100.0%) | 265 (80.1%) |
| 75 Years and over | 105 (76.6%) | 165 (87.3%) |
| Total | 4,308 (83.3%) | 4,653 (86.0%) |
Income Below Poverty Among Married-Couple Families in Fountain Inn
The poverty statistics for married-couple families in Fountain Inn show that 2.5% or 53 of the total 2,089 families live below the poverty line. Families with no children have the highest poverty rate of 3.7%, comprising of 36 families. On the other hand, families with 5 or more children have the lowest poverty rate of 0.0%, which includes 0 families.
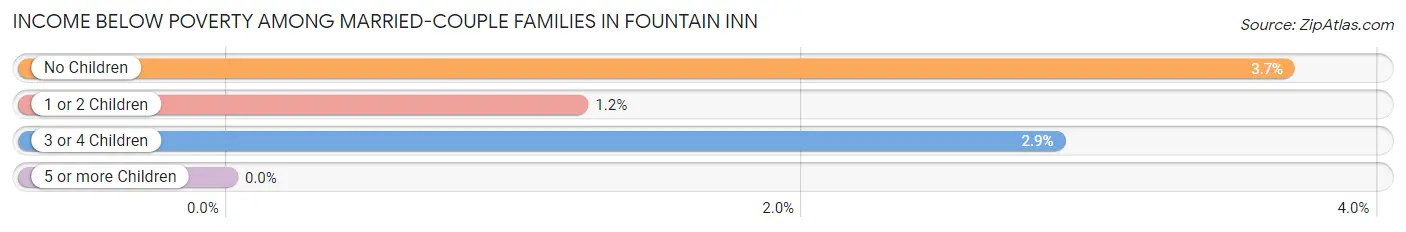
| Children | Above Poverty | Below Poverty |
| No Children | 943 (96.3%) | 36 (3.7%) |
| 1 or 2 Children | 888 (98.8%) | 11 (1.2%) |
| 3 or 4 Children | 202 (97.1%) | 6 (2.9%) |
| 5 or more Children | 3 (100.0%) | 0 (0.0%) |
| Total | 2,036 (97.5%) | 53 (2.5%) |
Income Below Poverty Among Single-Parent Households in Fountain Inn
According to the poverty data in Fountain Inn, 48.4% or 104 single-father households and 36.4% or 259 single-mother households are living below the poverty line. Among single-father households, those with 1 or 2 children have the highest poverty rate, with 44 households (50.6%) experiencing poverty. Likewise, among single-mother households, those with 3 or 4 children have the highest poverty rate, with 68 households (74.7%) falling below the poverty line.
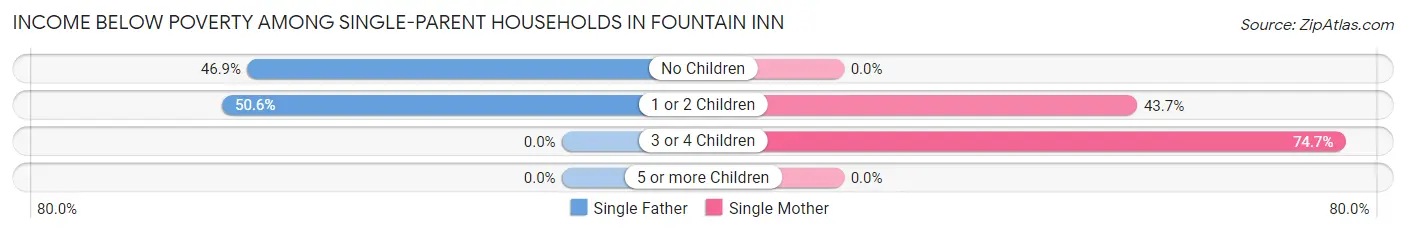
| Children | Single Father | Single Mother |
| No Children | 60 (46.9%) | 0 (0.0%) |
| 1 or 2 Children | 44 (50.6%) | 191 (43.7%) |
| 3 or 4 Children | 0 (0.0%) | 68 (74.7%) |
| 5 or more Children | 0 (0.0%) | 0 (0.0%) |
| Total | 104 (48.4%) | 259 (36.4%) |
Income Below Poverty Among Married-Couple vs Single-Parent Households in Fountain Inn
The poverty data for Fountain Inn shows that 53 of the married-couple family households (2.5%) and 363 of the single-parent households (39.2%) are living below the poverty level. Within the married-couple family households, those with no children have the highest poverty rate, with 36 households (3.7%) falling below the poverty line. Among the single-parent households, those with 3 or 4 children have the highest poverty rate, with 68 household (74.7%) living below poverty.
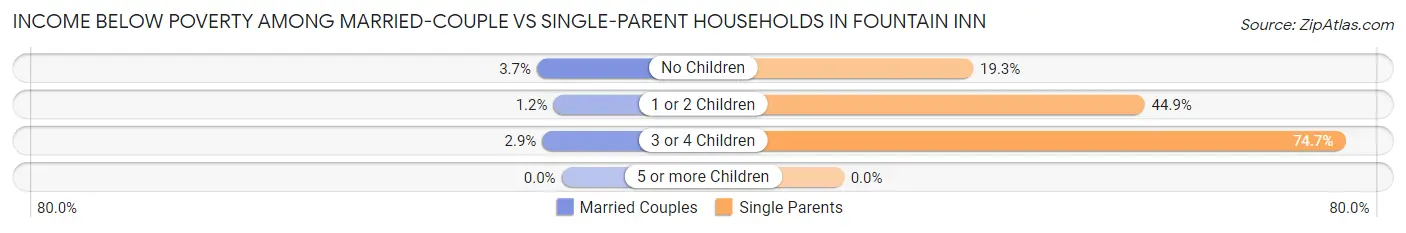
| Children | Married-Couple Families | Single-Parent Households |
| No Children | 36 (3.7%) | 60 (19.3%) |
| 1 or 2 Children | 11 (1.2%) | 235 (44.9%) |
| 3 or 4 Children | 6 (2.9%) | 68 (74.7%) |
| 5 or more Children | 0 (0.0%) | 0 (0.0%) |
| Total | 53 (2.5%) | 363 (39.2%) |
Race in Fountain Inn
The most populous races in Fountain Inn are White / Caucasian (6,319 | 59.2%), Black / African American (3,055 | 28.6%), and Two or more Races (1,178 | 11.0%).
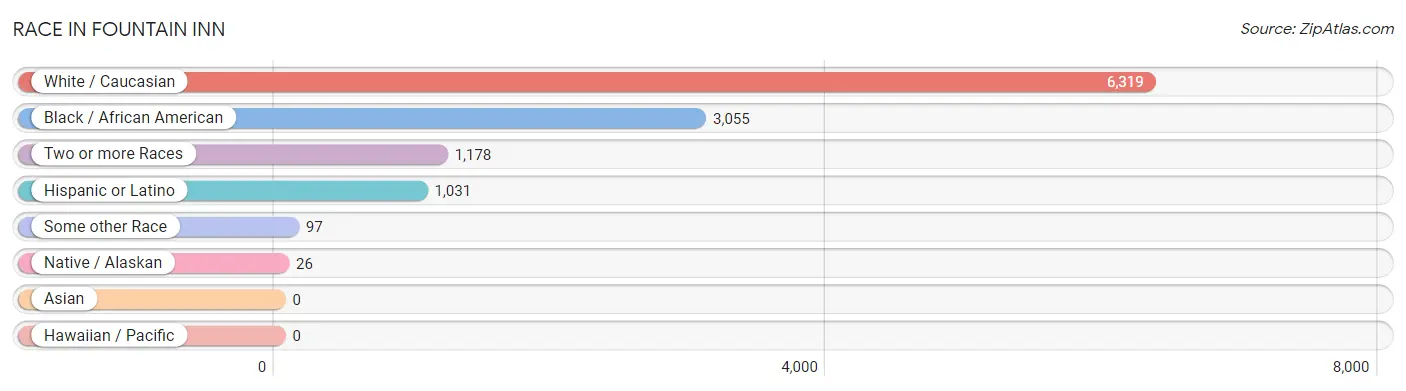
| Race | # Population | % Population |
| Asian | 0 | 0.0% |
| Black / African American | 3,055 | 28.6% |
| Hawaiian / Pacific | 0 | 0.0% |
| Hispanic or Latino | 1,031 | 9.7% |
| Native / Alaskan | 26 | 0.2% |
| White / Caucasian | 6,319 | 59.2% |
| Two or more Races | 1,178 | 11.0% |
| Some other Race | 97 | 0.9% |
| Total | 10,675 | 100.0% |
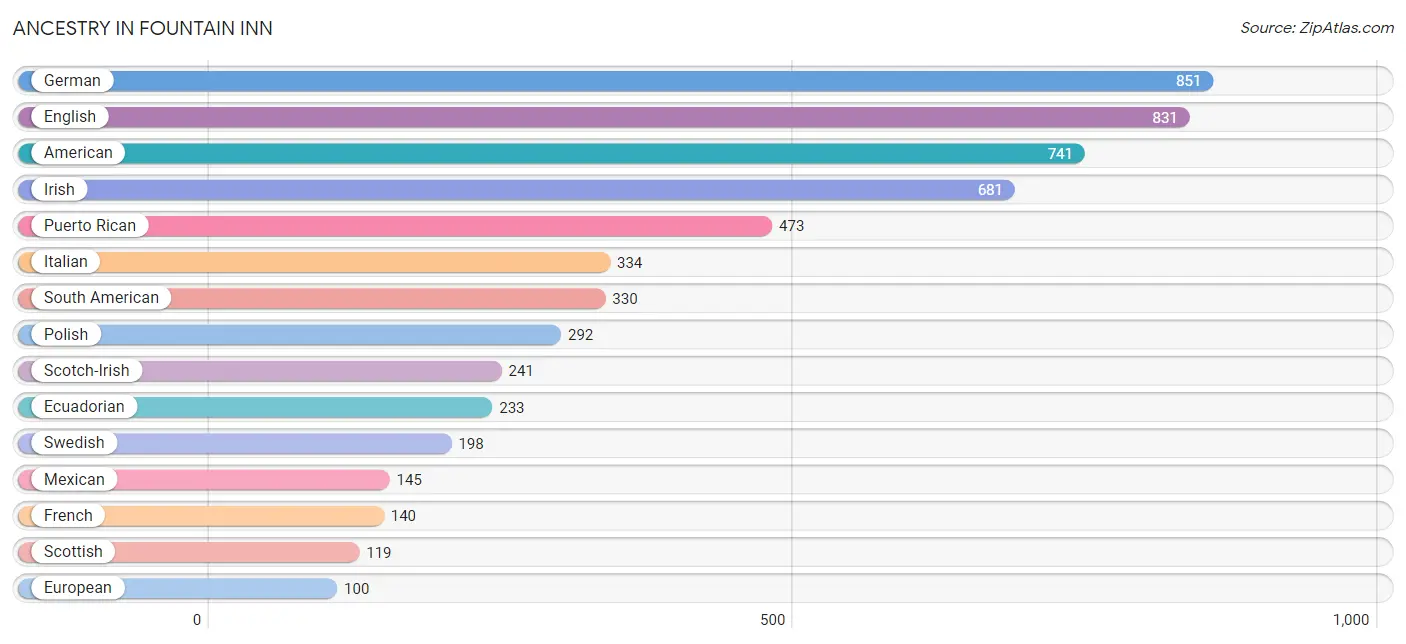
Ancestry in Fountain Inn
The most populous ancestries reported in Fountain Inn are German (851 | 8.0%), English (831 | 7.8%), American (741 | 6.9%), Irish (681 | 6.4%), and Puerto Rican (473 | 4.4%), together accounting for 33.5% of all Fountain Inn residents.
| Ancestry | # Population | % Population |
| African | 31 | 0.3% |
| American | 741 | 6.9% |
| Arab | 32 | 0.3% |
| Australian | 9 | 0.1% |
| Austrian | 43 | 0.4% |
| Bhutanese | 14 | 0.1% |
| Blackfeet | 10 | 0.1% |
| British | 89 | 0.8% |
| Central American | 20 | 0.2% |
| Central American Indian | 44 | 0.4% |
| Cherokee | 10 | 0.1% |
| Choctaw | 3 | 0.0% |
| Colombian | 81 | 0.8% |
| Creek | 17 | 0.2% |
| Cuban | 47 | 0.4% |
| Czech | 23 | 0.2% |
| Danish | 13 | 0.1% |
| Dutch | 38 | 0.4% |
| Eastern European | 20 | 0.2% |
| Ecuadorian | 233 | 2.2% |
| English | 831 | 7.8% |
| European | 100 | 0.9% |
| French | 140 | 1.3% |
| French Canadian | 20 | 0.2% |
| German | 851 | 8.0% |
| Greek | 40 | 0.4% |
| Haitian | 22 | 0.2% |
| Honduran | 3 | 0.0% |
| Hungarian | 45 | 0.4% |
| Indian (Asian) | 45 | 0.4% |
| Irish | 681 | 6.4% |
| Italian | 334 | 3.1% |
| Korean | 38 | 0.4% |
| Lebanese | 32 | 0.3% |
| Mexican | 145 | 1.4% |
| Nigerian | 56 | 0.5% |
| Northern European | 28 | 0.3% |
| Norwegian | 36 | 0.3% |
| Panamanian | 17 | 0.2% |
| Polish | 292 | 2.7% |
| Portuguese | 17 | 0.2% |
| Puerto Rican | 473 | 4.4% |
| Scandinavian | 13 | 0.1% |
| Scotch-Irish | 241 | 2.3% |
| Scottish | 119 | 1.1% |
| South American | 330 | 3.1% |
| Subsaharan African | 87 | 0.8% |
| Swedish | 198 | 1.8% |
| Swiss | 22 | 0.2% |
| Syrian | 32 | 0.3% |
| Ukrainian | 8 | 0.1% |
| Venezuelan | 16 | 0.2% |
| Welsh | 32 | 0.3% | View All 53 Rows |
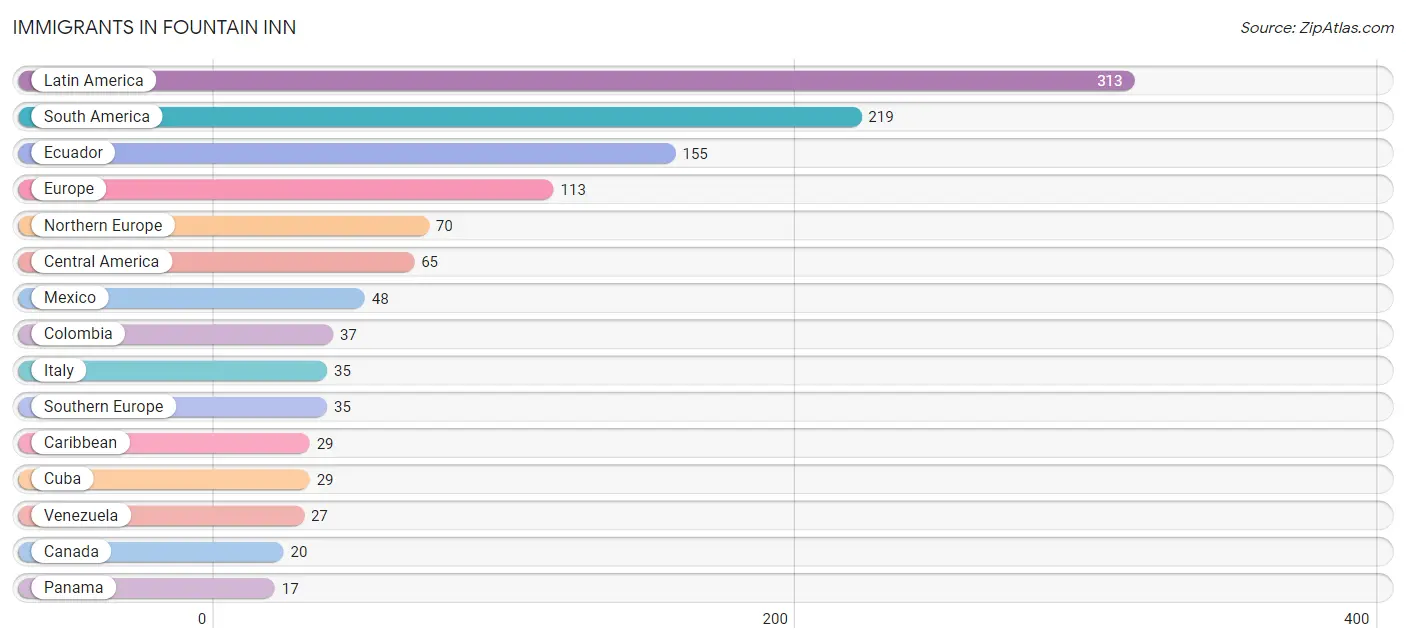
Immigrants in Fountain Inn
The most numerous immigrant groups reported in Fountain Inn came from Latin America (313 | 2.9%), South America (219 | 2.1%), Ecuador (155 | 1.5%), Europe (113 | 1.1%), and Northern Europe (70 | 0.7%), together accounting for 8.1% of all Fountain Inn residents.
| Immigration Origin | # Population | % Population |
| Australia | 9 | 0.1% |
| Canada | 20 | 0.2% |
| Caribbean | 29 | 0.3% |
| Central America | 65 | 0.6% |
| Colombia | 37 | 0.4% |
| Cuba | 29 | 0.3% |
| Eastern Europe | 8 | 0.1% |
| Ecuador | 155 | 1.5% |
| Europe | 113 | 1.1% |
| Italy | 35 | 0.3% |
| Latin America | 313 | 2.9% |
| Mexico | 48 | 0.4% |
| Northern Europe | 70 | 0.7% |
| Oceania | 9 | 0.1% |
| Panama | 17 | 0.2% |
| South America | 219 | 2.1% |
| Southern Europe | 35 | 0.3% |
| Ukraine | 8 | 0.1% |
| Venezuela | 27 | 0.3% | View All 19 Rows |
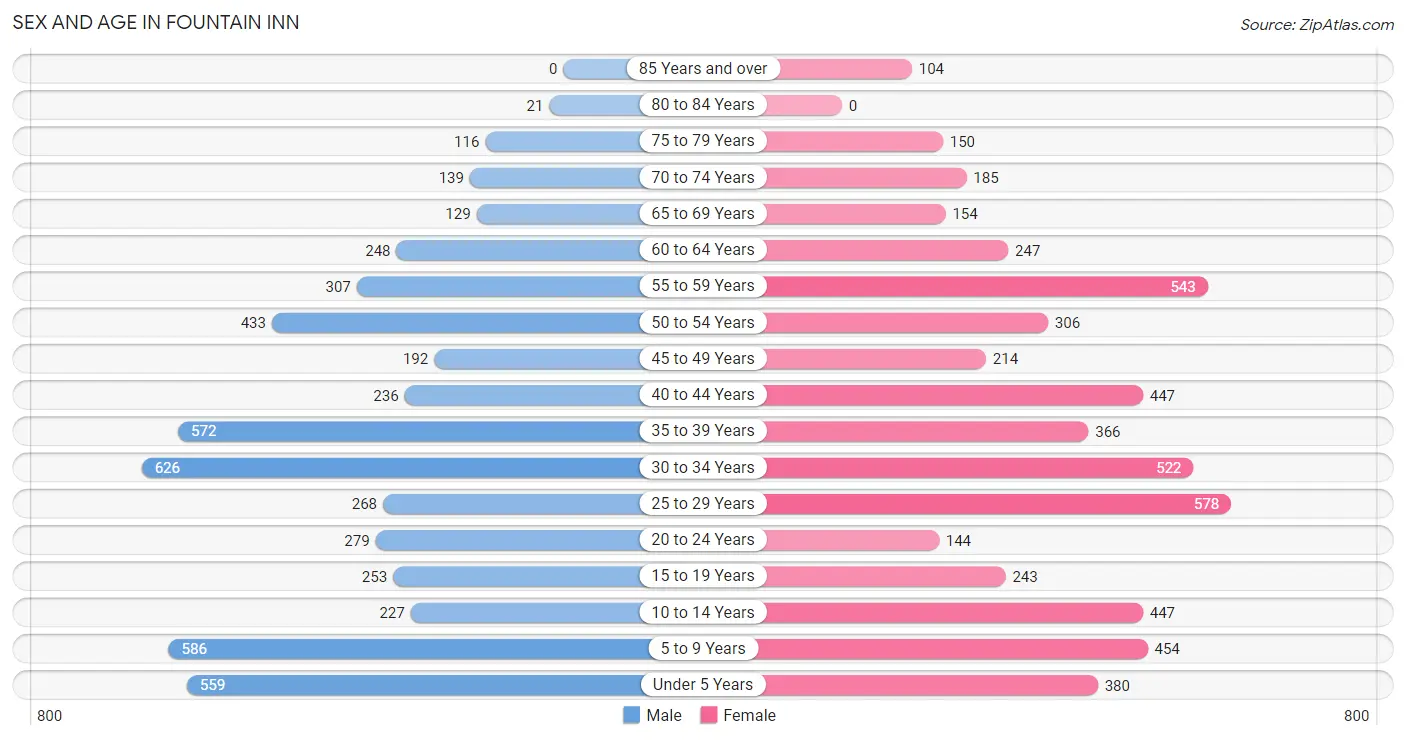
Sex and Age in Fountain Inn
Sex and Age in Fountain Inn
The most populous age groups in Fountain Inn are 30 to 34 Years (626 | 12.1%) for men and 25 to 29 Years (578 | 10.5%) for women.
| Age Bracket | Male | Female |
| Under 5 Years | 559 (10.8%) | 380 (6.9%) |
| 5 to 9 Years | 586 (11.3%) | 454 (8.3%) |
| 10 to 14 Years | 227 (4.4%) | 447 (8.2%) |
| 15 to 19 Years | 253 (4.9%) | 243 (4.4%) |
| 20 to 24 Years | 279 (5.4%) | 144 (2.6%) |
| 25 to 29 Years | 268 (5.2%) | 578 (10.5%) |
| 30 to 34 Years | 626 (12.1%) | 522 (9.5%) |
| 35 to 39 Years | 572 (11.0%) | 366 (6.7%) |
| 40 to 44 Years | 236 (4.5%) | 447 (8.2%) |
| 45 to 49 Years | 192 (3.7%) | 214 (3.9%) |
| 50 to 54 Years | 433 (8.3%) | 306 (5.6%) |
| 55 to 59 Years | 307 (5.9%) | 543 (9.9%) |
| 60 to 64 Years | 248 (4.8%) | 247 (4.5%) |
| 65 to 69 Years | 129 (2.5%) | 154 (2.8%) |
| 70 to 74 Years | 139 (2.7%) | 185 (3.4%) |
| 75 to 79 Years | 116 (2.2%) | 150 (2.7%) |
| 80 to 84 Years | 21 (0.4%) | 0 (0.0%) |
| 85 Years and over | 0 (0.0%) | 104 (1.9%) |
| Total | 5,191 (100.0%) | 5,484 (100.0%) |
Families and Households in Fountain Inn
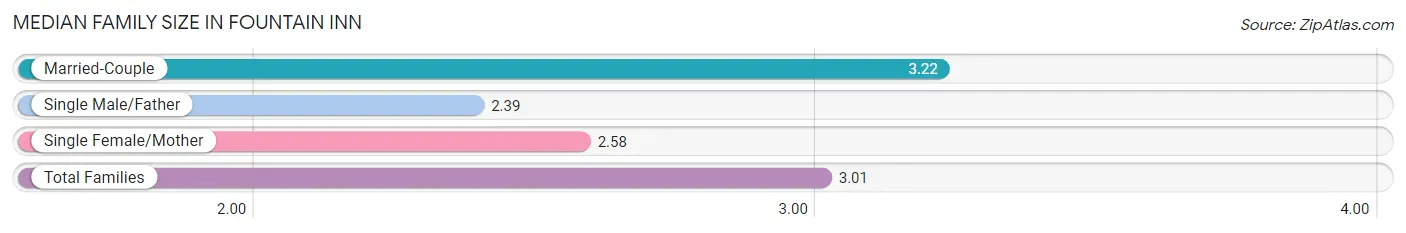
Median Family Size in Fountain Inn
The median family size in Fountain Inn is 3.01 persons per family, with married-couple families (2,089 | 69.3%) accounting for the largest median family size of 3.22 persons per family. On the other hand, single male/father families (215 | 7.1%) represent the smallest median family size with 2.39 persons per family.
| Family Type | # Families | Family Size |
| Married-Couple | 2,089 (69.3%) | 3.22 |
| Single Male/Father | 215 (7.1%) | 2.39 |
| Single Female/Mother | 711 (23.6%) | 2.58 |
| Total Families | 3,015 (100.0%) | 3.01 |
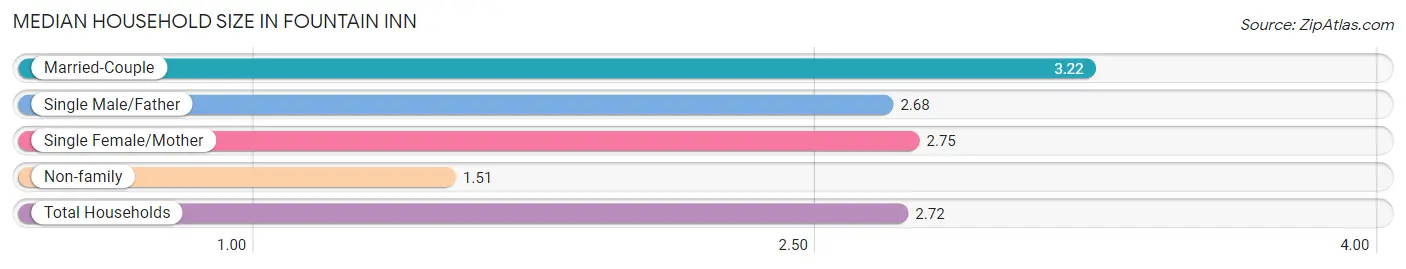
Median Household Size in Fountain Inn
The median household size in Fountain Inn is 2.72 persons per household, with married-couple households (2,089 | 53.8%) accounting for the largest median household size of 3.22 persons per household. non-family households (864 | 22.3%) represent the smallest median household size with 1.51 persons per household.
| Household Type | # Households | Household Size |
| Married-Couple | 2,089 (53.8%) | 3.22 |
| Single Male/Father | 215 (5.5%) | 2.68 |
| Single Female/Mother | 711 (18.3%) | 2.75 |
| Non-family | 864 (22.3%) | 1.51 |
| Total Households | 3,879 (100.0%) | 2.72 |
Household Size by Marriage Status in Fountain Inn
Out of a total of 3,879 households in Fountain Inn, 3,015 (77.7%) are family households, while 864 (22.3%) are nonfamily households. The most numerous type of family households are 2-person households, comprising 1,266, and the most common type of nonfamily households are 1-person households, comprising 591.
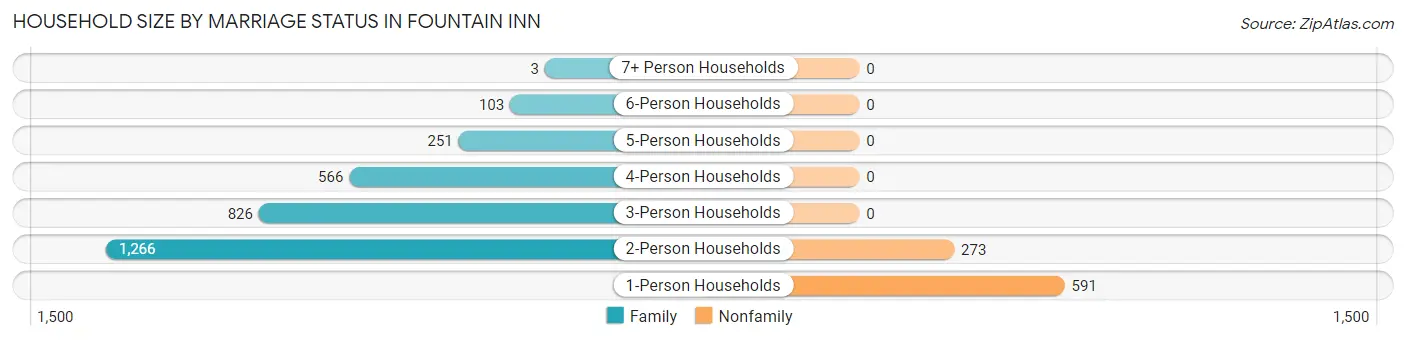
| Household Size | Family Households | Nonfamily Households |
| 1-Person Households | - | 591 (15.2%) |
| 2-Person Households | 1,266 (32.6%) | 273 (7.0%) |
| 3-Person Households | 826 (21.3%) | 0 (0.0%) |
| 4-Person Households | 566 (14.6%) | 0 (0.0%) |
| 5-Person Households | 251 (6.5%) | 0 (0.0%) |
| 6-Person Households | 103 (2.7%) | 0 (0.0%) |
| 7+ Person Households | 3 (0.1%) | 0 (0.0%) |
| Total | 3,015 (77.7%) | 864 (22.3%) |
Female Fertility in Fountain Inn
Fertility by Age in Fountain Inn
Average fertility rate in Fountain Inn is 97.0 births per 1,000 women. Women in the age bracket of 20 to 34 years have the highest fertility rate with 195.0 births per 1,000 women. Women in the age bracket of 20 to 34 years acount for 96.8% of all women with births.
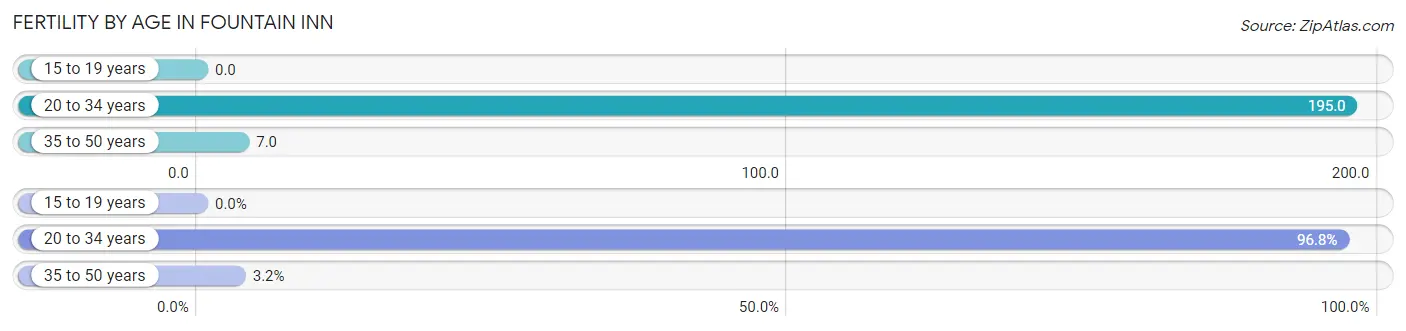
| Age Bracket | Women with Births | Births / 1,000 Women |
| 15 to 19 years | 0 (0.0%) | 0.0 |
| 20 to 34 years | 242 (96.8%) | 195.0 |
| 35 to 50 years | 8 (3.2%) | 7.0 |
| Total | 250 (100.0%) | 97.0 |
Fertility by Age by Marriage Status in Fountain Inn
78.4% of women with births (250) in Fountain Inn are married. The highest percentage of unmarried women with births falls into 20 to 34 years age bracket with 22.3% of them unmarried at the time of birth, while the lowest percentage of unmarried women with births belong to 35 to 50 years age bracket with 0.0% of them unmarried.
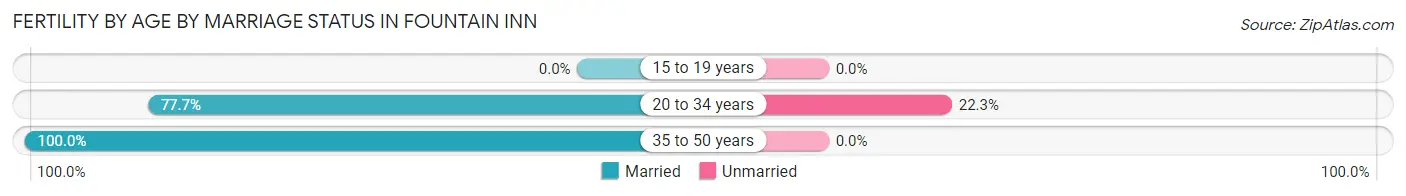
| Age Bracket | Married | Unmarried |
| 15 to 19 years | 0 (0.0%) | 0 (0.0%) |
| 20 to 34 years | 188 (77.7%) | 54 (22.3%) |
| 35 to 50 years | 8 (100.0%) | 0 (0.0%) |
| Total | 196 (78.4%) | 54 (21.6%) |
Fertility by Education in Fountain Inn
Average fertility rate in Fountain Inn is 97.0 births per 1,000 women. Women with the education attainment of less than high school have the highest fertility rate of 151.0 births per 1,000 women, while women with the education attainment of high school diploma have the lowest fertility at 57.0 births per 1,000 women. Women with the education attainment of college or associate's degree represent 29.2% of all women with births.
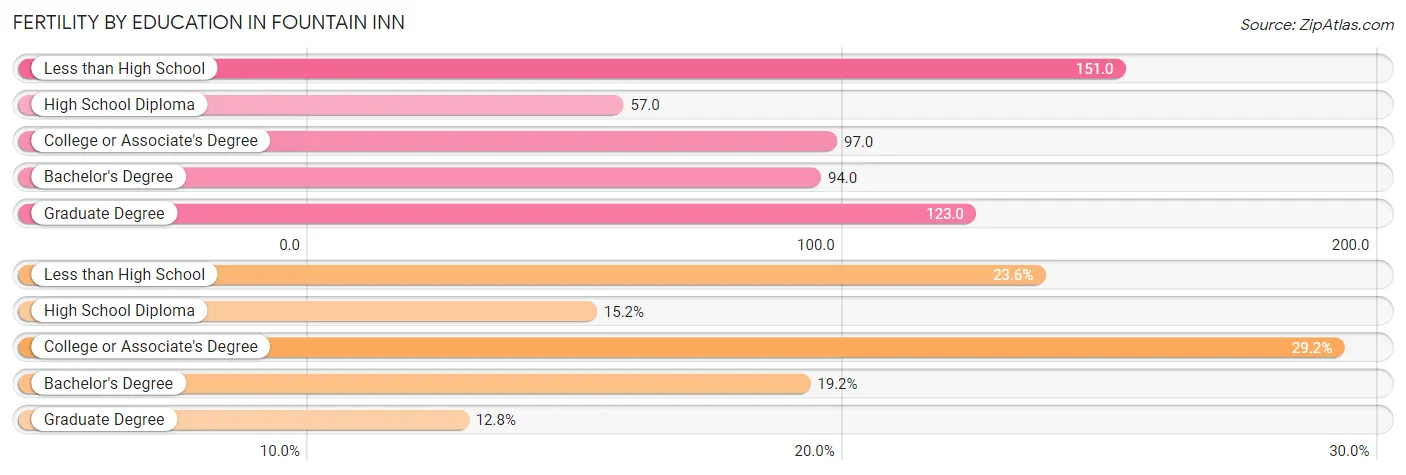
| Educational Attainment | Women with Births | Births / 1,000 Women |
| Less than High School | 59 (23.6%) | 151.0 |
| High School Diploma | 38 (15.2%) | 57.0 |
| College or Associate's Degree | 73 (29.2%) | 97.0 |
| Bachelor's Degree | 48 (19.2%) | 94.0 |
| Graduate Degree | 32 (12.8%) | 123.0 |
| Total | 250 (100.0%) | 97.0 |
Fertility by Education by Marriage Status in Fountain Inn
21.6% of women with births in Fountain Inn are unmarried. Women with the educational attainment of less than high school are most likely to be married with 100.0% of them married at childbirth, while women with the educational attainment of high school diploma are least likely to be married with 100.0% of them unmarried at childbirth.
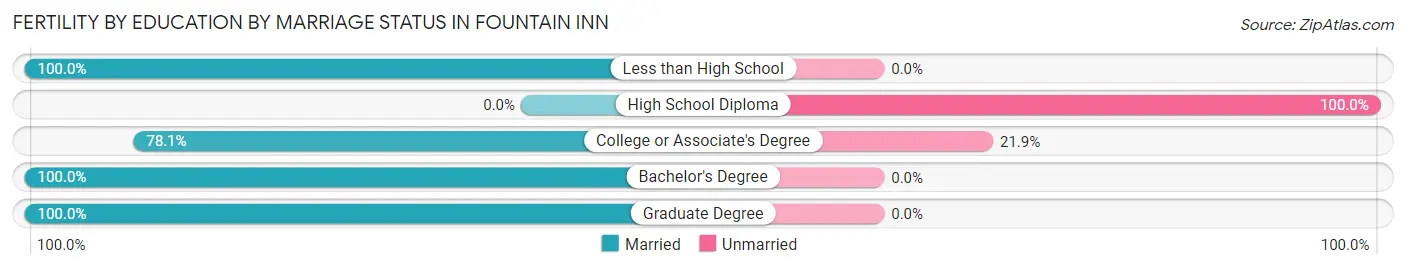
| Educational Attainment | Married | Unmarried |
| Less than High School | 59 (100.0%) | 0 (0.0%) |
| High School Diploma | 0 (0.0%) | 38 (100.0%) |
| College or Associate's Degree | 57 (78.1%) | 16 (21.9%) |
| Bachelor's Degree | 48 (100.0%) | 0 (0.0%) |
| Graduate Degree | 32 (100.0%) | 0 (0.0%) |
| Total | 196 (78.4%) | 54 (21.6%) |
Employment Characteristics in Fountain Inn
Employment by Class of Employer in Fountain Inn
Among the 4,750 employed individuals in Fountain Inn, private company employees (3,212 | 67.6%), not-for-profit organizations (488 | 10.3%), and local government employees (425 | 8.9%) make up the most common classes of employment.
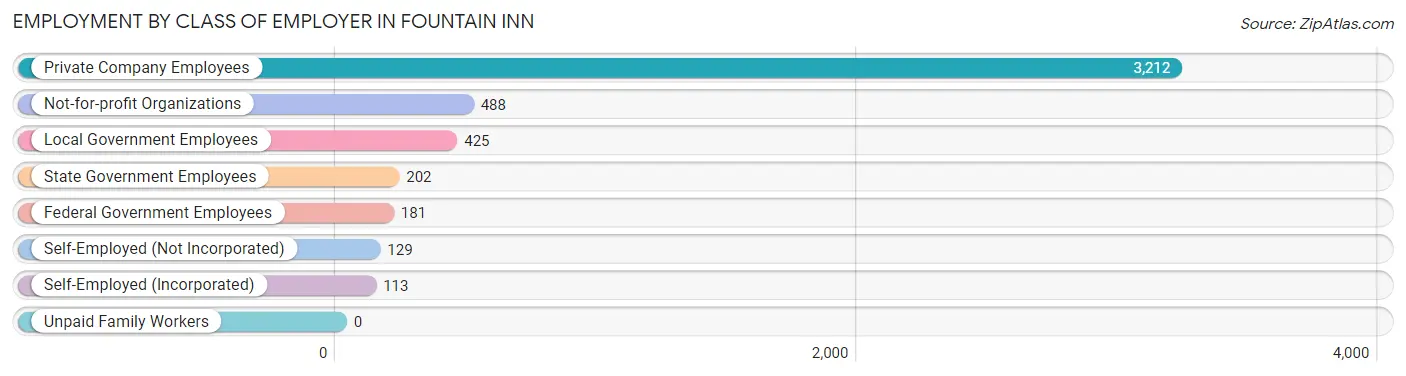
| Employer Class | # Employees | % Employees |
| Private Company Employees | 3,212 | 67.6% |
| Self-Employed (Incorporated) | 113 | 2.4% |
| Self-Employed (Not Incorporated) | 129 | 2.7% |
| Not-for-profit Organizations | 488 | 10.3% |
| Local Government Employees | 425 | 8.9% |
| State Government Employees | 202 | 4.3% |
| Federal Government Employees | 181 | 3.8% |
| Unpaid Family Workers | 0 | 0.0% |
| Total | 4,750 | 100.0% |
Employment Status by Age in Fountain Inn
According to the labor force statistics for Fountain Inn, out of the total population over 16 years of age (7,956), 67.1% or 5,338 individuals are in the labor force, with 9.6% or 512 of them unemployed. The age group with the highest labor force participation rate is 35 to 44 years, with 92.5% or 1,499 individuals in the labor force. Within the labor force, the 30 to 34 years age range has the highest percentage of unemployed individuals, with 29.5% or 266 of them being unemployed.
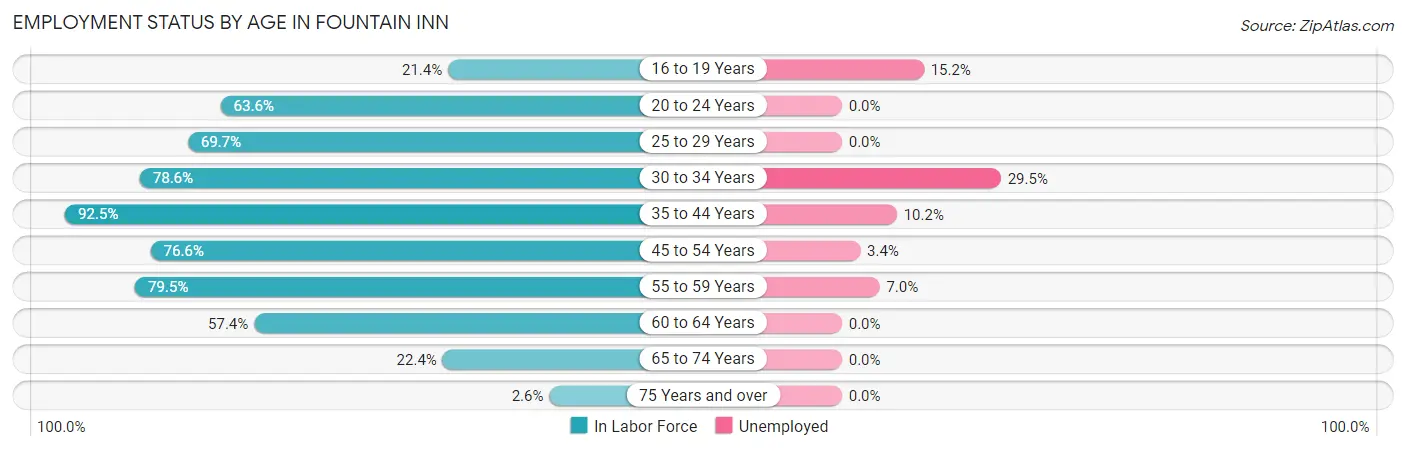
| Age Bracket | In Labor Force | Unemployed |
| 16 to 19 Years | 92 (21.4%) | 14 (15.2%) |
| 20 to 24 Years | 269 (63.6%) | 0 (0.0%) |
| 25 to 29 Years | 590 (69.7%) | 0 (0.0%) |
| 30 to 34 Years | 902 (78.6%) | 266 (29.5%) |
| 35 to 44 Years | 1,499 (92.5%) | 153 (10.2%) |
| 45 to 54 Years | 877 (76.6%) | 30 (3.4%) |
| 55 to 59 Years | 676 (79.5%) | 47 (7.0%) |
| 60 to 64 Years | 284 (57.4%) | 0 (0.0%) |
| 65 to 74 Years | 136 (22.4%) | 0 (0.0%) |
| 75 Years and over | 10 (2.6%) | 0 (0.0%) |
| Total | 5,338 (67.1%) | 512 (9.6%) |
Employment Status by Educational Attainment in Fountain Inn
According to labor force statistics for Fountain Inn, 79.1% of individuals (4,829) out of the total population between 25 and 64 years of age (6,105) are in the labor force, with 10.3% or 497 of them being unemployed. The group with the highest labor force participation rate are those with the educational attainment of bachelor's degree or higher, with 88.4% or 1,687 individuals in the labor force. Within the labor force, individuals with high school diploma education have the highest percentage of unemployment, with 30.6% or 413 of them being unemployed.
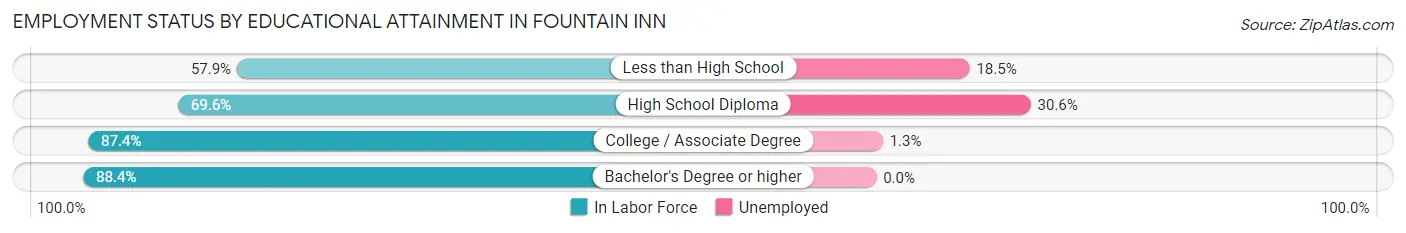
| Educational Attainment | In Labor Force | Unemployed |
| Less than High School | 351 (57.9%) | 112 (18.5%) |
| High School Diploma | 1,349 (69.6%) | 593 (30.6%) |
| College / Associate Degree | 1,445 (87.4%) | 21 (1.3%) |
| Bachelor's Degree or higher | 1,687 (88.4%) | 0 (0.0%) |
| Total | 4,829 (79.1%) | 629 (10.3%) |
Employment Occupations by Sex in Fountain Inn
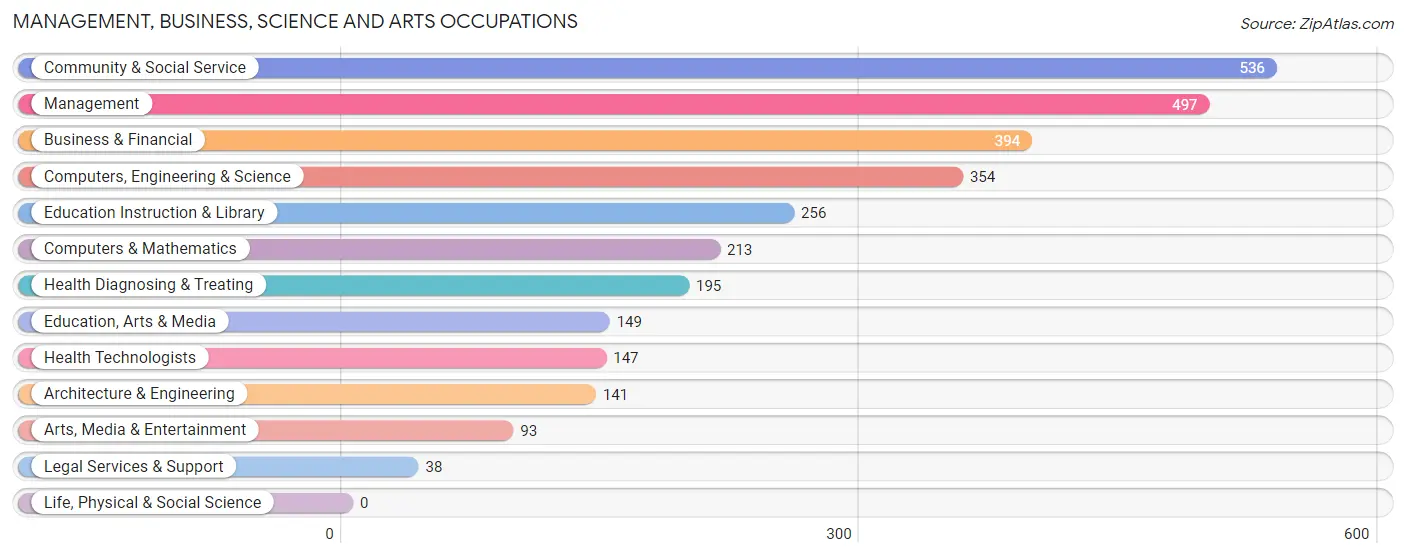
Management, Business, Science and Arts Occupations
The most common Management, Business, Science and Arts occupations in Fountain Inn are Community & Social Service (536 | 11.1%), Management (497 | 10.3%), Business & Financial (394 | 8.2%), Computers, Engineering & Science (354 | 7.3%), and Education Instruction & Library (256 | 5.3%).
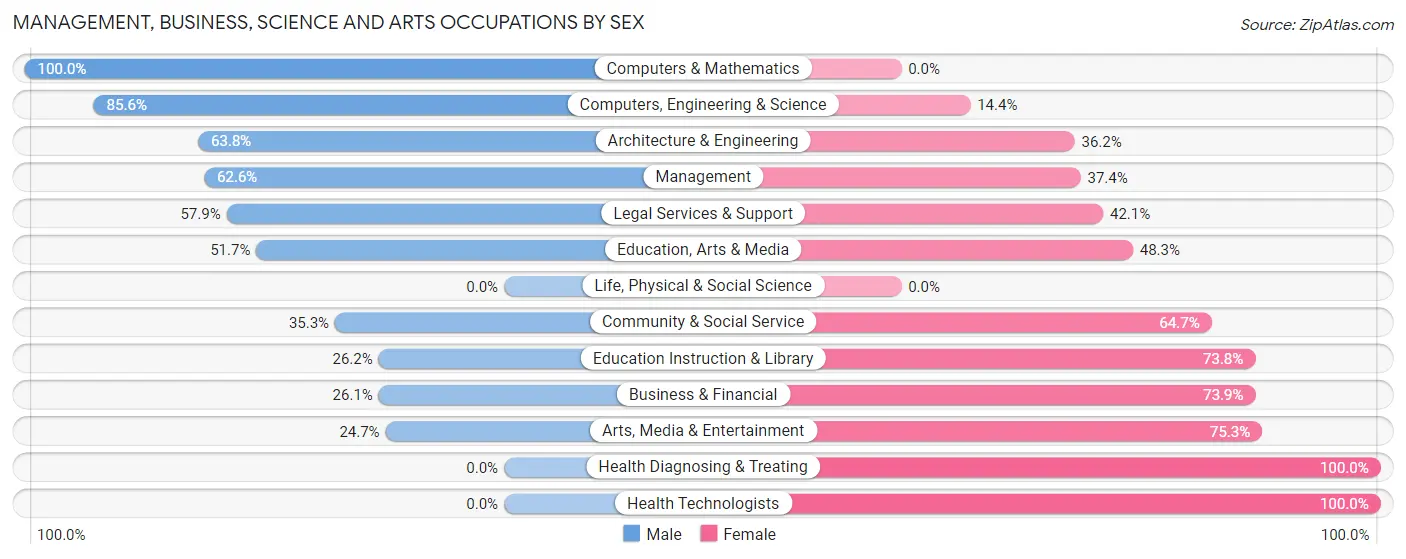
Management, Business, Science and Arts Occupations by Sex
Within the Management, Business, Science and Arts occupations in Fountain Inn, the most male-oriented occupations are Computers & Mathematics (100.0%), Computers, Engineering & Science (85.6%), and Architecture & Engineering (63.8%), while the most female-oriented occupations are Health Diagnosing & Treating (100.0%), Health Technologists (100.0%), and Arts, Media & Entertainment (75.3%).
| Occupation | Male | Female |
| Management | 311 (62.6%) | 186 (37.4%) |
| Business & Financial | 103 (26.1%) | 291 (73.9%) |
| Computers, Engineering & Science | 303 (85.6%) | 51 (14.4%) |
| Computers & Mathematics | 213 (100.0%) | 0 (0.0%) |
| Architecture & Engineering | 90 (63.8%) | 51 (36.2%) |
| Life, Physical & Social Science | 0 (0.0%) | 0 (0.0%) |
| Community & Social Service | 189 (35.3%) | 347 (64.7%) |
| Education, Arts & Media | 77 (51.7%) | 72 (48.3%) |
| Legal Services & Support | 22 (57.9%) | 16 (42.1%) |
| Education Instruction & Library | 67 (26.2%) | 189 (73.8%) |
| Arts, Media & Entertainment | 23 (24.7%) | 70 (75.3%) |
| Health Diagnosing & Treating | 0 (0.0%) | 195 (100.0%) |
| Health Technologists | 0 (0.0%) | 147 (100.0%) |
| Total (Category) | 906 (45.9%) | 1,070 (54.1%) |
| Total (Overall) | 2,535 (52.5%) | 2,291 (47.5%) |
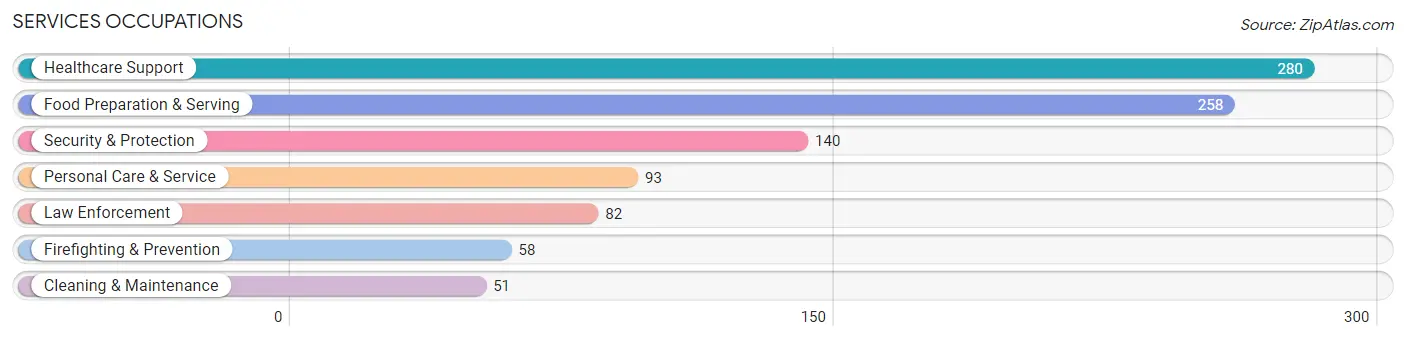
Services Occupations
The most common Services occupations in Fountain Inn are Healthcare Support (280 | 5.8%), Food Preparation & Serving (258 | 5.3%), Security & Protection (140 | 2.9%), Personal Care & Service (93 | 1.9%), and Law Enforcement (82 | 1.7%).
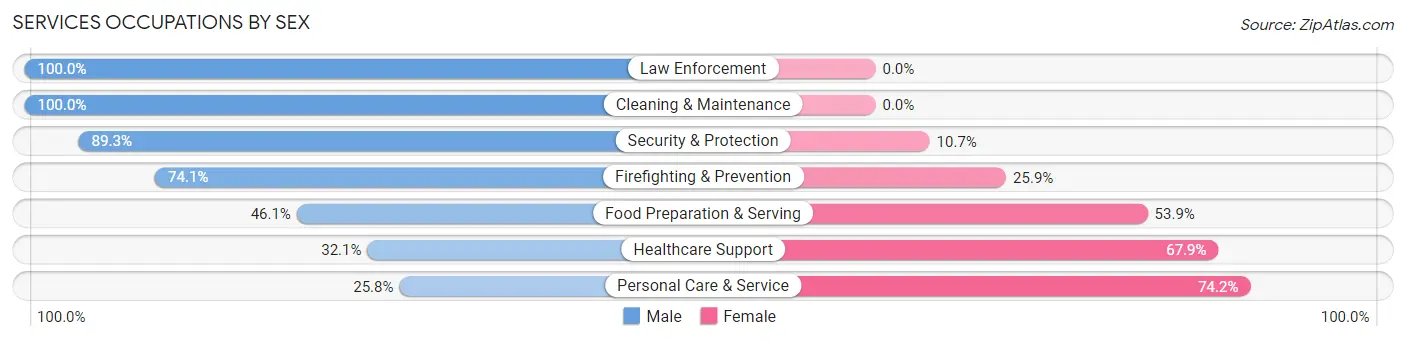
Services Occupations by Sex
Within the Services occupations in Fountain Inn, the most male-oriented occupations are Law Enforcement (100.0%), Cleaning & Maintenance (100.0%), and Security & Protection (89.3%), while the most female-oriented occupations are Personal Care & Service (74.2%), Healthcare Support (67.9%), and Food Preparation & Serving (53.9%).
| Occupation | Male | Female |
| Healthcare Support | 90 (32.1%) | 190 (67.9%) |
| Security & Protection | 125 (89.3%) | 15 (10.7%) |
| Firefighting & Prevention | 43 (74.1%) | 15 (25.9%) |
| Law Enforcement | 82 (100.0%) | 0 (0.0%) |
| Food Preparation & Serving | 119 (46.1%) | 139 (53.9%) |
| Cleaning & Maintenance | 51 (100.0%) | 0 (0.0%) |
| Personal Care & Service | 24 (25.8%) | 69 (74.2%) |
| Total (Category) | 409 (49.8%) | 413 (50.2%) |
| Total (Overall) | 2,535 (52.5%) | 2,291 (47.5%) |
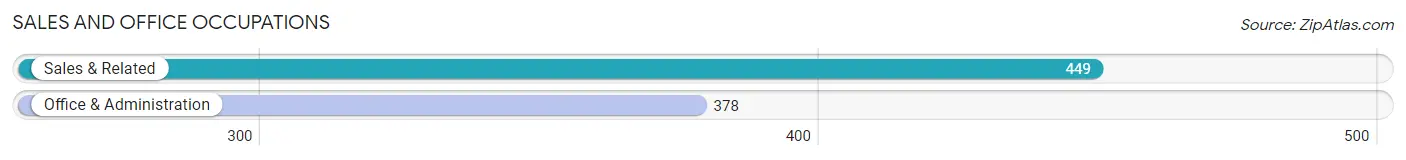
Sales and Office Occupations
The most common Sales and Office occupations in Fountain Inn are Sales & Related (449 | 9.3%), and Office & Administration (378 | 7.8%).
Sales and Office Occupations by Sex
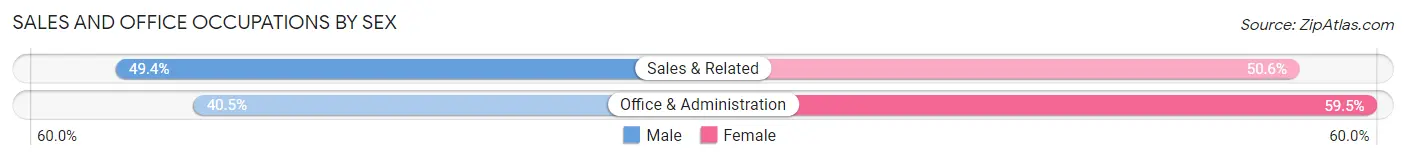
| Occupation | Male | Female |
| Sales & Related | 222 (49.4%) | 227 (50.6%) |
| Office & Administration | 153 (40.5%) | 225 (59.5%) |
| Total (Category) | 375 (45.3%) | 452 (54.7%) |
| Total (Overall) | 2,535 (52.5%) | 2,291 (47.5%) |
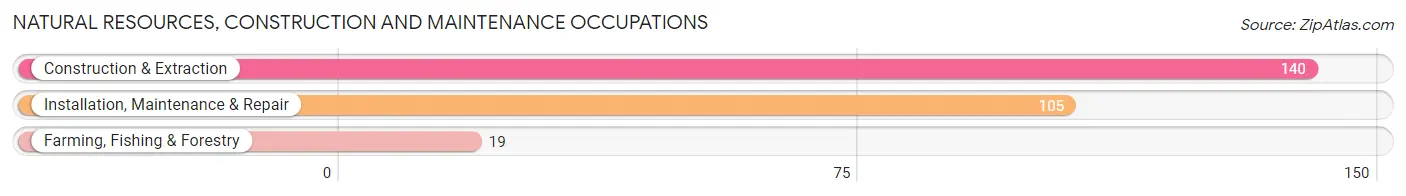
Natural Resources, Construction and Maintenance Occupations
The most common Natural Resources, Construction and Maintenance occupations in Fountain Inn are Construction & Extraction (140 | 2.9%), Installation, Maintenance & Repair (105 | 2.2%), and Farming, Fishing & Forestry (19 | 0.4%).
Natural Resources, Construction and Maintenance Occupations by Sex
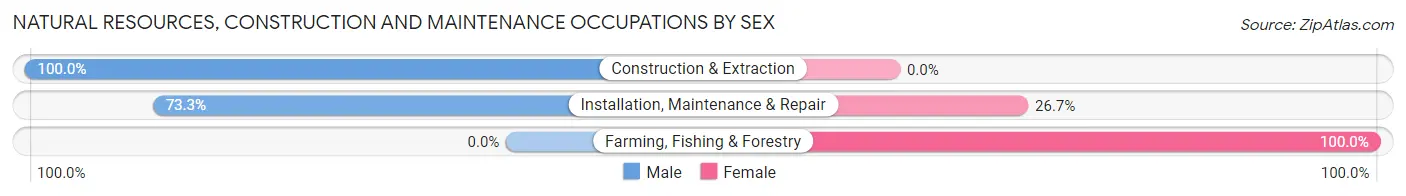
| Occupation | Male | Female |
| Farming, Fishing & Forestry | 0 (0.0%) | 19 (100.0%) |
| Construction & Extraction | 140 (100.0%) | 0 (0.0%) |
| Installation, Maintenance & Repair | 77 (73.3%) | 28 (26.7%) |
| Total (Category) | 217 (82.2%) | 47 (17.8%) |
| Total (Overall) | 2,535 (52.5%) | 2,291 (47.5%) |
Production, Transportation and Moving Occupations
The most common Production, Transportation and Moving occupations in Fountain Inn are Production (448 | 9.3%), Material Moving (248 | 5.1%), and Transportation (241 | 5.0%).
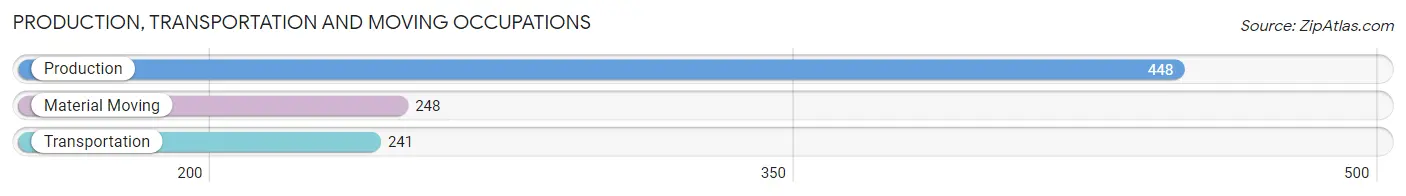
Production, Transportation and Moving Occupations by Sex
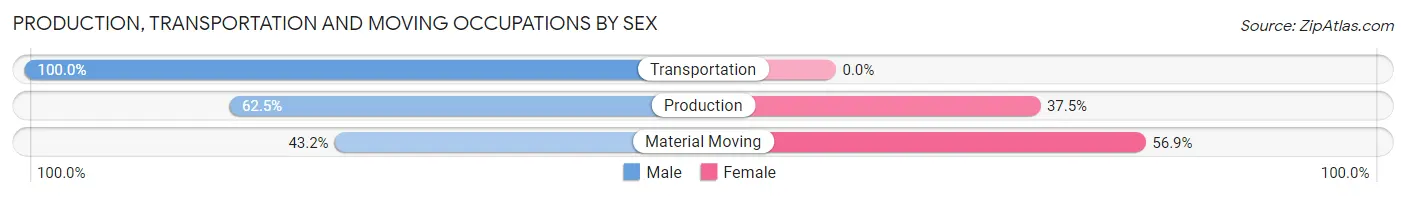
| Occupation | Male | Female |
| Production | 280 (62.5%) | 168 (37.5%) |
| Transportation | 241 (100.0%) | 0 (0.0%) |
| Material Moving | 107 (43.1%) | 141 (56.9%) |
| Total (Category) | 628 (67.0%) | 309 (33.0%) |
| Total (Overall) | 2,535 (52.5%) | 2,291 (47.5%) |
Employment Industries by Sex in Fountain Inn
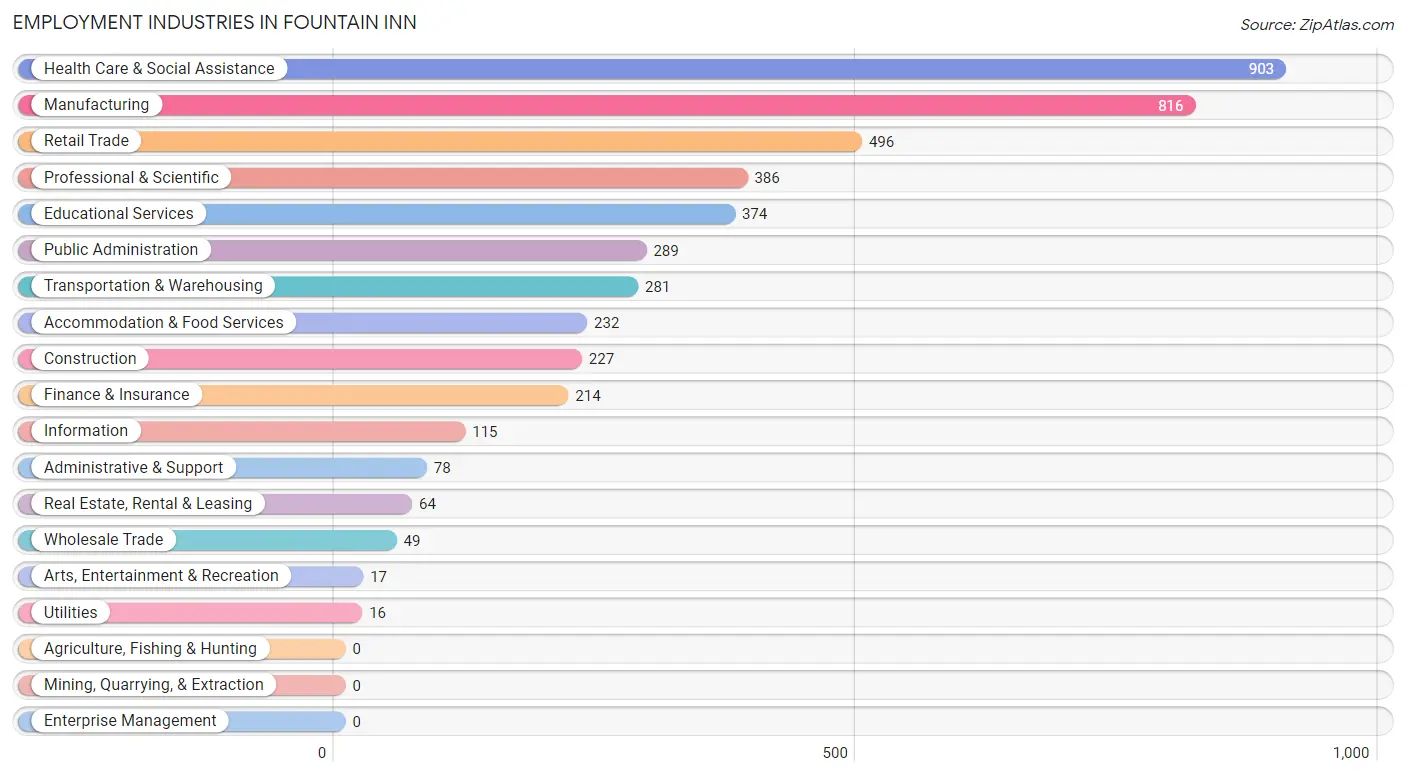
Employment Industries in Fountain Inn
The major employment industries in Fountain Inn include Health Care & Social Assistance (903 | 18.7%), Manufacturing (816 | 16.9%), Retail Trade (496 | 10.3%), Professional & Scientific (386 | 8.0%), and Educational Services (374 | 7.7%).
Employment Industries by Sex in Fountain Inn
The Fountain Inn industries that see more men than women are Utilities (100.0%), Construction (95.6%), and Real Estate, Rental & Leasing (78.1%), whereas the industries that tend to have a higher number of women are Educational Services (81.0%), Wholesale Trade (69.4%), and Finance & Insurance (66.8%).
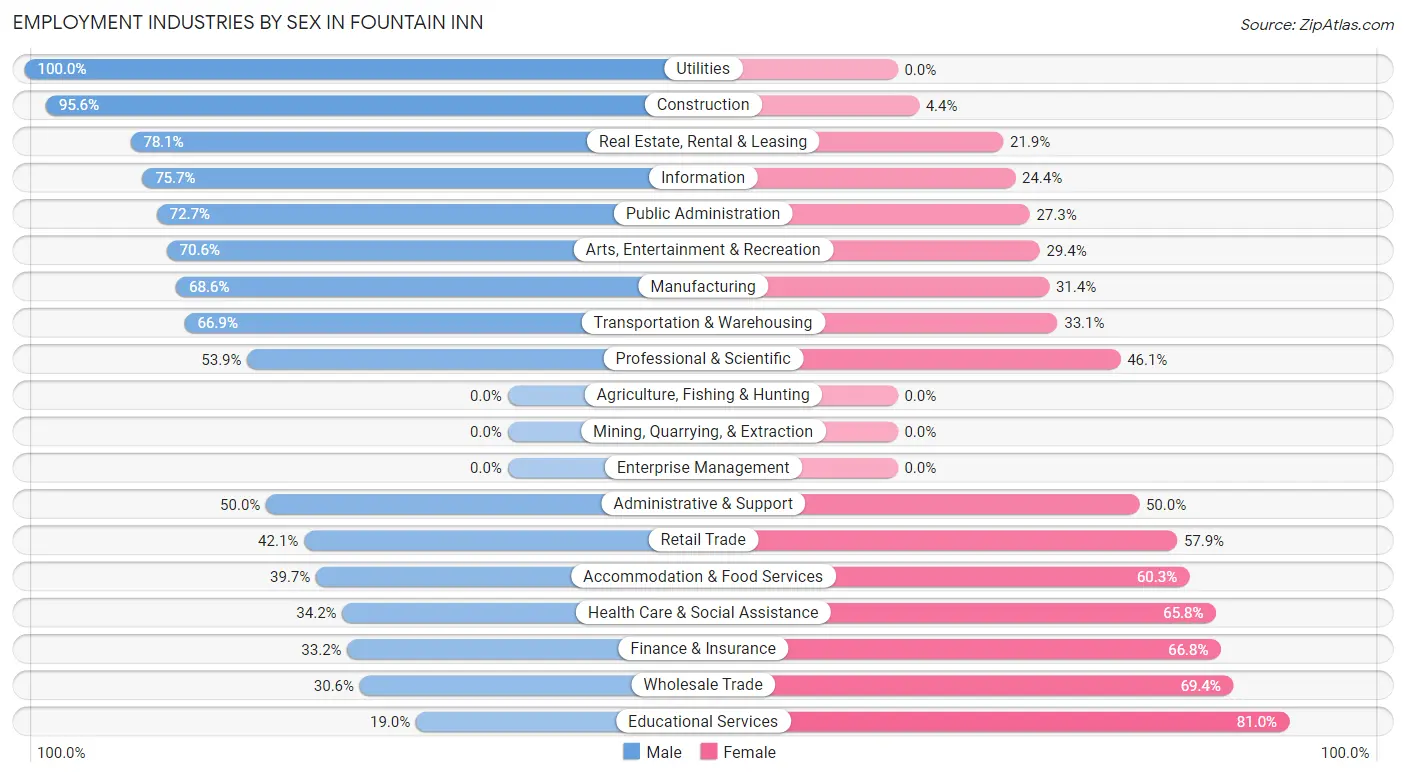
| Industry | Male | Female |
| Agriculture, Fishing & Hunting | 0 (0.0%) | 0 (0.0%) |
| Mining, Quarrying, & Extraction | 0 (0.0%) | 0 (0.0%) |
| Construction | 217 (95.6%) | 10 (4.4%) |
| Manufacturing | 560 (68.6%) | 256 (31.4%) |
| Wholesale Trade | 15 (30.6%) | 34 (69.4%) |
| Retail Trade | 209 (42.1%) | 287 (57.9%) |
| Transportation & Warehousing | 188 (66.9%) | 93 (33.1%) |
| Utilities | 16 (100.0%) | 0 (0.0%) |
| Information | 87 (75.6%) | 28 (24.3%) |
| Finance & Insurance | 71 (33.2%) | 143 (66.8%) |
| Real Estate, Rental & Leasing | 50 (78.1%) | 14 (21.9%) |
| Professional & Scientific | 208 (53.9%) | 178 (46.1%) |
| Enterprise Management | 0 (0.0%) | 0 (0.0%) |
| Administrative & Support | 39 (50.0%) | 39 (50.0%) |
| Educational Services | 71 (19.0%) | 303 (81.0%) |
| Health Care & Social Assistance | 309 (34.2%) | 594 (65.8%) |
| Arts, Entertainment & Recreation | 12 (70.6%) | 5 (29.4%) |
| Accommodation & Food Services | 92 (39.7%) | 140 (60.3%) |
| Public Administration | 210 (72.7%) | 79 (27.3%) |
| Total | 2,535 (52.5%) | 2,291 (47.5%) |
Education in Fountain Inn
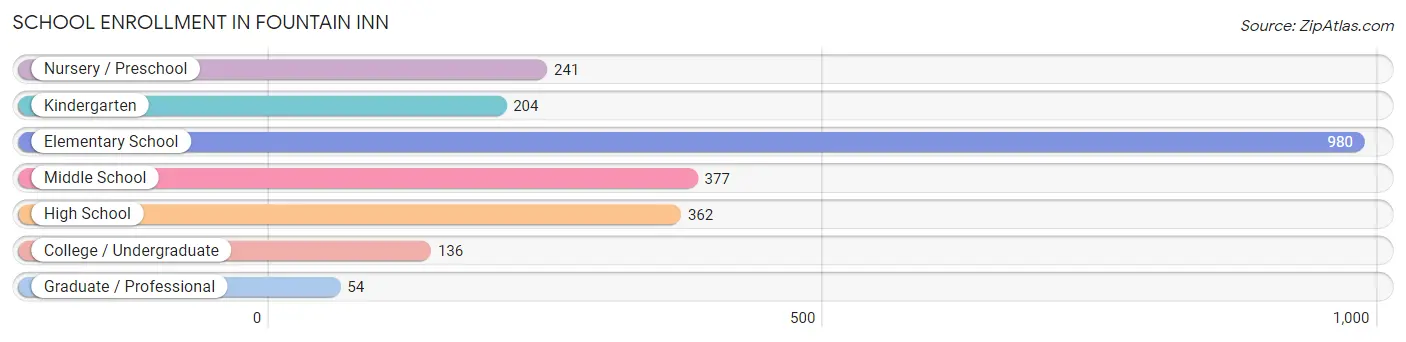
School Enrollment in Fountain Inn
The most common levels of schooling among the 2,354 students in Fountain Inn are elementary school (980 | 41.6%), middle school (377 | 16.0%), and high school (362 | 15.4%).
| School Level | # Students | % Students |
| Nursery / Preschool | 241 | 10.2% |
| Kindergarten | 204 | 8.7% |
| Elementary School | 980 | 41.6% |
| Middle School | 377 | 16.0% |
| High School | 362 | 15.4% |
| College / Undergraduate | 136 | 5.8% |
| Graduate / Professional | 54 | 2.3% |
| Total | 2,354 | 100.0% |
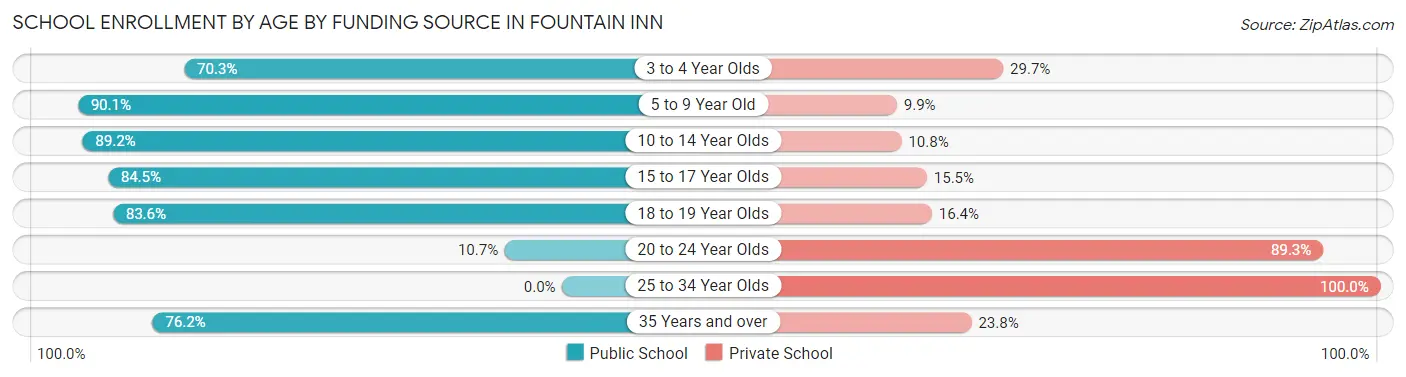
School Enrollment by Age by Funding Source in Fountain Inn
Out of a total of 2,354 students who are enrolled in schools in Fountain Inn, 353 (15.0%) attend a private institution, while the remaining 2,001 (85.0%) are enrolled in public schools. The age group of 25 to 34 year olds has the highest likelihood of being enrolled in private schools, with 33 (100.0% in the age bracket) enrolled. Conversely, the age group of 5 to 9 year old has the lowest likelihood of being enrolled in a private school, with 937 (90.1% in the age bracket) attending a public institution.
| Age Bracket | Public School | Private School |
| 3 to 4 Year Olds | 123 (70.3%) | 52 (29.7%) |
| 5 to 9 Year Old | 937 (90.1%) | 103 (9.9%) |
| 10 to 14 Year Olds | 588 (89.2%) | 71 (10.8%) |
| 15 to 17 Year Olds | 218 (84.5%) | 40 (15.5%) |
| 18 to 19 Year Olds | 117 (83.6%) | 23 (16.4%) |
| 20 to 24 Year Olds | 3 (10.7%) | 25 (89.3%) |
| 25 to 34 Year Olds | 0 (0.0%) | 33 (100.0%) |
| 35 Years and over | 16 (76.2%) | 5 (23.8%) |
| Total | 2,001 (85.0%) | 353 (15.0%) |
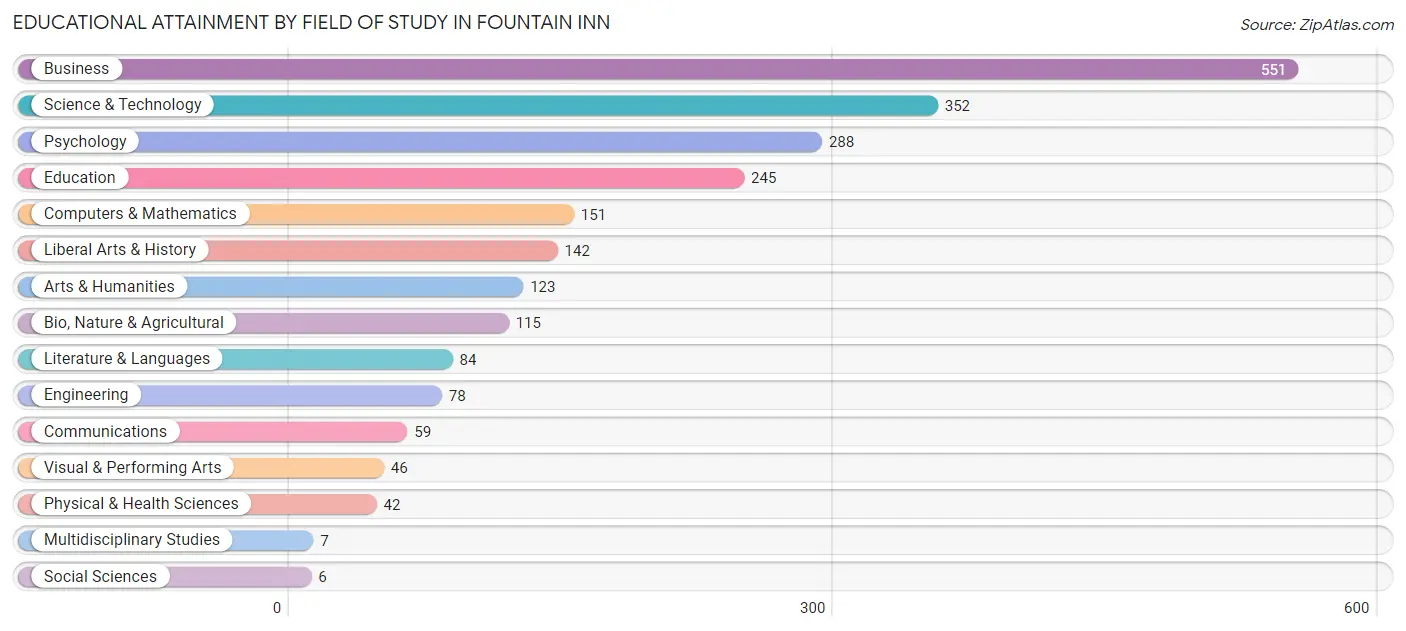
Educational Attainment by Field of Study in Fountain Inn
Business (551 | 24.1%), science & technology (352 | 15.4%), psychology (288 | 12.6%), education (245 | 10.7%), and computers & mathematics (151 | 6.6%) are the most common fields of study among 2,289 individuals in Fountain Inn who have obtained a bachelor's degree or higher.
| Field of Study | # Graduates | % Graduates |
| Computers & Mathematics | 151 | 6.6% |
| Bio, Nature & Agricultural | 115 | 5.0% |
| Physical & Health Sciences | 42 | 1.8% |
| Psychology | 288 | 12.6% |
| Social Sciences | 6 | 0.3% |
| Engineering | 78 | 3.4% |
| Multidisciplinary Studies | 7 | 0.3% |
| Science & Technology | 352 | 15.4% |
| Business | 551 | 24.1% |
| Education | 245 | 10.7% |
| Literature & Languages | 84 | 3.7% |
| Liberal Arts & History | 142 | 6.2% |
| Visual & Performing Arts | 46 | 2.0% |
| Communications | 59 | 2.6% |
| Arts & Humanities | 123 | 5.4% |
| Total | 2,289 | 100.0% |
Transportation & Commute in Fountain Inn
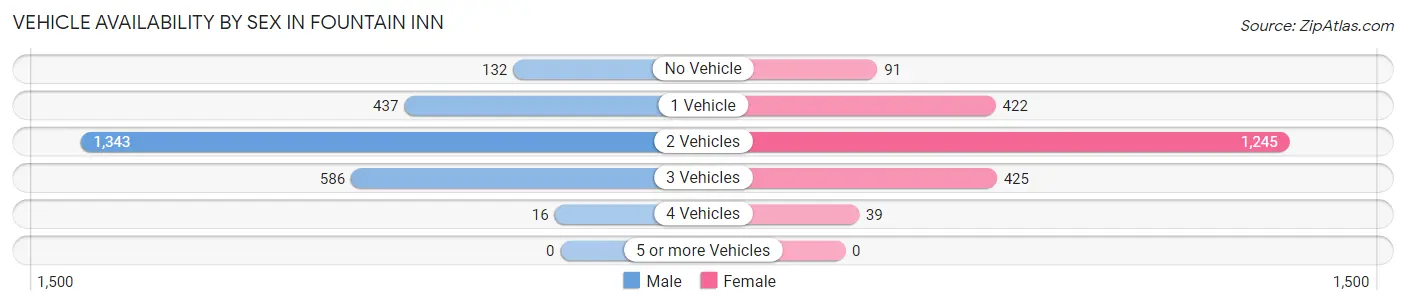
Vehicle Availability by Sex in Fountain Inn
The most prevalent vehicle ownership categories in Fountain Inn are males with 2 vehicles (1,343, accounting for 53.4%) and females with 2 vehicles (1,245, making up 60.4%).
| Vehicles Available | Male | Female |
| No Vehicle | 132 (5.2%) | 91 (4.1%) |
| 1 Vehicle | 437 (17.4%) | 422 (19.0%) |
| 2 Vehicles | 1,343 (53.4%) | 1,245 (56.0%) |
| 3 Vehicles | 586 (23.3%) | 425 (19.1%) |
| 4 Vehicles | 16 (0.6%) | 39 (1.8%) |
| 5 or more Vehicles | 0 (0.0%) | 0 (0.0%) |
| Total | 2,514 (100.0%) | 2,222 (100.0%) |
Commute Time in Fountain Inn
The most frequently occuring commute durations in Fountain Inn are 10 to 14 minutes (657 commuters, 15.5%), 30 to 34 minutes (631 commuters, 14.9%), and 15 to 19 minutes (603 commuters, 14.3%).
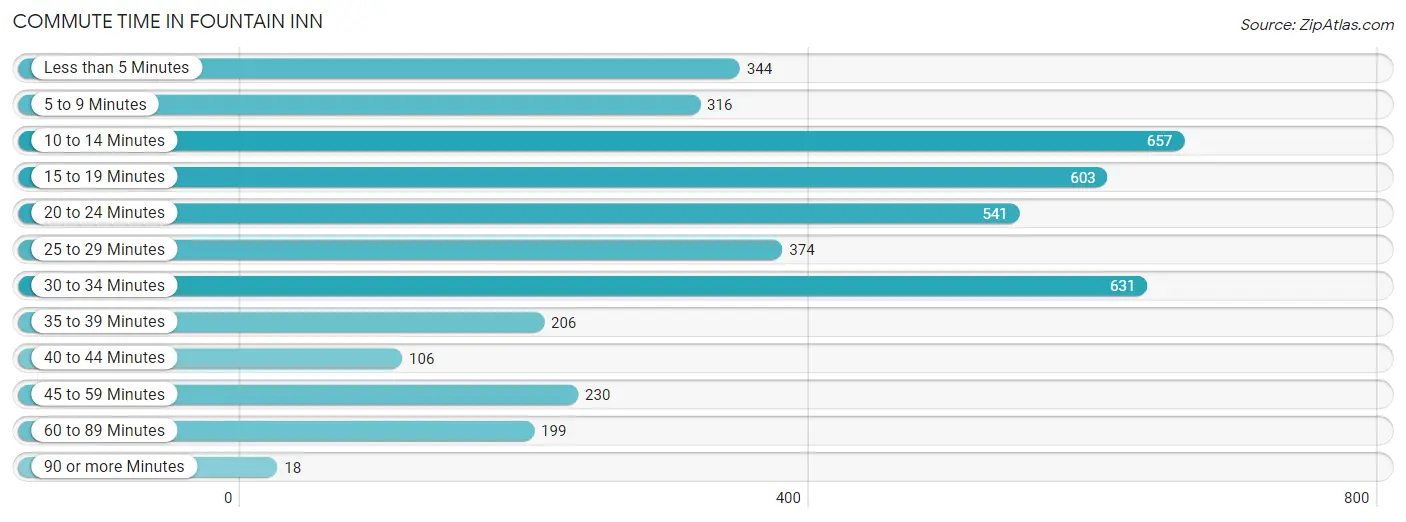
| Commute Time | # Commuters | % Commuters |
| Less than 5 Minutes | 344 | 8.1% |
| 5 to 9 Minutes | 316 | 7.5% |
| 10 to 14 Minutes | 657 | 15.5% |
| 15 to 19 Minutes | 603 | 14.3% |
| 20 to 24 Minutes | 541 | 12.8% |
| 25 to 29 Minutes | 374 | 8.8% |
| 30 to 34 Minutes | 631 | 14.9% |
| 35 to 39 Minutes | 206 | 4.9% |
| 40 to 44 Minutes | 106 | 2.5% |
| 45 to 59 Minutes | 230 | 5.4% |
| 60 to 89 Minutes | 199 | 4.7% |
| 90 or more Minutes | 18 | 0.4% |
Commute Time by Sex in Fountain Inn
The most common commute times in Fountain Inn are 20 to 24 minutes (384 commuters, 17.0%) for males and 10 to 14 minutes (331 commuters, 16.8%) for females.
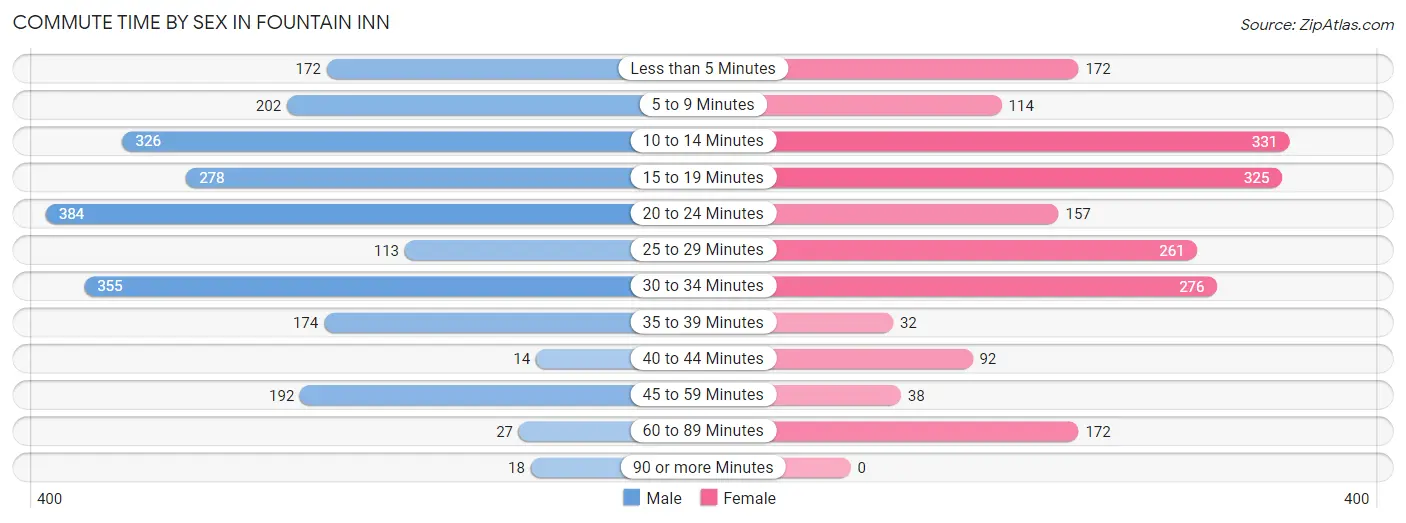
| Commute Time | Male | Female |
| Less than 5 Minutes | 172 (7.6%) | 172 (8.7%) |
| 5 to 9 Minutes | 202 (9.0%) | 114 (5.8%) |
| 10 to 14 Minutes | 326 (14.5%) | 331 (16.8%) |
| 15 to 19 Minutes | 278 (12.3%) | 325 (16.5%) |
| 20 to 24 Minutes | 384 (17.0%) | 157 (8.0%) |
| 25 to 29 Minutes | 113 (5.0%) | 261 (13.3%) |
| 30 to 34 Minutes | 355 (15.7%) | 276 (14.0%) |
| 35 to 39 Minutes | 174 (7.7%) | 32 (1.6%) |
| 40 to 44 Minutes | 14 (0.6%) | 92 (4.7%) |
| 45 to 59 Minutes | 192 (8.5%) | 38 (1.9%) |
| 60 to 89 Minutes | 27 (1.2%) | 172 (8.7%) |
| 90 or more Minutes | 18 (0.8%) | 0 (0.0%) |
Time of Departure to Work by Sex in Fountain Inn
The most frequent times of departure to work in Fountain Inn are 4:00 PM to 11:59 PM (419, 18.6%) for males and 7:30 AM to 7:59 AM (290, 14.7%) for females.
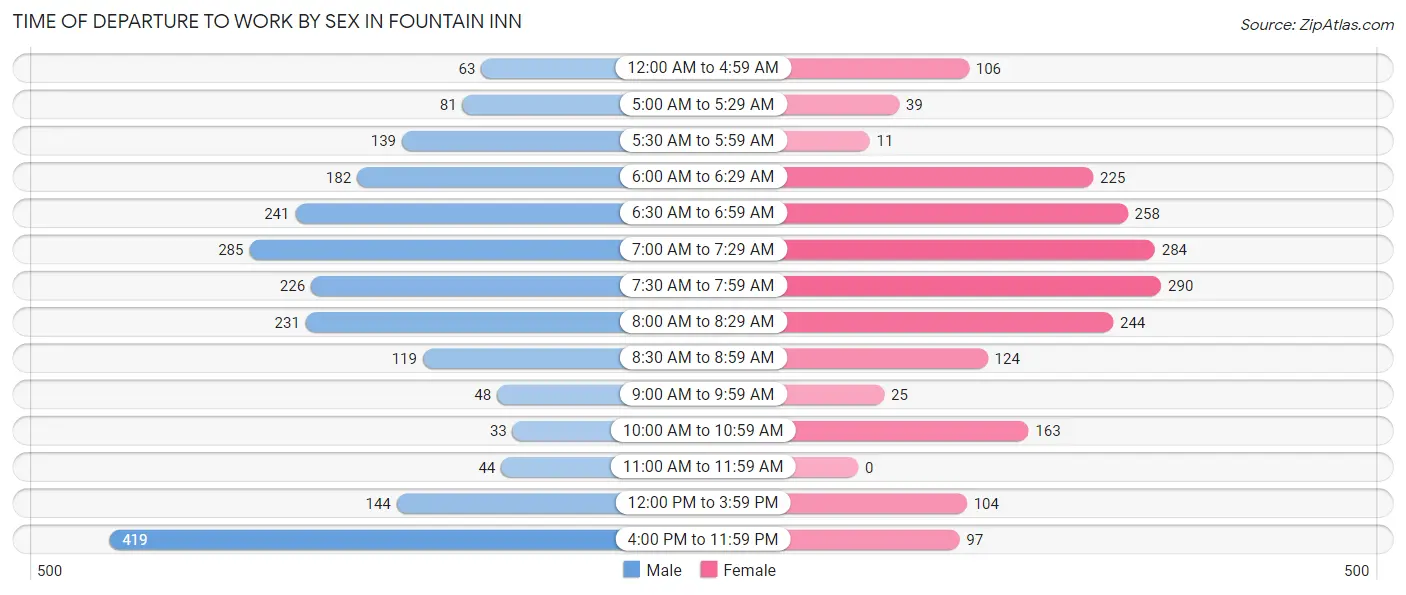
| Time of Departure | Male | Female |
| 12:00 AM to 4:59 AM | 63 (2.8%) | 106 (5.4%) |
| 5:00 AM to 5:29 AM | 81 (3.6%) | 39 (2.0%) |
| 5:30 AM to 5:59 AM | 139 (6.2%) | 11 (0.6%) |
| 6:00 AM to 6:29 AM | 182 (8.1%) | 225 (11.4%) |
| 6:30 AM to 6:59 AM | 241 (10.7%) | 258 (13.1%) |
| 7:00 AM to 7:29 AM | 285 (12.6%) | 284 (14.4%) |
| 7:30 AM to 7:59 AM | 226 (10.0%) | 290 (14.7%) |
| 8:00 AM to 8:29 AM | 231 (10.2%) | 244 (12.4%) |
| 8:30 AM to 8:59 AM | 119 (5.3%) | 124 (6.3%) |
| 9:00 AM to 9:59 AM | 48 (2.1%) | 25 (1.3%) |
| 10:00 AM to 10:59 AM | 33 (1.5%) | 163 (8.3%) |
| 11:00 AM to 11:59 AM | 44 (1.9%) | 0 (0.0%) |
| 12:00 PM to 3:59 PM | 144 (6.4%) | 104 (5.3%) |
| 4:00 PM to 11:59 PM | 419 (18.6%) | 97 (4.9%) |
| Total | 2,255 (100.0%) | 1,970 (100.0%) |
Housing Occupancy in Fountain Inn
Occupancy by Ownership in Fountain Inn
Of the total 3,879 dwellings in Fountain Inn, owner-occupied units account for 2,747 (70.8%), while renter-occupied units make up 1,132 (29.2%).
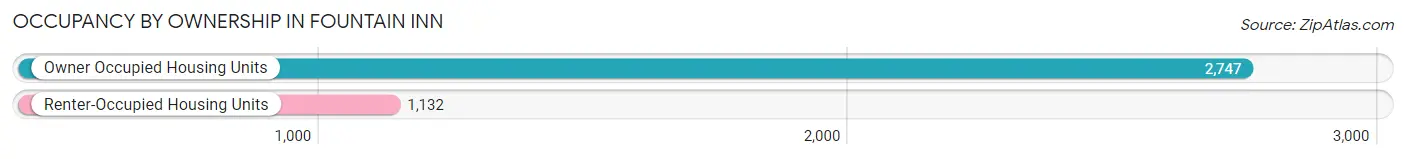
| Occupancy | # Housing Units | % Housing Units |
| Owner Occupied Housing Units | 2,747 | 70.8% |
| Renter-Occupied Housing Units | 1,132 | 29.2% |
| Total Occupied Housing Units | 3,879 | 100.0% |
Occupancy by Household Size in Fountain Inn
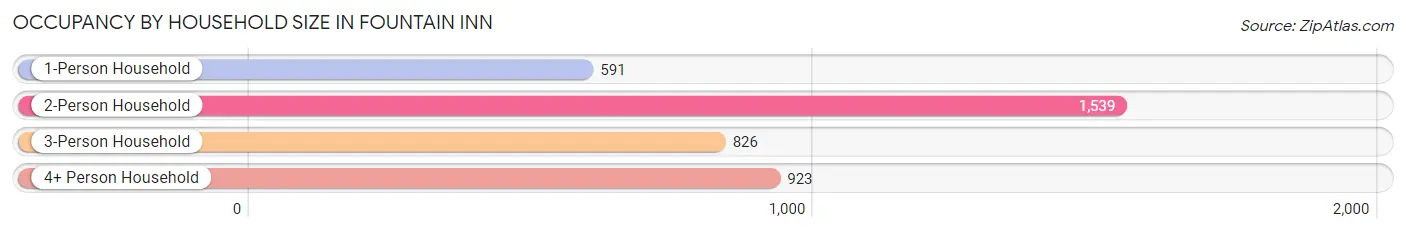
| Household Size | # Housing Units | % Housing Units |
| 1-Person Household | 591 | 15.2% |
| 2-Person Household | 1,539 | 39.7% |
| 3-Person Household | 826 | 21.3% |
| 4+ Person Household | 923 | 23.8% |
| Total Housing Units | 3,879 | 100.0% |
Occupancy by Ownership by Household Size in Fountain Inn
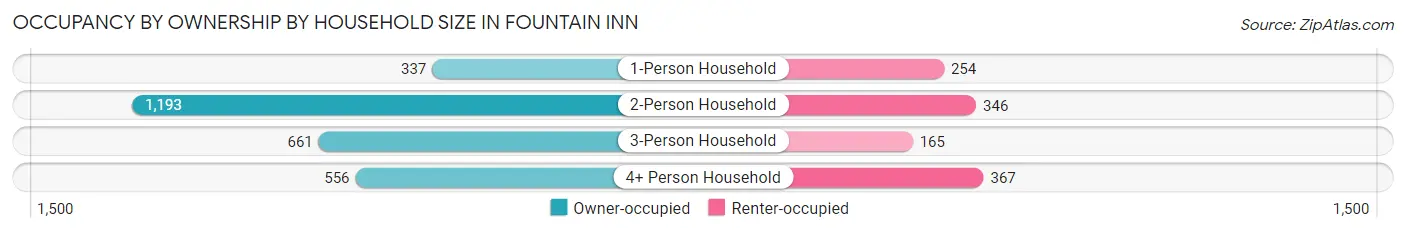
| Household Size | Owner-occupied | Renter-occupied |
| 1-Person Household | 337 (57.0%) | 254 (43.0%) |
| 2-Person Household | 1,193 (77.5%) | 346 (22.5%) |
| 3-Person Household | 661 (80.0%) | 165 (20.0%) |
| 4+ Person Household | 556 (60.2%) | 367 (39.8%) |
| Total Housing Units | 2,747 (70.8%) | 1,132 (29.2%) |
Occupancy by Educational Attainment in Fountain Inn
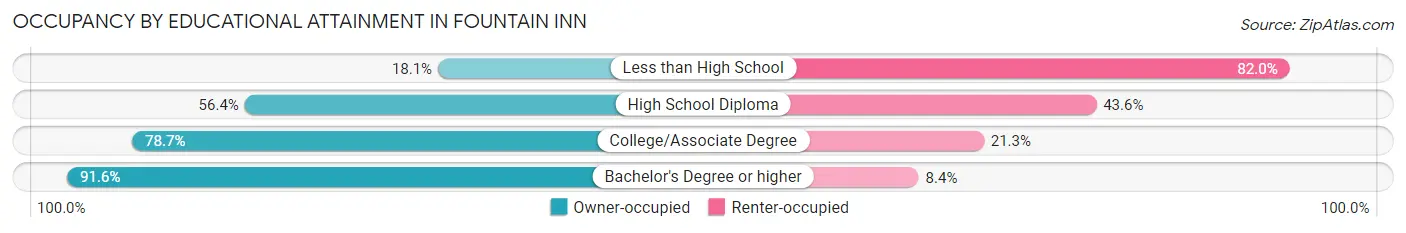
| Household Size | Owner-occupied | Renter-occupied |
| Less than High School | 63 (18.0%) | 286 (82.0%) |
| High School Diploma | 642 (56.4%) | 497 (43.6%) |
| College/Associate Degree | 900 (78.7%) | 244 (21.3%) |
| Bachelor's Degree or higher | 1,142 (91.6%) | 105 (8.4%) |
Occupancy by Age of Householder in Fountain Inn
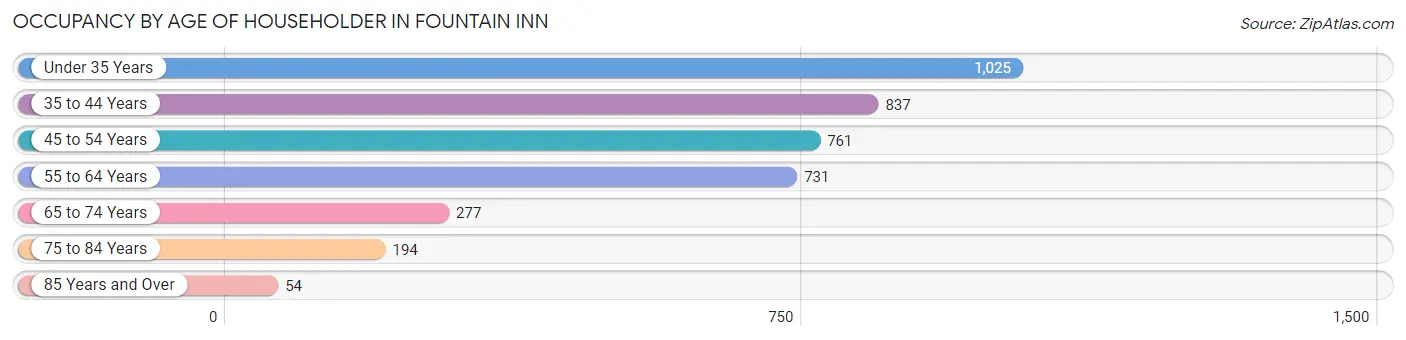
| Age Bracket | # Households | % Households |
| Under 35 Years | 1,025 | 26.4% |
| 35 to 44 Years | 837 | 21.6% |
| 45 to 54 Years | 761 | 19.6% |
| 55 to 64 Years | 731 | 18.9% |
| 65 to 74 Years | 277 | 7.1% |
| 75 to 84 Years | 194 | 5.0% |
| 85 Years and Over | 54 | 1.4% |
| Total | 3,879 | 100.0% |
Housing Finances in Fountain Inn
Median Income by Occupancy in Fountain Inn
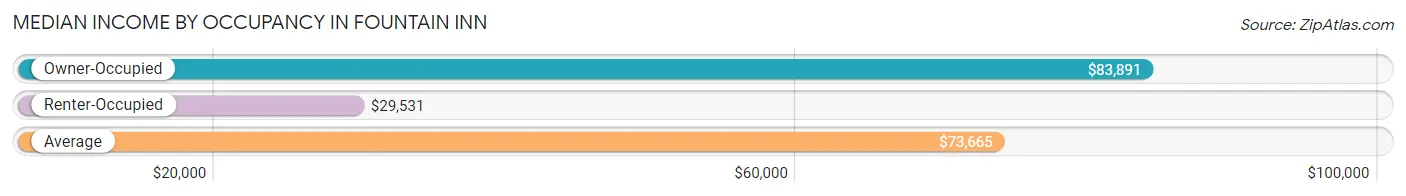
| Occupancy Type | # Households | Median Income |
| Owner-Occupied | 2,747 (70.8%) | $83,891 |
| Renter-Occupied | 1,132 (29.2%) | $29,531 |
| Average | 3,879 (100.0%) | $73,665 |
Occupancy by Householder Income Bracket in Fountain Inn
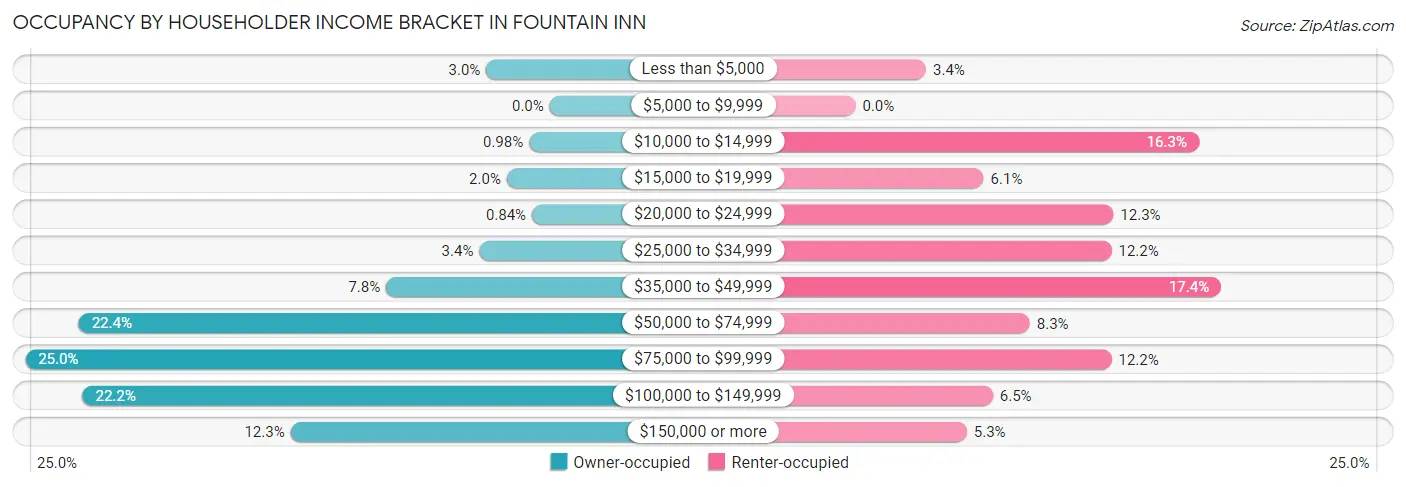
| Income Bracket | Owner-occupied | Renter-occupied |
| Less than $5,000 | 83 (3.0%) | 38 (3.4%) |
| $5,000 to $9,999 | 0 (0.0%) | 0 (0.0%) |
| $10,000 to $14,999 | 27 (1.0%) | 185 (16.3%) |
| $15,000 to $19,999 | 56 (2.0%) | 69 (6.1%) |
| $20,000 to $24,999 | 23 (0.8%) | 139 (12.3%) |
| $25,000 to $34,999 | 92 (3.4%) | 138 (12.2%) |
| $35,000 to $49,999 | 214 (7.8%) | 197 (17.4%) |
| $50,000 to $74,999 | 616 (22.4%) | 94 (8.3%) |
| $75,000 to $99,999 | 686 (25.0%) | 138 (12.2%) |
| $100,000 to $149,999 | 611 (22.2%) | 74 (6.5%) |
| $150,000 or more | 339 (12.3%) | 60 (5.3%) |
| Total | 2,747 (100.0%) | 1,132 (100.0%) |
Monthly Housing Cost Tiers in Fountain Inn
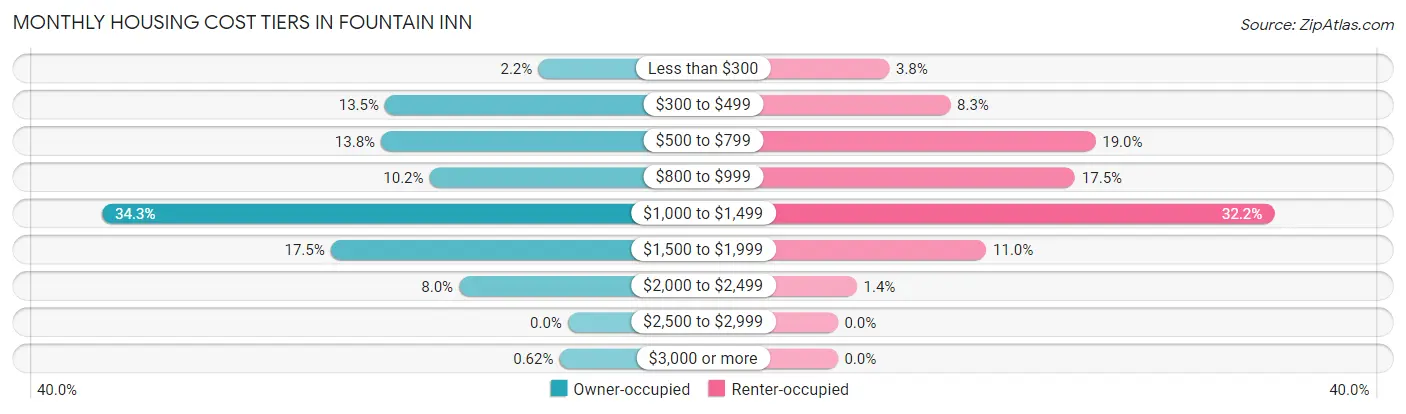
| Monthly Cost | Owner-occupied | Renter-occupied |
| Less than $300 | 60 (2.2%) | 43 (3.8%) |
| $300 to $499 | 370 (13.5%) | 94 (8.3%) |
| $500 to $799 | 378 (13.8%) | 215 (19.0%) |
| $800 to $999 | 280 (10.2%) | 198 (17.5%) |
| $1,000 to $1,499 | 942 (34.3%) | 364 (32.2%) |
| $1,500 to $1,999 | 480 (17.5%) | 124 (11.0%) |
| $2,000 to $2,499 | 220 (8.0%) | 16 (1.4%) |
| $2,500 to $2,999 | 0 (0.0%) | 0 (0.0%) |
| $3,000 or more | 17 (0.6%) | 0 (0.0%) |
| Total | 2,747 (100.0%) | 1,132 (100.0%) |
Physical Housing Characteristics in Fountain Inn
Housing Structures in Fountain Inn
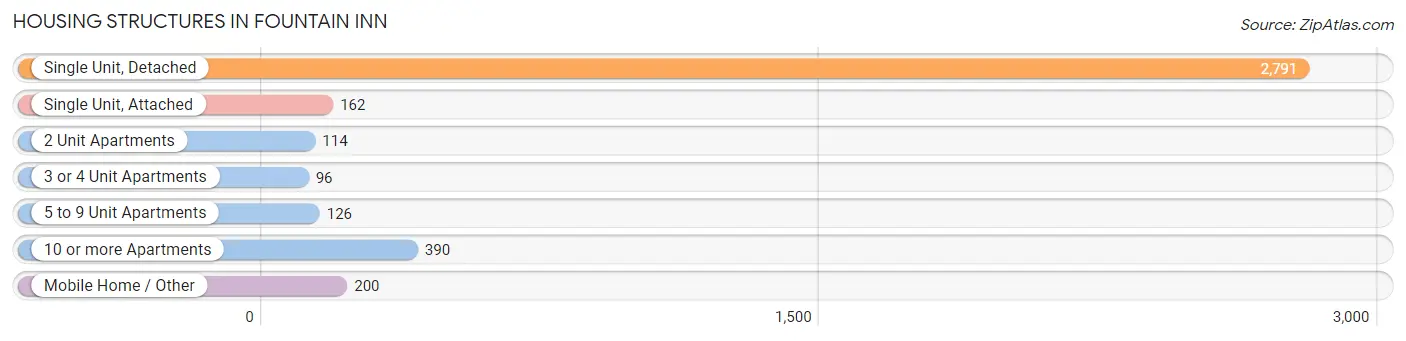
| Structure Type | # Housing Units | % Housing Units |
| Single Unit, Detached | 2,791 | 72.0% |
| Single Unit, Attached | 162 | 4.2% |
| 2 Unit Apartments | 114 | 2.9% |
| 3 or 4 Unit Apartments | 96 | 2.5% |
| 5 to 9 Unit Apartments | 126 | 3.3% |
| 10 or more Apartments | 390 | 10.1% |
| Mobile Home / Other | 200 | 5.2% |
| Total | 3,879 | 100.0% |
Housing Structures by Occupancy in Fountain Inn
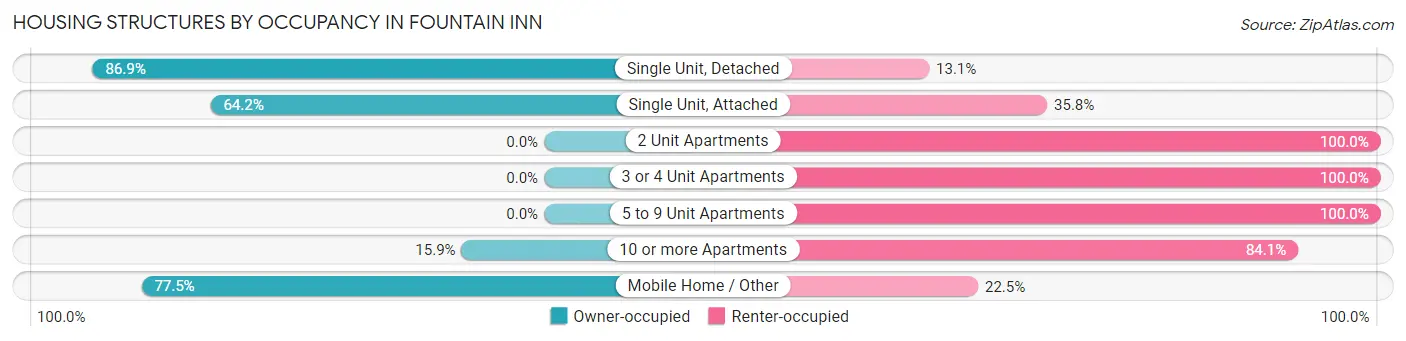
| Structure Type | Owner-occupied | Renter-occupied |
| Single Unit, Detached | 2,426 (86.9%) | 365 (13.1%) |
| Single Unit, Attached | 104 (64.2%) | 58 (35.8%) |
| 2 Unit Apartments | 0 (0.0%) | 114 (100.0%) |
| 3 or 4 Unit Apartments | 0 (0.0%) | 96 (100.0%) |
| 5 to 9 Unit Apartments | 0 (0.0%) | 126 (100.0%) |
| 10 or more Apartments | 62 (15.9%) | 328 (84.1%) |
| Mobile Home / Other | 155 (77.5%) | 45 (22.5%) |
| Total | 2,747 (70.8%) | 1,132 (29.2%) |
Housing Structures by Number of Rooms in Fountain Inn
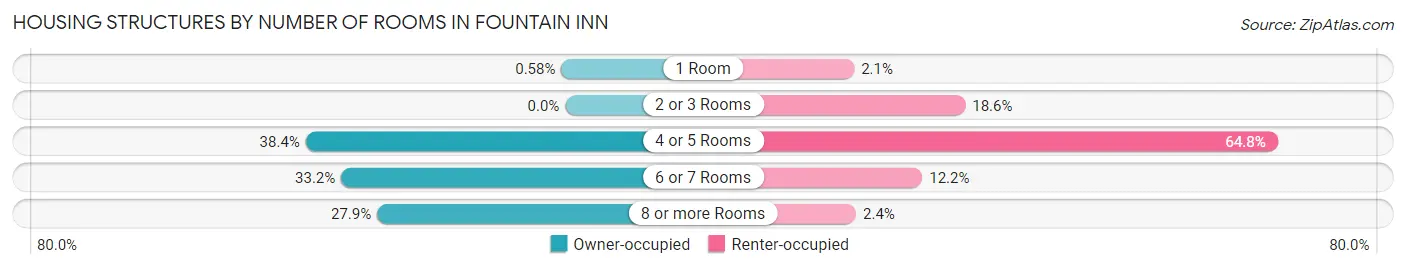
| Number of Rooms | Owner-occupied | Renter-occupied |
| 1 Room | 16 (0.6%) | 24 (2.1%) |
| 2 or 3 Rooms | 0 (0.0%) | 210 (18.5%) |
| 4 or 5 Rooms | 1,055 (38.4%) | 733 (64.7%) |
| 6 or 7 Rooms | 911 (33.2%) | 138 (12.2%) |
| 8 or more Rooms | 765 (27.9%) | 27 (2.4%) |
| Total | 2,747 (100.0%) | 1,132 (100.0%) |
Housing Structure by Heating Type in Fountain Inn
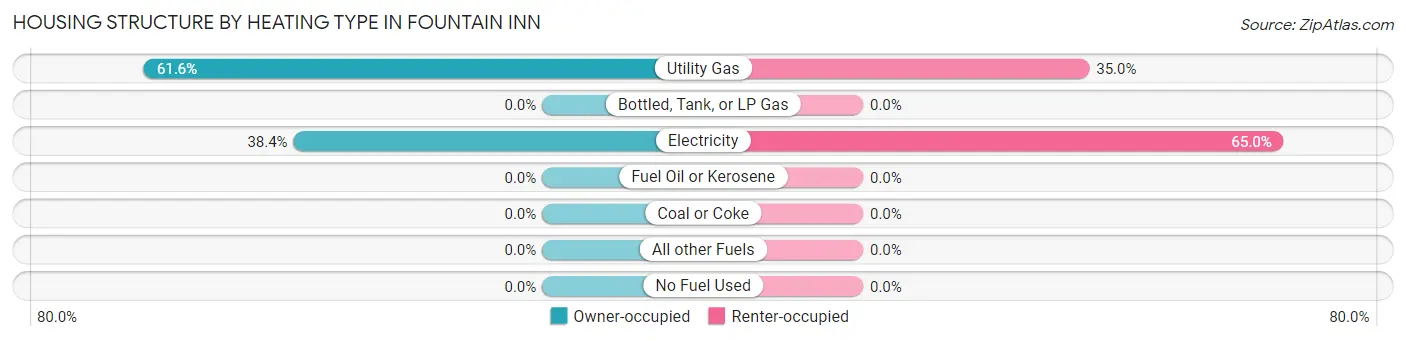
| Heating Type | Owner-occupied | Renter-occupied |
| Utility Gas | 1,691 (61.6%) | 396 (35.0%) |
| Bottled, Tank, or LP Gas | 0 (0.0%) | 0 (0.0%) |
| Electricity | 1,056 (38.4%) | 736 (65.0%) |
| Fuel Oil or Kerosene | 0 (0.0%) | 0 (0.0%) |
| Coal or Coke | 0 (0.0%) | 0 (0.0%) |
| All other Fuels | 0 (0.0%) | 0 (0.0%) |
| No Fuel Used | 0 (0.0%) | 0 (0.0%) |
| Total | 2,747 (100.0%) | 1,132 (100.0%) |
Household Vehicle Usage in Fountain Inn
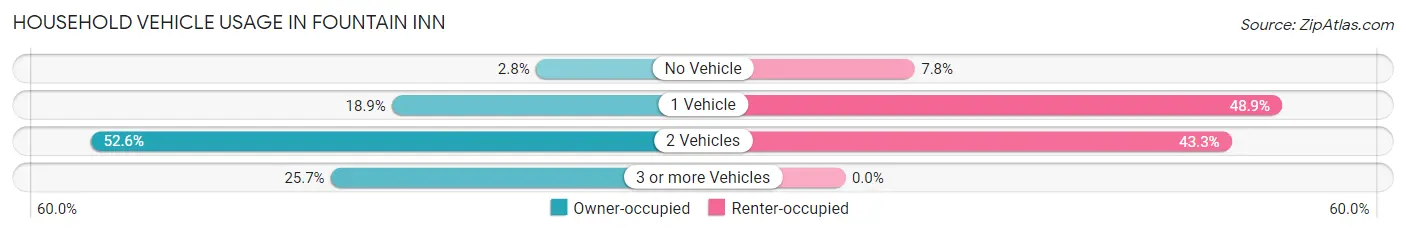
| Vehicles per Household | Owner-occupied | Renter-occupied |
| No Vehicle | 76 (2.8%) | 88 (7.8%) |
| 1 Vehicle | 519 (18.9%) | 554 (48.9%) |
| 2 Vehicles | 1,445 (52.6%) | 490 (43.3%) |
| 3 or more Vehicles | 707 (25.7%) | 0 (0.0%) |
| Total | 2,747 (100.0%) | 1,132 (100.0%) |
Real Estate & Mortgages in Fountain Inn
Real Estate and Mortgage Overview in Fountain Inn
| Characteristic | Without Mortgage | With Mortgage |
| Housing Units | 740 | 2,007 |
| Median Property Value | $189,400 | $213,800 |
| Median Household Income | $72,409 | $262 |
| Monthly Housing Costs | $471 | $17 |
| Real Estate Taxes | $1,339 | $85 |
Property Value by Mortgage Status in Fountain Inn
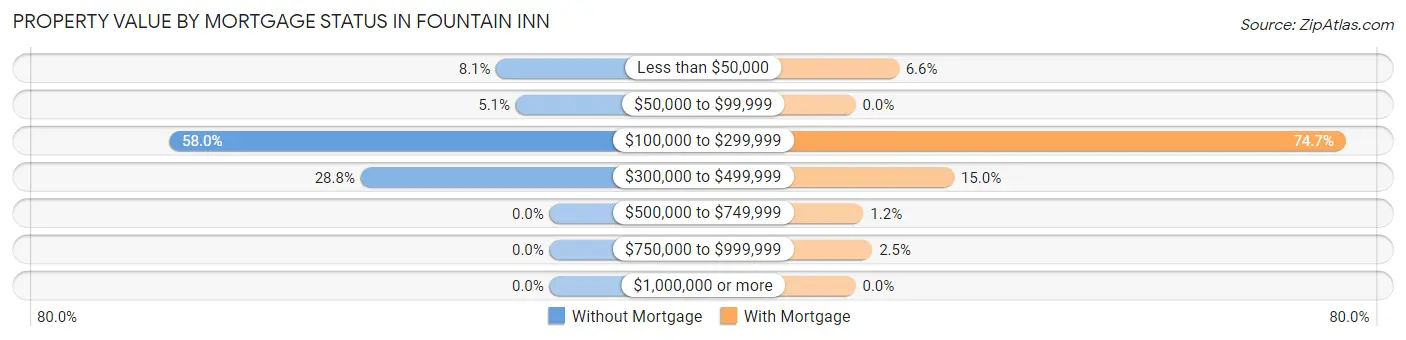
| Property Value | Without Mortgage | With Mortgage |
| Less than $50,000 | 60 (8.1%) | 132 (6.6%) |
| $50,000 to $99,999 | 38 (5.1%) | 0 (0.0%) |
| $100,000 to $299,999 | 429 (58.0%) | 1,499 (74.7%) |
| $300,000 to $499,999 | 213 (28.8%) | 301 (15.0%) |
| $500,000 to $749,999 | 0 (0.0%) | 24 (1.2%) |
| $750,000 to $999,999 | 0 (0.0%) | 51 (2.5%) |
| $1,000,000 or more | 0 (0.0%) | 0 (0.0%) |
| Total | 740 (100.0%) | 2,007 (100.0%) |
Household Income by Mortgage Status in Fountain Inn
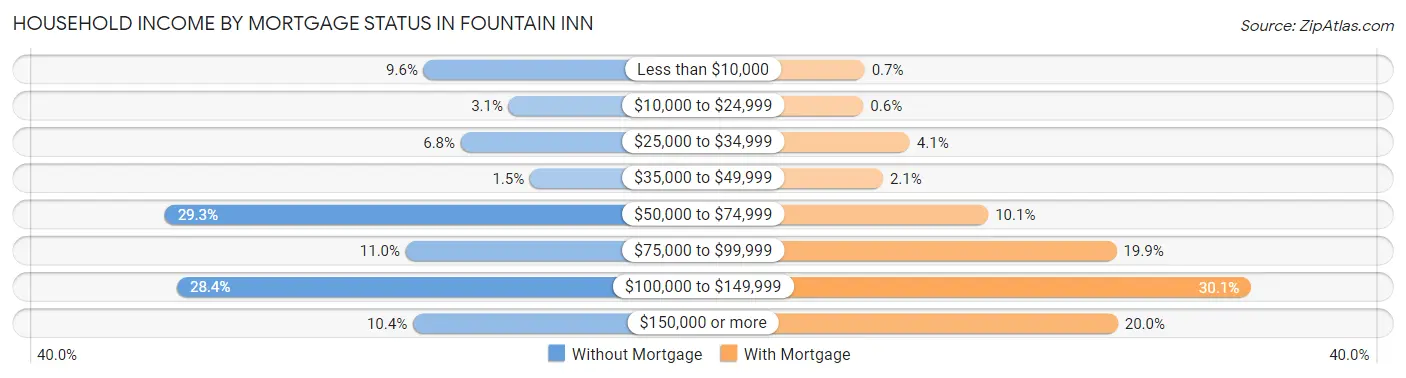
| Household Income | Without Mortgage | With Mortgage |
| Less than $10,000 | 71 (9.6%) | 14 (0.7%) |
| $10,000 to $24,999 | 23 (3.1%) | 12 (0.6%) |
| $25,000 to $34,999 | 50 (6.8%) | 83 (4.1%) |
| $35,000 to $49,999 | 11 (1.5%) | 42 (2.1%) |
| $50,000 to $74,999 | 217 (29.3%) | 203 (10.1%) |
| $75,000 to $99,999 | 81 (11.0%) | 399 (19.9%) |
| $100,000 to $149,999 | 210 (28.4%) | 605 (30.1%) |
| $150,000 or more | 77 (10.4%) | 401 (20.0%) |
| Total | 740 (100.0%) | 2,007 (100.0%) |
Property Value to Household Income Ratio in Fountain Inn
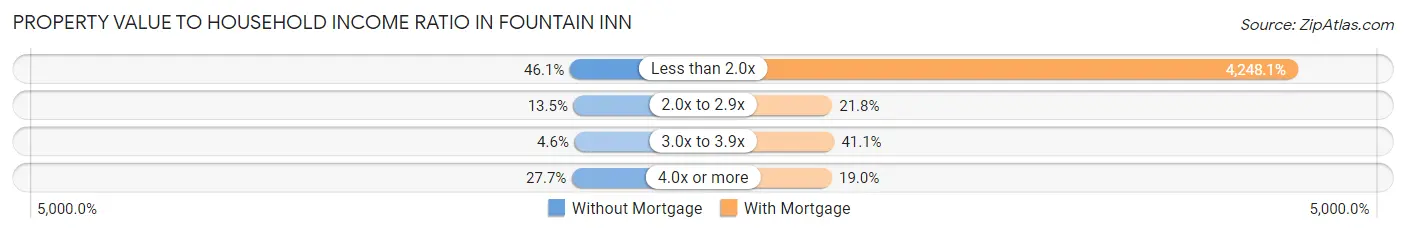
| Value-to-Income Ratio | Without Mortgage | With Mortgage |
| Less than 2.0x | 341 (46.1%) | 85,260 (4,248.1%) |
| 2.0x to 2.9x | 100 (13.5%) | 437 (21.8%) |
| 3.0x to 3.9x | 34 (4.6%) | 825 (41.1%) |
| 4.0x or more | 205 (27.7%) | 381 (19.0%) |
| Total | 740 (100.0%) | 2,007 (100.0%) |
Real Estate Taxes by Mortgage Status in Fountain Inn
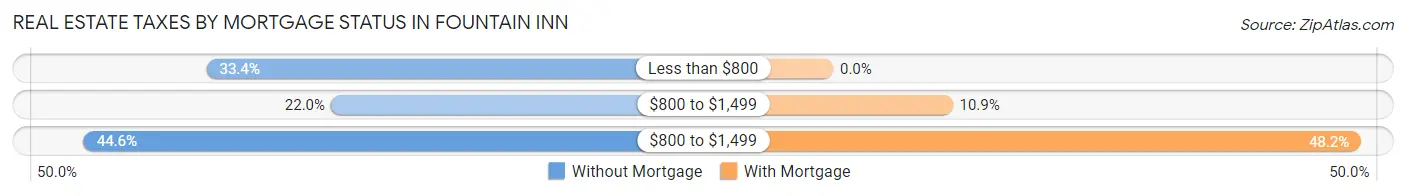
| Property Taxes | Without Mortgage | With Mortgage |
| Less than $800 | 247 (33.4%) | 0 (0.0%) |
| $800 to $1,499 | 163 (22.0%) | 219 (10.9%) |
| $800 to $1,499 | 330 (44.6%) | 968 (48.2%) |
| Total | 740 (100.0%) | 2,007 (100.0%) |
Health & Disability in Fountain Inn
Health Insurance Coverage by Age in Fountain Inn
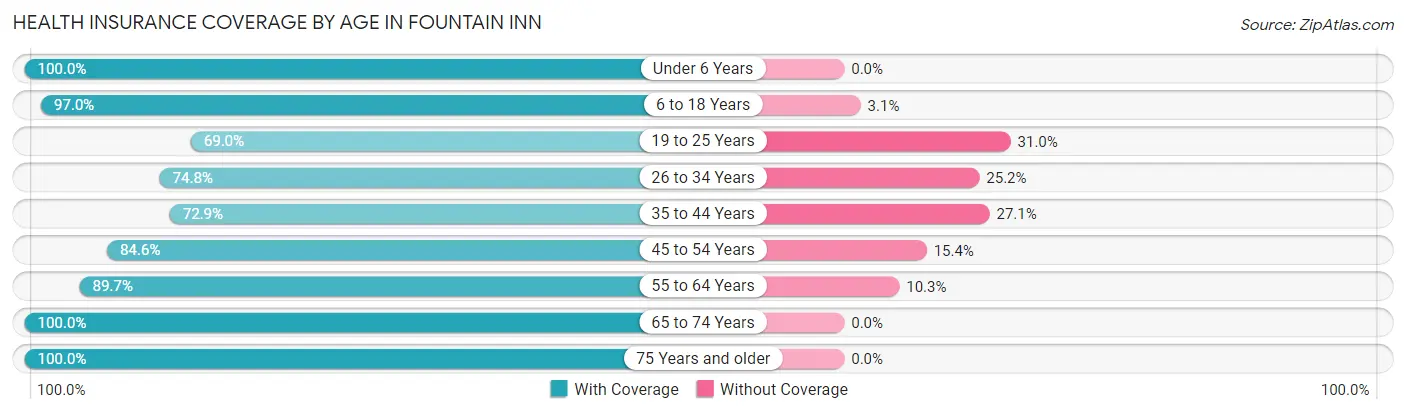
| Age Bracket | With Coverage | Without Coverage |
| Under 6 Years | 1,153 (100.0%) | 0 (0.0%) |
| 6 to 18 Years | 1,878 (97.0%) | 59 (3.0%) |
| 19 to 25 Years | 465 (69.0%) | 209 (31.0%) |
| 26 to 34 Years | 1,348 (74.8%) | 454 (25.2%) |
| 35 to 44 Years | 1,182 (72.9%) | 439 (27.1%) |
| 45 to 54 Years | 969 (84.6%) | 176 (15.4%) |
| 55 to 64 Years | 1,207 (89.7%) | 138 (10.3%) |
| 65 to 74 Years | 582 (100.0%) | 0 (0.0%) |
| 75 Years and older | 326 (100.0%) | 0 (0.0%) |
| Total | 9,110 (86.1%) | 1,475 (13.9%) |
Health Insurance Coverage by Citizenship Status in Fountain Inn
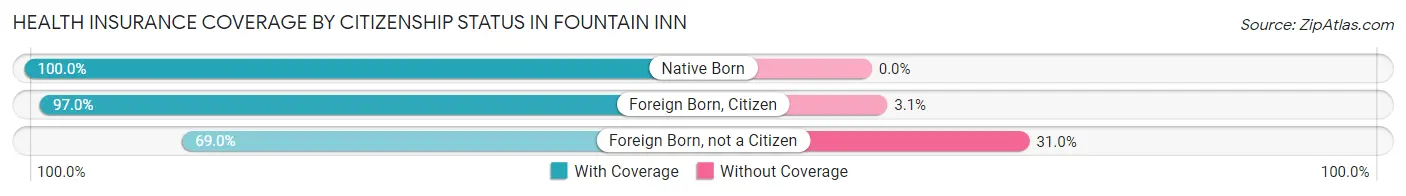
| Citizenship Status | With Coverage | Without Coverage |
| Native Born | 1,153 (100.0%) | 0 (0.0%) |
| Foreign Born, Citizen | 1,878 (97.0%) | 59 (3.0%) |
| Foreign Born, not a Citizen | 465 (69.0%) | 209 (31.0%) |
Health Insurance Coverage by Household Income in Fountain Inn
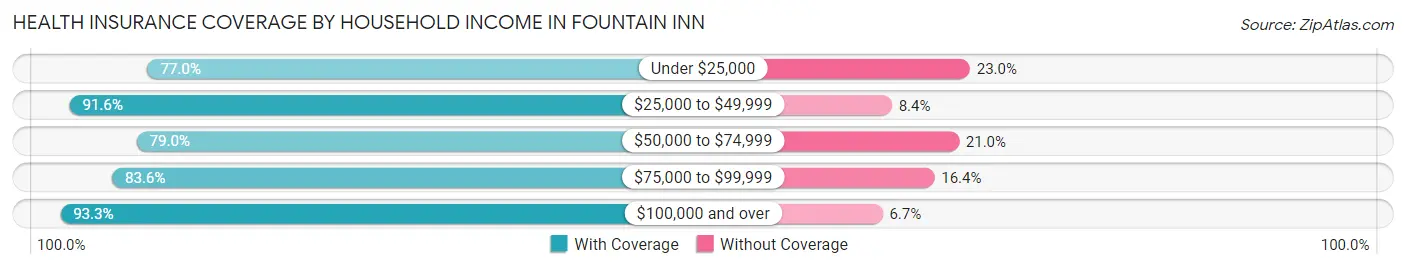
| Household Income | With Coverage | Without Coverage |
| Under $25,000 | 962 (77.0%) | 288 (23.0%) |
| $25,000 to $49,999 | 1,512 (91.6%) | 139 (8.4%) |
| $50,000 to $74,999 | 1,512 (79.0%) | 402 (21.0%) |
| $75,000 to $99,999 | 2,235 (83.6%) | 438 (16.4%) |
| $100,000 and over | 2,862 (93.3%) | 205 (6.7%) |
Public vs Private Health Insurance Coverage by Age in Fountain Inn
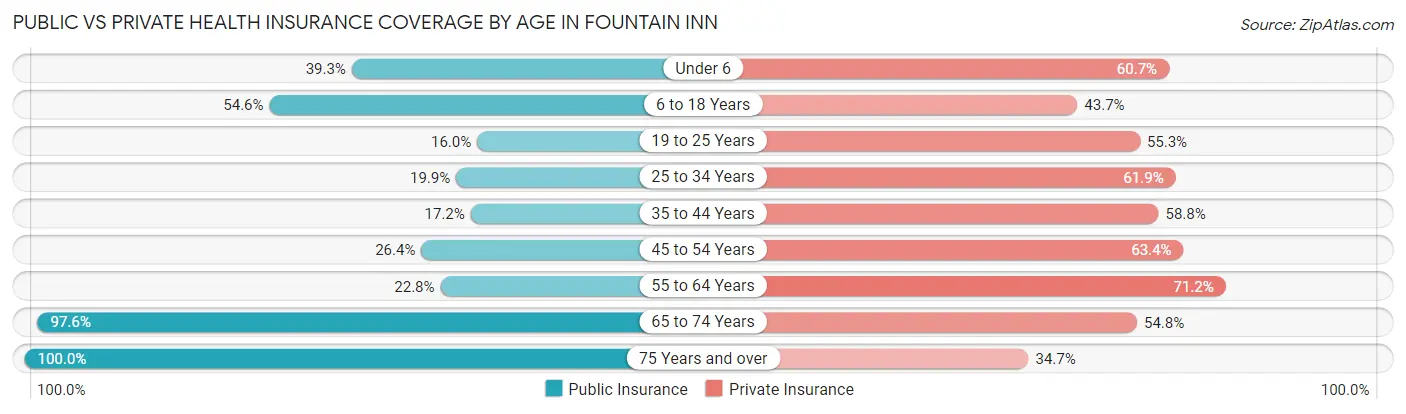
| Age Bracket | Public Insurance | Private Insurance |
| Under 6 | 453 (39.3%) | 700 (60.7%) |
| 6 to 18 Years | 1,057 (54.6%) | 847 (43.7%) |
| 19 to 25 Years | 108 (16.0%) | 373 (55.3%) |
| 25 to 34 Years | 359 (19.9%) | 1,116 (61.9%) |
| 35 to 44 Years | 279 (17.2%) | 953 (58.8%) |
| 45 to 54 Years | 302 (26.4%) | 726 (63.4%) |
| 55 to 64 Years | 307 (22.8%) | 958 (71.2%) |
| 65 to 74 Years | 568 (97.6%) | 319 (54.8%) |
| 75 Years and over | 326 (100.0%) | 113 (34.7%) |
| Total | 3,759 (35.5%) | 6,105 (57.7%) |
Disability Status by Sex by Age in Fountain Inn
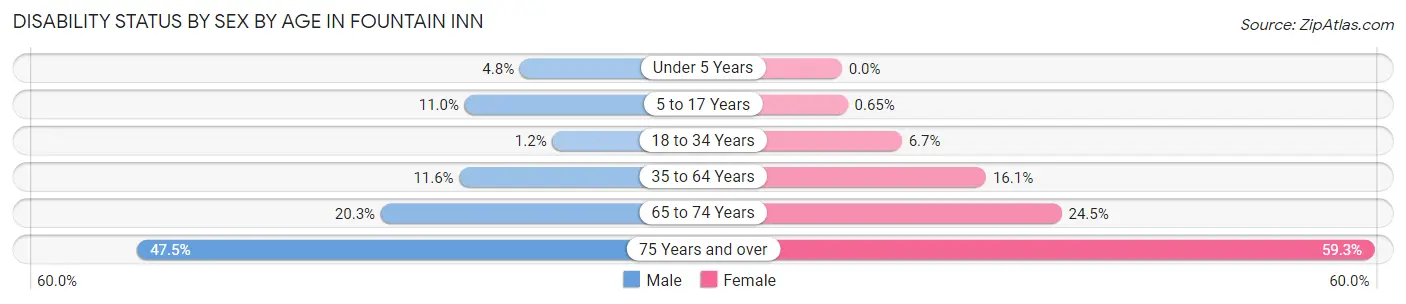
| Age Bracket | Male | Female |
| Under 5 Years | 27 (4.8%) | 0 (0.0%) |
| 5 to 17 Years | 101 (11.0%) | 7 (0.6%) |
| 18 to 34 Years | 16 (1.2%) | 87 (6.7%) |
| 35 to 64 Years | 230 (11.6%) | 341 (16.1%) |
| 65 to 74 Years | 51 (20.3%) | 81 (24.5%) |
| 75 Years and over | 65 (47.4%) | 112 (59.3%) |
Disability Class by Sex by Age in Fountain Inn
Disability Class: Hearing Difficulty
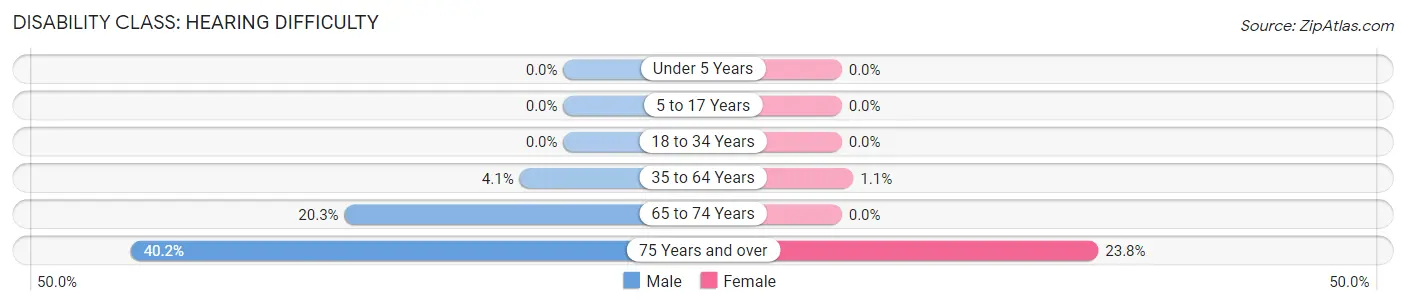
| Age Bracket | Male | Female |
| Under 5 Years | 0 (0.0%) | 0 (0.0%) |
| 5 to 17 Years | 0 (0.0%) | 0 (0.0%) |
| 18 to 34 Years | 0 (0.0%) | 0 (0.0%) |
| 35 to 64 Years | 81 (4.1%) | 23 (1.1%) |
| 65 to 74 Years | 51 (20.3%) | 0 (0.0%) |
| 75 Years and over | 55 (40.2%) | 45 (23.8%) |
Disability Class: Vision Difficulty
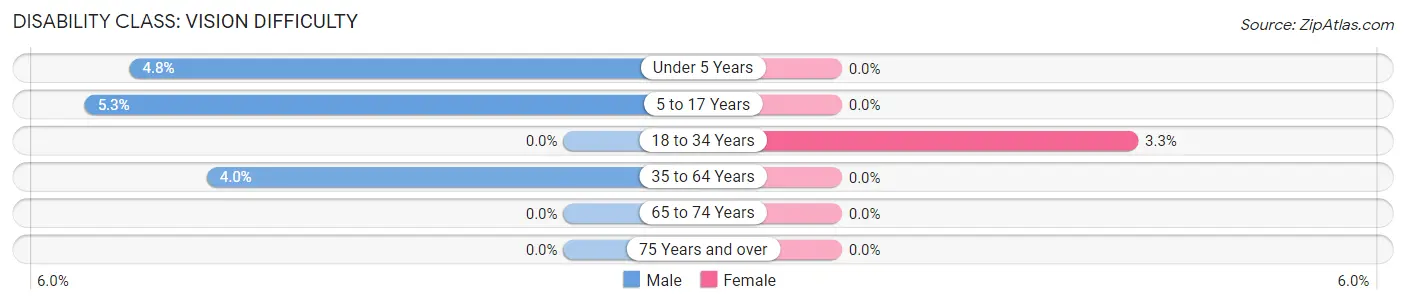
| Age Bracket | Male | Female |
| Under 5 Years | 27 (4.8%) | 0 (0.0%) |
| 5 to 17 Years | 49 (5.3%) | 0 (0.0%) |
| 18 to 34 Years | 0 (0.0%) | 43 (3.3%) |
| 35 to 64 Years | 79 (4.0%) | 0 (0.0%) |
| 65 to 74 Years | 0 (0.0%) | 0 (0.0%) |
| 75 Years and over | 0 (0.0%) | 0 (0.0%) |
Disability Class: Cognitive Difficulty
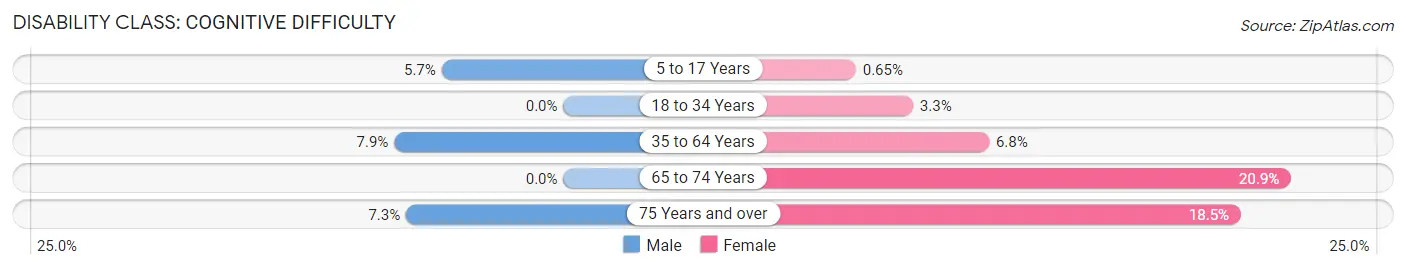
| Age Bracket | Male | Female |
| 5 to 17 Years | 52 (5.7%) | 7 (0.6%) |
| 18 to 34 Years | 0 (0.0%) | 43 (3.3%) |
| 35 to 64 Years | 156 (7.9%) | 145 (6.8%) |
| 65 to 74 Years | 0 (0.0%) | 69 (20.8%) |
| 75 Years and over | 10 (7.3%) | 35 (18.5%) |
Disability Class: Ambulatory Difficulty

| Age Bracket | Male | Female |
| 5 to 17 Years | 0 (0.0%) | 0 (0.0%) |
| 18 to 34 Years | 16 (1.2%) | 0 (0.0%) |
| 35 to 64 Years | 79 (4.0%) | 177 (8.3%) |
| 65 to 74 Years | 0 (0.0%) | 81 (24.5%) |
| 75 Years and over | 33 (24.1%) | 112 (59.3%) |
Disability Class: Self-Care Difficulty
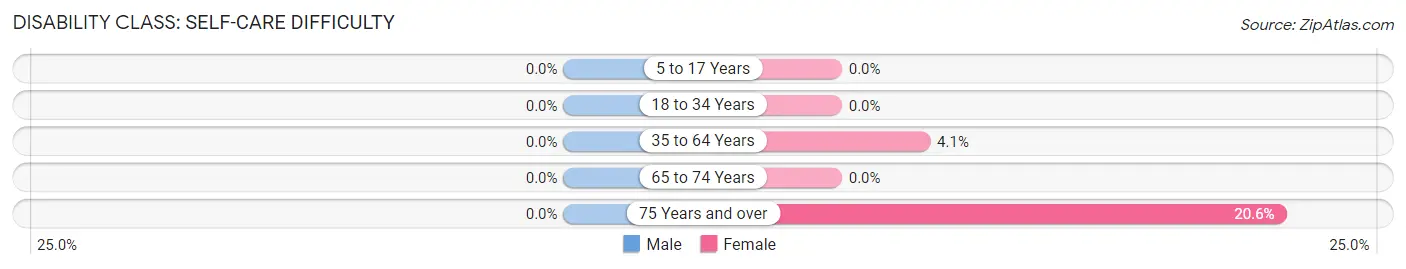
| Age Bracket | Male | Female |
| 5 to 17 Years | 0 (0.0%) | 0 (0.0%) |
| 18 to 34 Years | 0 (0.0%) | 0 (0.0%) |
| 35 to 64 Years | 0 (0.0%) | 87 (4.1%) |
| 65 to 74 Years | 0 (0.0%) | 0 (0.0%) |
| 75 Years and over | 0 (0.0%) | 39 (20.6%) |
Technology Access in Fountain Inn
Computing Device Access in Fountain Inn
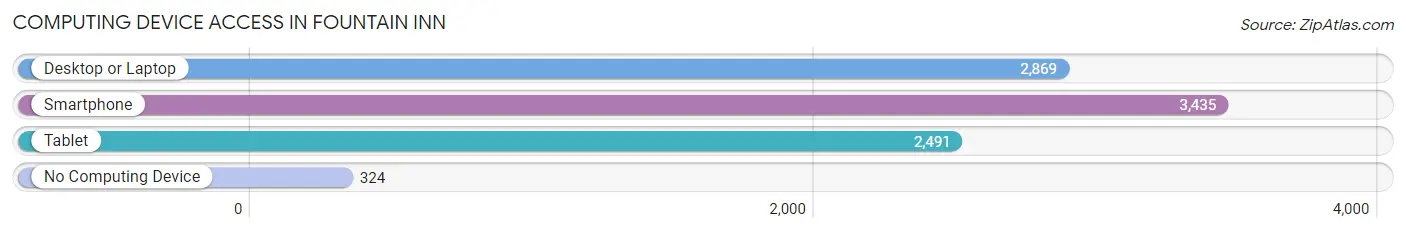
| Device Type | # Households | % Households |
| Desktop or Laptop | 2,869 | 74.0% |
| Smartphone | 3,435 | 88.5% |
| Tablet | 2,491 | 64.2% |
| No Computing Device | 324 | 8.4% |
| Total | 3,879 | 100.0% |
Internet Access in Fountain Inn
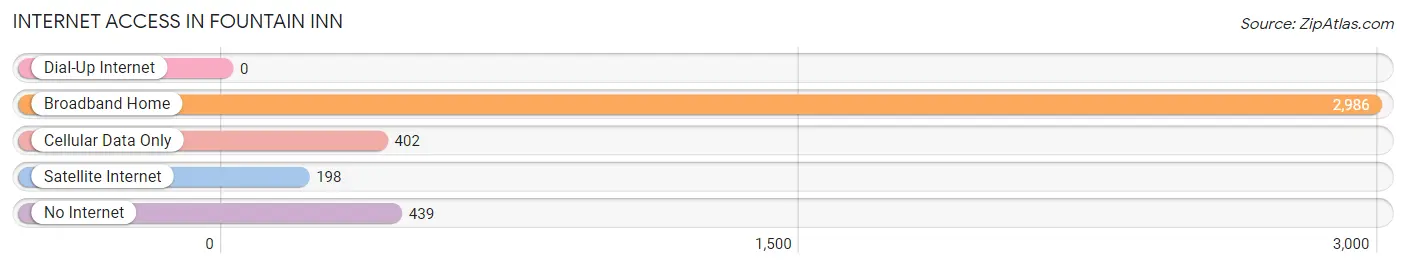
| Internet Type | # Households | % Households |
| Dial-Up Internet | 0 | 0.0% |
| Broadband Home | 2,986 | 77.0% |
| Cellular Data Only | 402 | 10.4% |
| Satellite Internet | 198 | 5.1% |
| No Internet | 439 | 11.3% |
| Total | 3,879 | 100.0% |
Fountain Inn Summary
Fountain Inn is a small city located in the Upstate region of South Carolina. It is situated in Laurens County, approximately 20 miles south of Greenville and 25 miles north of Columbia. The city is known for its historic downtown area, which is home to a variety of shops, restaurants, and other businesses. The city is also home to several parks and recreational areas, including the Fountain Inn City Park and the Laurens County Recreation Center.
History
Fountain Inn was founded in 1820 by James McElhaney, who named the city after a nearby spring. The city was incorporated in 1871 and was originally a farming community. In the late 19th century, the city began to grow as a manufacturing center, with several cotton mills and other factories being built in the area. The city continued to grow throughout the 20th century, and today it is a thriving community with a population of over 7,000.
Geography
Fountain Inn is located in the foothills of the Blue Ridge Mountains, and is part of the Piedmont region of South Carolina. The city is situated at an elevation of 830 feet above sea level, and is located at the intersection of Interstate 385 and US Highway 25. The city is bordered by the cities of Laurens, Simpsonville, and Gray Court. The city is also located near several lakes, including Lake Greenwood and Lake Rabon.
Economy
Fountain Inn’s economy is largely based on manufacturing and agriculture. The city is home to several factories, including a textile mill, a paper mill, and a plastics plant. The city is also home to several farms, which produce a variety of crops, including corn, soybeans, and cotton. In addition, the city is home to several retail stores, restaurants, and other businesses.
Demographics
As of the 2010 census, the population of Fountain Inn was 7,799. The racial makeup of the city was 79.2% White, 16.2% African American, 0.4% Native American, 1.2% Asian, 0.1% Pacific Islander, 1.3% from other races, and 1.7% from two or more races. Hispanic or Latino of any race were 3.2% of the population. The median household income in the city was $41,945, and the median family income was $50,945.
Fountain Inn is a small city with a rich history and a vibrant economy. The city is home to a variety of businesses, parks, and recreational areas, and is a great place to live and work. The city is also home to a diverse population, with a variety of racial and ethnic backgrounds. With its close proximity to major cities and its strong economy, Fountain Inn is an ideal place to call home.
Common Questions
What is Per Capita Income in Fountain Inn?
Per Capita income in Fountain Inn is $30,185.
What is the Median Family Income in Fountain Inn?
Median Family Income in Fountain Inn is $79,670.
What is the Median Household income in Fountain Inn?
Median Household Income in Fountain Inn is $73,665.
What is Income or Wage Gap in Fountain Inn?
Income or Wage Gap in Fountain Inn is 22.6%.
Women in Fountain Inn earn 77.4 cents for every dollar earned by a man.
What is Family Income Deficit in Fountain Inn?
Family Income Deficit in Fountain Inn is $10,279.
Families that are below poverty line in Fountain Inn earn $10,279 less on average than the poverty threshold level.
What is Inequality or Gini Index in Fountain Inn?
Inequality or Gini Index in Fountain Inn is 0.37.
What is the Total Population of Fountain Inn?
Total Population of Fountain Inn is 10,675.
What is the Total Male Population of Fountain Inn?
Total Male Population of Fountain Inn is 5,191.
What is the Total Female Population of Fountain Inn?
Total Female Population of Fountain Inn is 5,484.
What is the Ratio of Males per 100 Females in Fountain Inn?
There are 94.66 Males per 100 Females in Fountain Inn.
What is the Ratio of Females per 100 Males in Fountain Inn?
There are 105.64 Females per 100 Males in Fountain Inn.
What is the Median Population Age in Fountain Inn?
Median Population Age in Fountain Inn is 33.4 Years.
What is the Average Family Size in Fountain Inn
Average Family Size in Fountain Inn is 3.0 People.
What is the Average Household Size in Fountain Inn
Average Household Size in Fountain Inn is 2.7 People.
How Large is the Labor Force in Fountain Inn?
There are 5,338 People in the Labor Forcein in Fountain Inn.
What is the Percentage of People in the Labor Force in Fountain Inn?
67.1% of People are in the Labor Force in Fountain Inn.
What is the Unemployment Rate in Fountain Inn?
Unemployment Rate in Fountain Inn is 9.6%.