Hardeeville, SC Map & Demographics
Hardeeville Map
Hardeeville Overview
$47,552
PER CAPITA INCOME
$88,365
AVG FAMILY INCOME
$75,948
AVG HOUSEHOLD INCOME
24.7%
WAGE / INCOME GAP [ % ]
75.3¢/ $1
WAGE / INCOME GAP [ $ ]
0.42
INEQUALITY / GINI INDEX
8,048
TOTAL POPULATION
4,110
MALE POPULATION
3,938
FEMALE POPULATION
104.37
MALES / 100 FEMALES
95.82
FEMALES / 100 MALES
60.3
MEDIAN AGE
2.2
AVG FAMILY SIZE
2.0
AVG HOUSEHOLD SIZE
3,575
LABOR FORCE [ PEOPLE ]
48.0%
PERCENT IN LABOR FORCE
9.0%
UNEMPLOYMENT RATE
Hardeeville Zip Codes
Hardeeville Area Codes
Income in Hardeeville
Income Overview in Hardeeville
Per Capita Income in Hardeeville is $47,552, while median incomes of families and households are $88,365 and $75,948 respectively.
| Characteristic | Number | Measure |
| Per Capita Income | 8,048 | $47,552 |
| Median Family Income | 2,601 | $88,365 |
| Mean Family Income | 2,601 | $113,060 |
| Median Household Income | 4,102 | $75,948 |
| Mean Household Income | 4,102 | $94,090 |
| Income Deficit | 2,601 | $0 |
| Wage / Income Gap (%) | 8,048 | 24.71% |
| Wage / Income Gap ($) | 8,048 | 75.29¢ per $1 |
| Gini / Inequality Index | 8,048 | 0.42 |
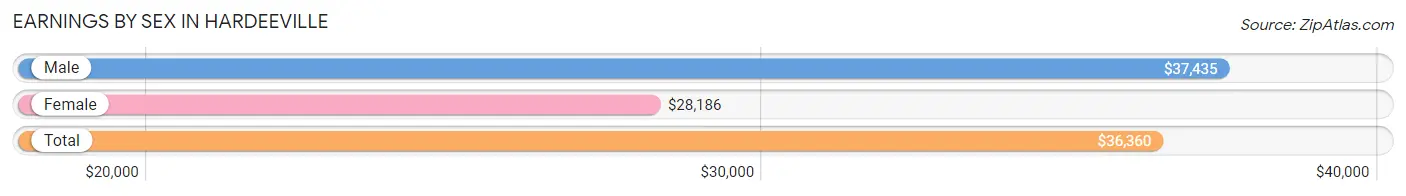
Earnings by Sex in Hardeeville
Average Earnings in Hardeeville are $36,360, $37,435 for men and $28,186 for women, a difference of 24.7%.
| Sex | Number | Average Earnings |
| Male | 2,047 (54.6%) | $37,435 |
| Female | 1,702 (45.4%) | $28,186 |
| Total | 3,749 (100.0%) | $36,360 |
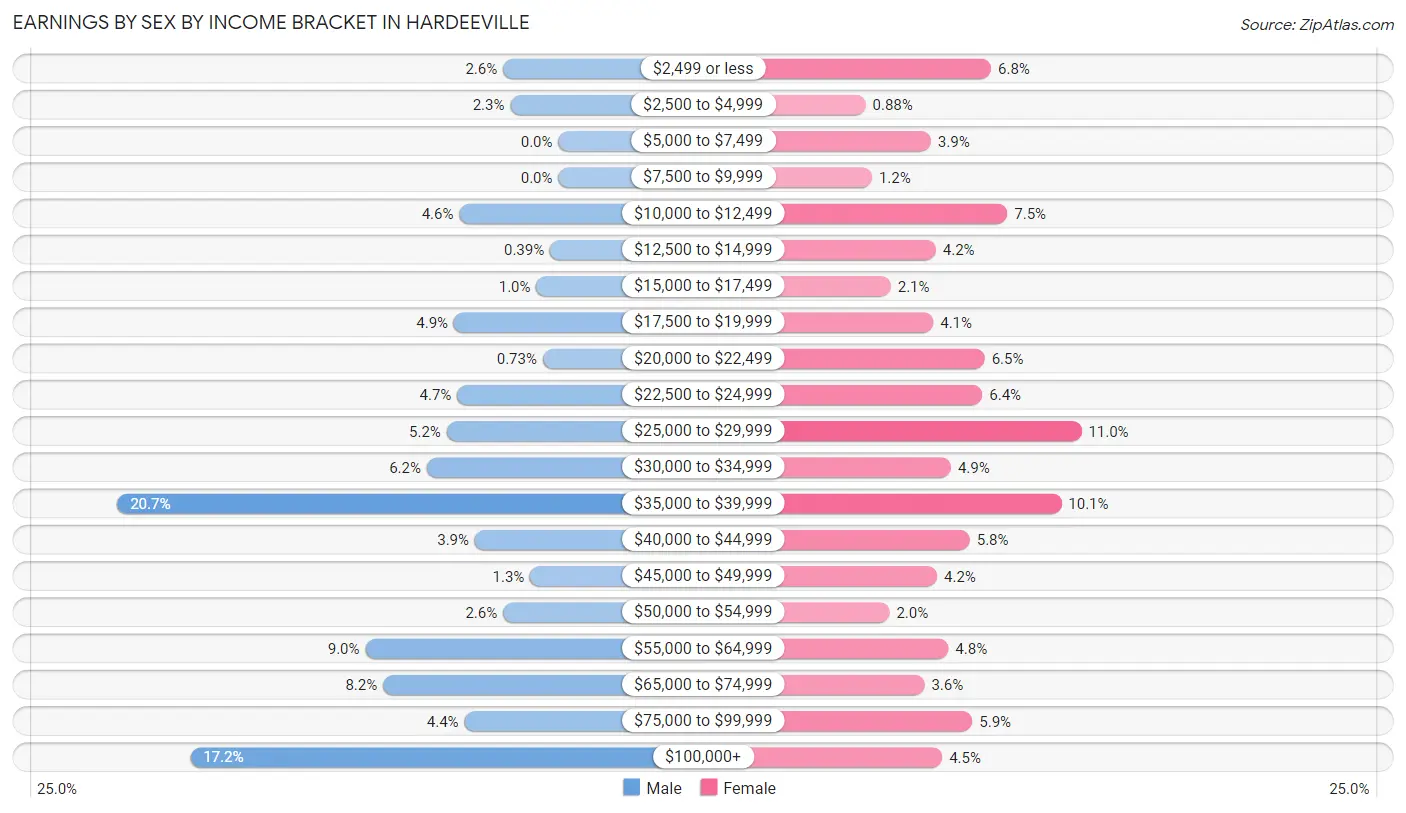
Earnings by Sex by Income Bracket in Hardeeville
The most common earnings brackets in Hardeeville are $35,000 to $39,999 for men (423 | 20.7%) and $25,000 to $29,999 for women (187 | 11.0%).
| Income | Male | Female |
| $2,499 or less | 53 (2.6%) | 115 (6.8%) |
| $2,500 to $4,999 | 46 (2.2%) | 15 (0.9%) |
| $5,000 to $7,499 | 0 (0.0%) | 67 (3.9%) |
| $7,500 to $9,999 | 0 (0.0%) | 20 (1.2%) |
| $10,000 to $12,499 | 95 (4.6%) | 128 (7.5%) |
| $12,500 to $14,999 | 8 (0.4%) | 71 (4.2%) |
| $15,000 to $17,499 | 21 (1.0%) | 35 (2.1%) |
| $17,500 to $19,999 | 100 (4.9%) | 69 (4.1%) |
| $20,000 to $22,499 | 15 (0.7%) | 110 (6.5%) |
| $22,500 to $24,999 | 97 (4.7%) | 108 (6.4%) |
| $25,000 to $29,999 | 107 (5.2%) | 187 (11.0%) |
| $30,000 to $34,999 | 126 (6.2%) | 83 (4.9%) |
| $35,000 to $39,999 | 423 (20.7%) | 171 (10.1%) |
| $40,000 to $44,999 | 80 (3.9%) | 98 (5.8%) |
| $45,000 to $49,999 | 27 (1.3%) | 72 (4.2%) |
| $50,000 to $54,999 | 53 (2.6%) | 34 (2.0%) |
| $55,000 to $64,999 | 185 (9.0%) | 81 (4.8%) |
| $65,000 to $74,999 | 168 (8.2%) | 62 (3.6%) |
| $75,000 to $99,999 | 90 (4.4%) | 100 (5.9%) |
| $100,000+ | 353 (17.2%) | 76 (4.5%) |
| Total | 2,047 (100.0%) | 1,702 (100.0%) |
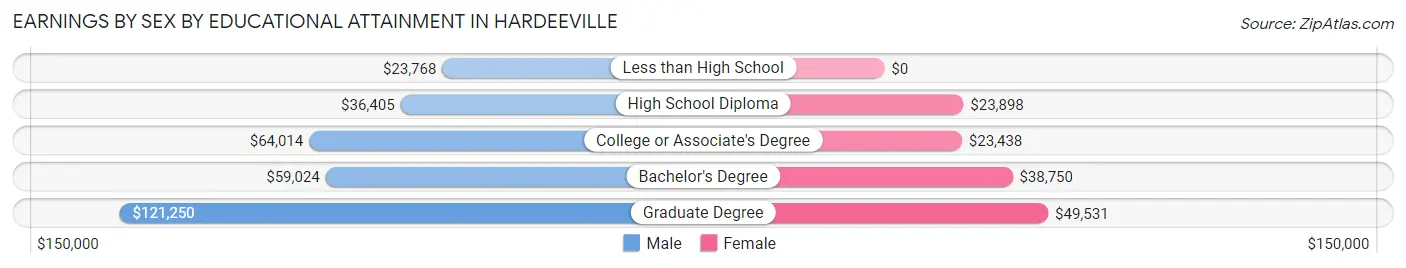
Earnings by Sex by Educational Attainment in Hardeeville
Average earnings in Hardeeville are $37,823 for men and $27,566 for women, a difference of 27.1%. Men with an educational attainment of graduate degree enjoy the highest average annual earnings of $121,250, while those with less than high school education earn the least with $23,768. Women with an educational attainment of graduate degree earn the most with the average annual earnings of $49,531, while those with college or associate's degree education have the smallest earnings of $23,438.
| Educational Attainment | Male Income | Female Income |
| Less than High School | $23,768 | $0 |
| High School Diploma | $36,405 | $23,898 |
| College or Associate's Degree | $64,014 | $23,438 |
| Bachelor's Degree | $59,024 | $38,750 |
| Graduate Degree | $121,250 | $49,531 |
| Total | $37,823 | $27,566 |
Family Income in Hardeeville
Family Income Brackets in Hardeeville
According to the Hardeeville family income data, there are 757 families falling into the $100,000 to $149,999 income range, which is the most common income bracket and makes up 29.1% of all families. Conversely, the $10,000 to $14,999 income bracket is the least frequent group with only 13 families (0.5%) belonging to this category.
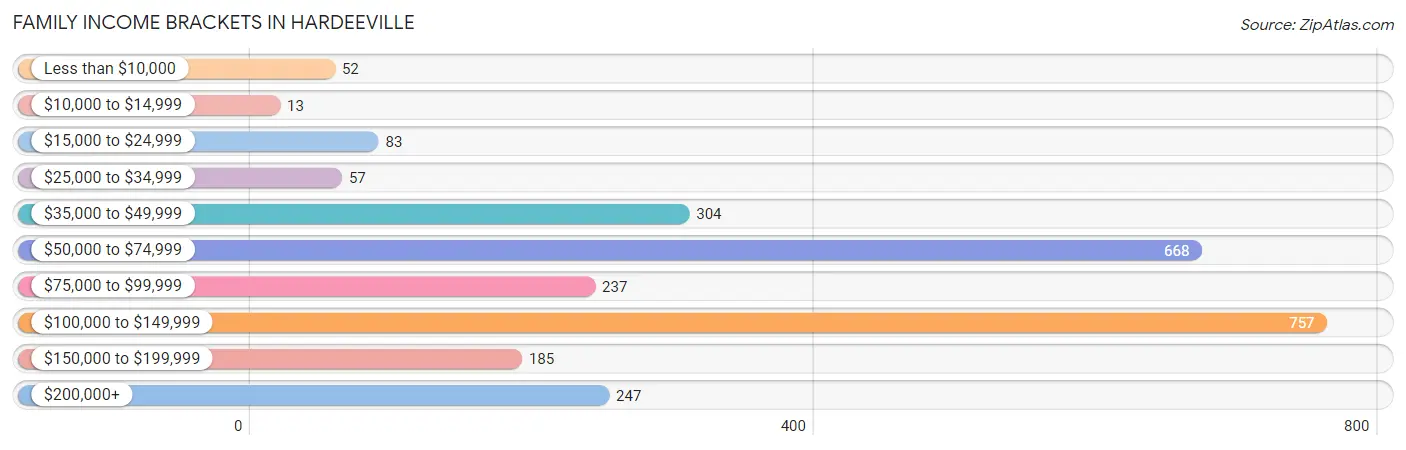
| Income Bracket | # Families | % Families |
| Less than $10,000 | 52 | 2.0% |
| $10,000 to $14,999 | 13 | 0.5% |
| $15,000 to $24,999 | 83 | 3.2% |
| $25,000 to $34,999 | 57 | 2.2% |
| $35,000 to $49,999 | 304 | 11.7% |
| $50,000 to $74,999 | 668 | 25.7% |
| $75,000 to $99,999 | 237 | 9.1% |
| $100,000 to $149,999 | 757 | 29.1% |
| $150,000 to $199,999 | 185 | 7.1% |
| $200,000+ | 247 | 9.5% |
Family Income by Famaliy Size in Hardeeville
3-person families (214 | 8.2%) account for the highest median family income in Hardeeville with $123,750 per family, while 2-person families (2,233 | 85.9%) have the highest median income of $42,784 per family member.
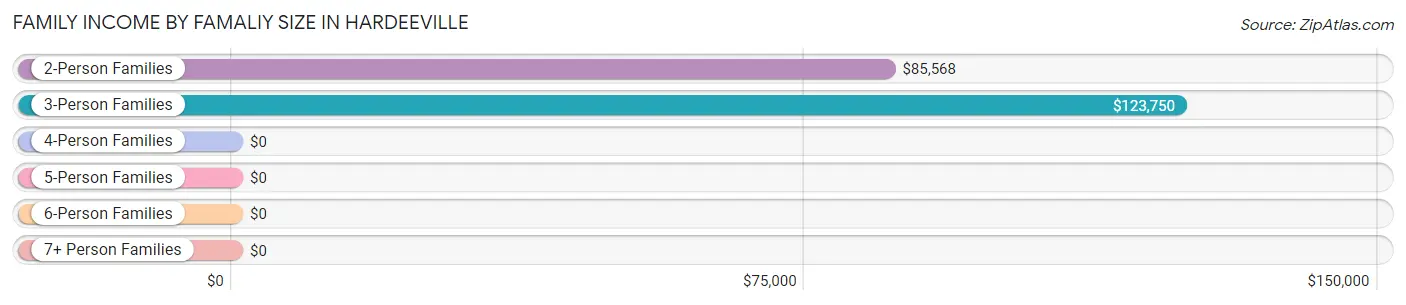
| Income Bracket | # Families | Median Income |
| 2-Person Families | 2,233 (85.9%) | $85,568 |
| 3-Person Families | 214 (8.2%) | $123,750 |
| 4-Person Families | 110 (4.2%) | $0 |
| 5-Person Families | 25 (1.0%) | $0 |
| 6-Person Families | 0 (0.0%) | $0 |
| 7+ Person Families | 19 (0.7%) | $0 |
| Total | 2,601 (100.0%) | $88,365 |
Family Income by Number of Earners in Hardeeville
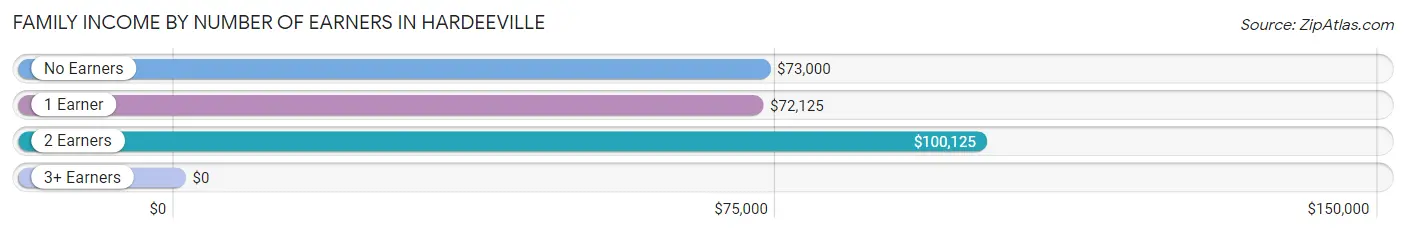
| Number of Earners | # Families | Median Income |
| No Earners | 1,040 (40.0%) | $73,000 |
| 1 Earner | 679 (26.1%) | $72,125 |
| 2 Earners | 808 (31.1%) | $100,125 |
| 3+ Earners | 74 (2.9%) | $0 |
| Total | 2,601 (100.0%) | $88,365 |
Household Income in Hardeeville
Household Income Brackets in Hardeeville
With 952 households falling in the category, the $100,000 to $149,999 income range is the most frequent in Hardeeville, accounting for 23.2% of all households. In contrast, only 12 households (0.3%) fall into the $10,000 to $14,999 income bracket, making it the least populous group.
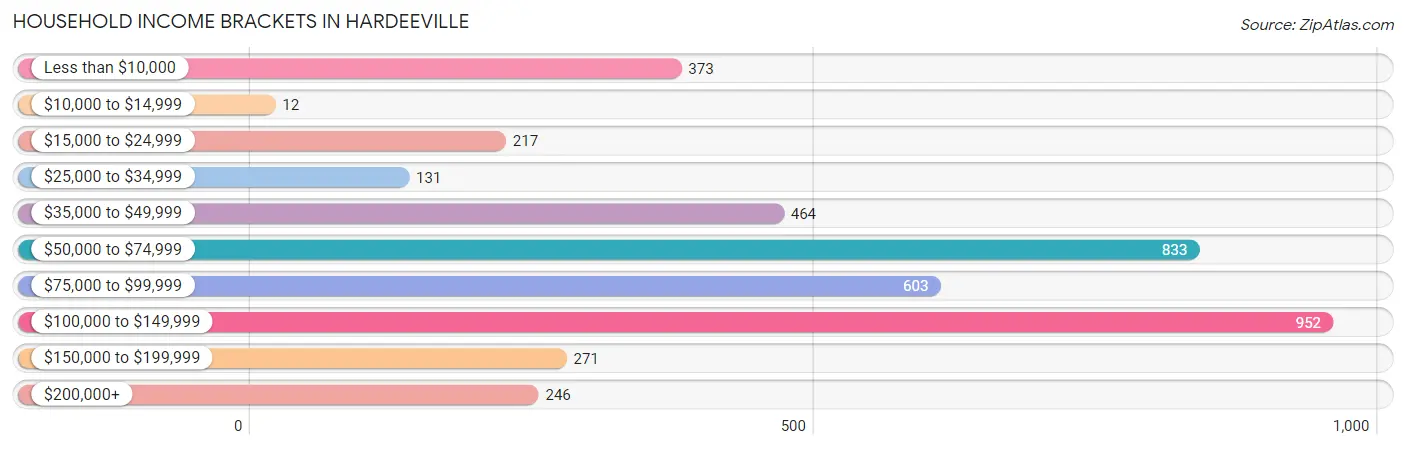
| Income Bracket | # Households | % Households |
| Less than $10,000 | 373 | 9.1% |
| $10,000 to $14,999 | 12 | 0.3% |
| $15,000 to $24,999 | 217 | 5.3% |
| $25,000 to $34,999 | 131 | 3.2% |
| $35,000 to $49,999 | 464 | 11.3% |
| $50,000 to $74,999 | 833 | 20.3% |
| $75,000 to $99,999 | 603 | 14.7% |
| $100,000 to $149,999 | 952 | 23.2% |
| $150,000 to $199,999 | 271 | 6.6% |
| $200,000+ | 246 | 6.0% |
Household Income by Householder Age in Hardeeville
The median household income in Hardeeville is $75,948, with the highest median household income of $100,466 found in the 45 to 64 years age bracket for the primary householder. A total of 1,295 households (31.6%) fall into this category. Meanwhile, the 15 to 24 years age bracket for the primary householder has the lowest median household income of $2,499, with 247 households (6.0%) in this group.
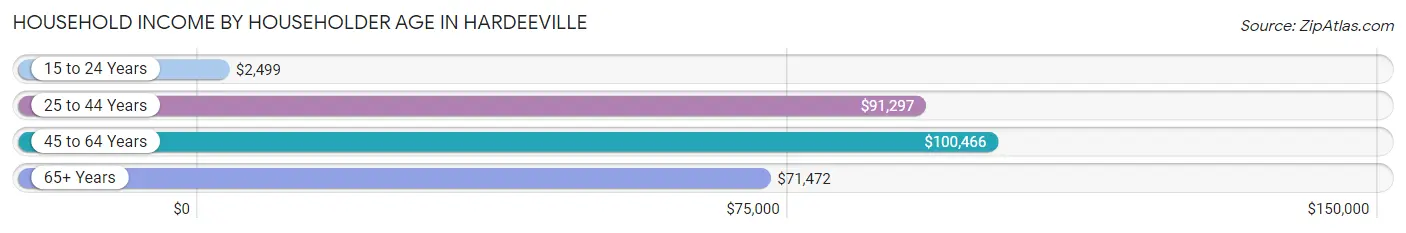
| Income Bracket | # Households | Median Income |
| 15 to 24 Years | 247 (6.0%) | $2,499 |
| 25 to 44 Years | 659 (16.1%) | $91,297 |
| 45 to 64 Years | 1,295 (31.6%) | $100,466 |
| 65+ Years | 1,901 (46.3%) | $71,472 |
| Total | 4,102 (100.0%) | $75,948 |
Poverty in Hardeeville
Income Below Poverty by Sex and Age in Hardeeville
With 8.4% poverty level for males and 9.1% for females among the residents of Hardeeville, 18 to 24 year old males and under 5 year old females are the most vulnerable to poverty, with 129 males (53.3%) and 24 females (30.0%) in their respective age groups living below the poverty level.
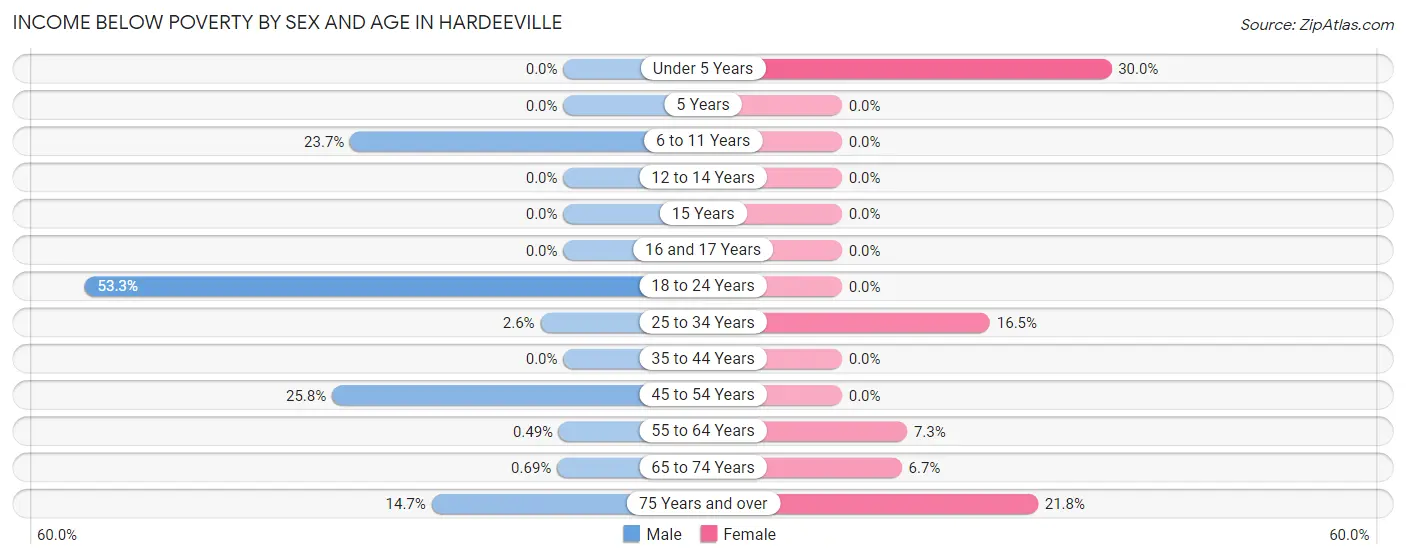
| Age Bracket | Male | Female |
| Under 5 Years | 0 (0.0%) | 24 (30.0%) |
| 5 Years | 0 (0.0%) | 0 (0.0%) |
| 6 to 11 Years | 33 (23.7%) | 0 (0.0%) |
| 12 to 14 Years | 0 (0.0%) | 0 (0.0%) |
| 15 Years | 0 (0.0%) | 0 (0.0%) |
| 16 and 17 Years | 0 (0.0%) | 0 (0.0%) |
| 18 to 24 Years | 129 (53.3%) | 0 (0.0%) |
| 25 to 34 Years | 14 (2.5%) | 76 (16.5%) |
| 35 to 44 Years | 0 (0.0%) | 0 (0.0%) |
| 45 to 54 Years | 93 (25.8%) | 0 (0.0%) |
| 55 to 64 Years | 4 (0.5%) | 74 (7.3%) |
| 65 to 74 Years | 7 (0.7%) | 73 (6.7%) |
| 75 Years and over | 60 (14.7%) | 105 (21.8%) |
| Total | 340 (8.4%) | 352 (9.1%) |
Income Above Poverty by Sex and Age in Hardeeville
According to the poverty statistics in Hardeeville, males aged under 5 years and females aged 5 years are the age groups that are most secure financially, with 100.0% of males and 100.0% of females in these age groups living above the poverty line.
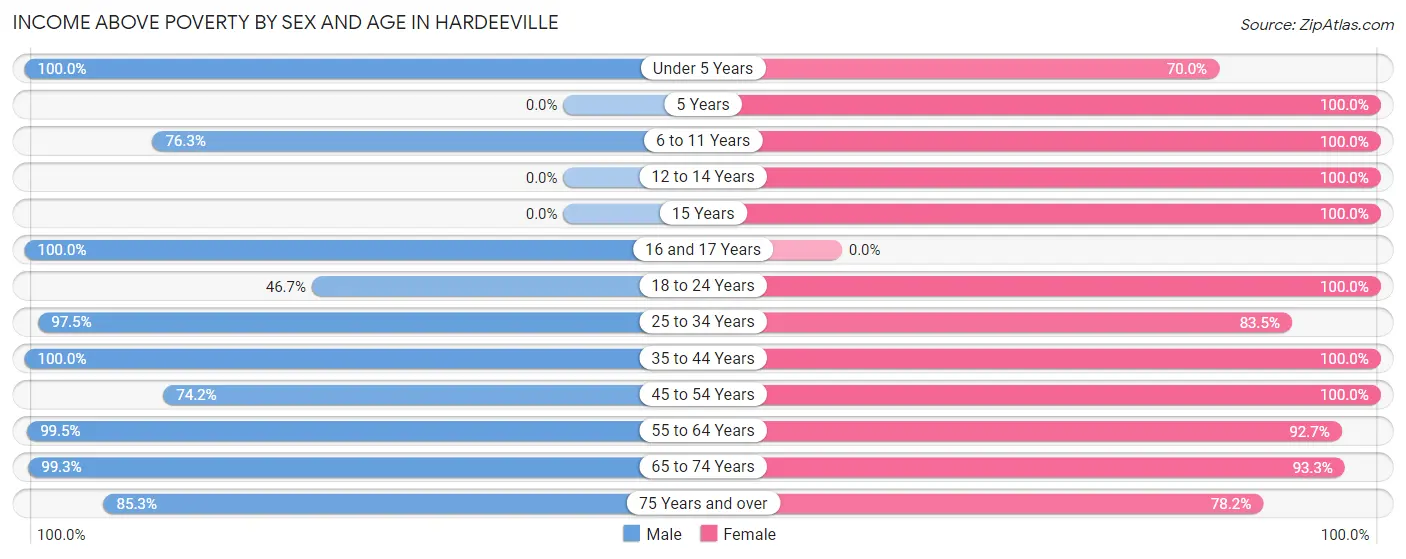
| Age Bracket | Male | Female |
| Under 5 Years | 72 (100.0%) | 56 (70.0%) |
| 5 Years | 0 (0.0%) | 29 (100.0%) |
| 6 to 11 Years | 106 (76.3%) | 97 (100.0%) |
| 12 to 14 Years | 0 (0.0%) | 15 (100.0%) |
| 15 Years | 0 (0.0%) | 27 (100.0%) |
| 16 and 17 Years | 57 (100.0%) | 0 (0.0%) |
| 18 to 24 Years | 113 (46.7%) | 108 (100.0%) |
| 25 to 34 Years | 536 (97.5%) | 385 (83.5%) |
| 35 to 44 Years | 375 (100.0%) | 76 (100.0%) |
| 45 to 54 Years | 268 (74.2%) | 377 (100.0%) |
| 55 to 64 Years | 816 (99.5%) | 945 (92.7%) |
| 65 to 74 Years | 1,008 (99.3%) | 1,023 (93.3%) |
| 75 Years and over | 349 (85.3%) | 376 (78.2%) |
| Total | 3,700 (91.6%) | 3,514 (90.9%) |
Income Below Poverty Among Married-Couple Families in Hardeeville
The poverty statistics for married-couple families in Hardeeville show that 0.8% or 17 of the total 2,235 families live below the poverty line. Families with no children have the highest poverty rate of 0.8%, comprising of 17 families. On the other hand, families with 1 or 2 children have the lowest poverty rate of 0.0%, which includes 0 families.
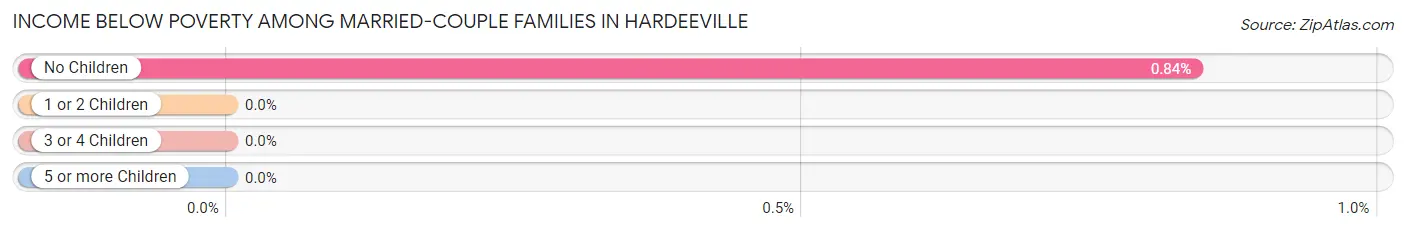
| Children | Above Poverty | Below Poverty |
| No Children | 1,999 (99.2%) | 17 (0.8%) |
| 1 or 2 Children | 194 (100.0%) | 0 (0.0%) |
| 3 or 4 Children | 25 (100.0%) | 0 (0.0%) |
| 5 or more Children | 0 (0.0%) | 0 (0.0%) |
| Total | 2,218 (99.2%) | 17 (0.8%) |
Income Below Poverty Among Single-Parent Households in Hardeeville
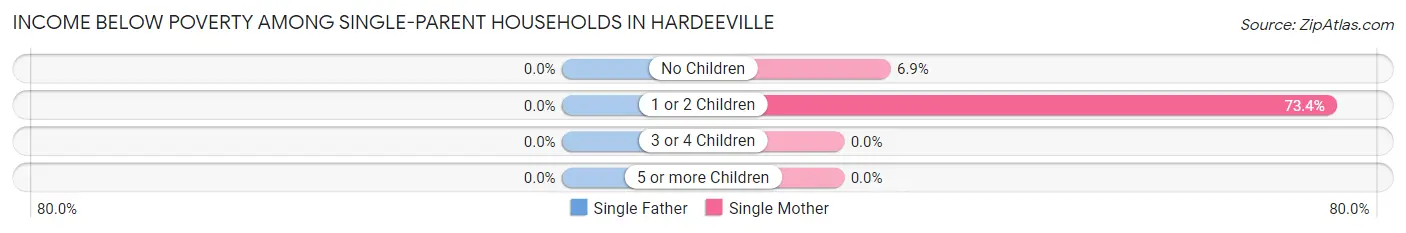
| Children | Single Father | Single Mother |
| No Children | 0 (0.0%) | 13 (6.9%) |
| 1 or 2 Children | 0 (0.0%) | 47 (73.4%) |
| 3 or 4 Children | 0 (0.0%) | 0 (0.0%) |
| 5 or more Children | 0 (0.0%) | 0 (0.0%) |
| Total | 0 (0.0%) | 60 (23.8%) |
Income Below Poverty Among Married-Couple vs Single-Parent Households in Hardeeville
The poverty data for Hardeeville shows that 17 of the married-couple family households (0.8%) and 60 of the single-parent households (16.4%) are living below the poverty level. Within the married-couple family households, those with no children have the highest poverty rate, with 17 households (0.8%) falling below the poverty line. Among the single-parent households, those with 1 or 2 children have the highest poverty rate, with 47 household (52.8%) living below poverty.
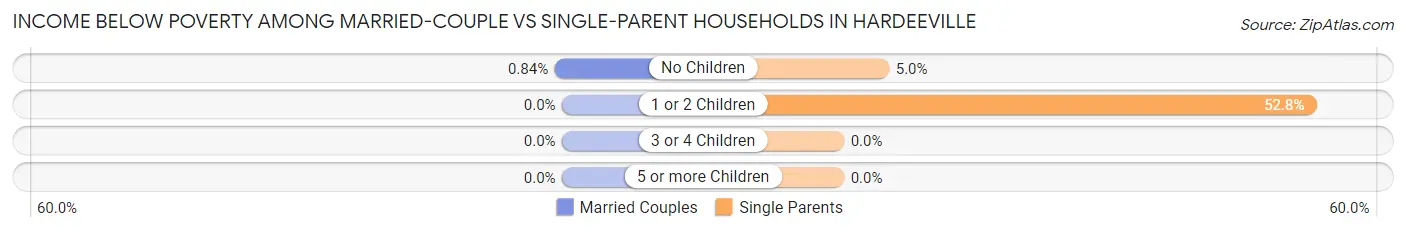
| Children | Married-Couple Families | Single-Parent Households |
| No Children | 17 (0.8%) | 13 (5.0%) |
| 1 or 2 Children | 0 (0.0%) | 47 (52.8%) |
| 3 or 4 Children | 0 (0.0%) | 0 (0.0%) |
| 5 or more Children | 0 (0.0%) | 0 (0.0%) |
| Total | 17 (0.8%) | 60 (16.4%) |
Race in Hardeeville
The most populous races in Hardeeville are White / Caucasian (5,642 | 70.1%), Hispanic or Latino (1,549 | 19.3%), and Black / African American (1,092 | 13.6%).
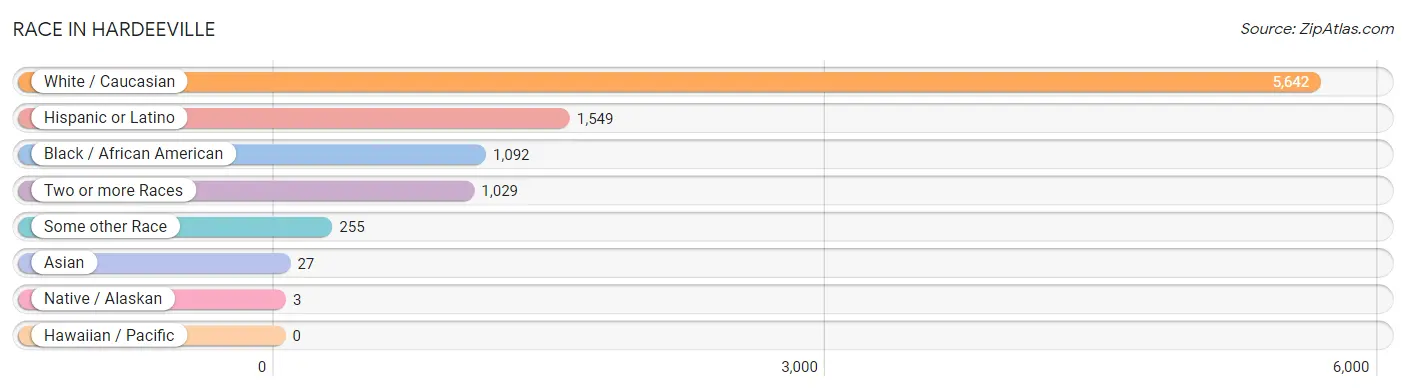
| Race | # Population | % Population |
| Asian | 27 | 0.3% |
| Black / African American | 1,092 | 13.6% |
| Hawaiian / Pacific | 0 | 0.0% |
| Hispanic or Latino | 1,549 | 19.3% |
| Native / Alaskan | 3 | 0.0% |
| White / Caucasian | 5,642 | 70.1% |
| Two or more Races | 1,029 | 12.8% |
| Some other Race | 255 | 3.2% |
| Total | 8,048 | 100.0% |
Ancestry in Hardeeville
The most populous ancestries reported in Hardeeville are Irish (1,148 | 14.3%), German (999 | 12.4%), English (858 | 10.7%), Central American (781 | 9.7%), and Italian (607 | 7.5%), together accounting for 54.6% of all Hardeeville residents.
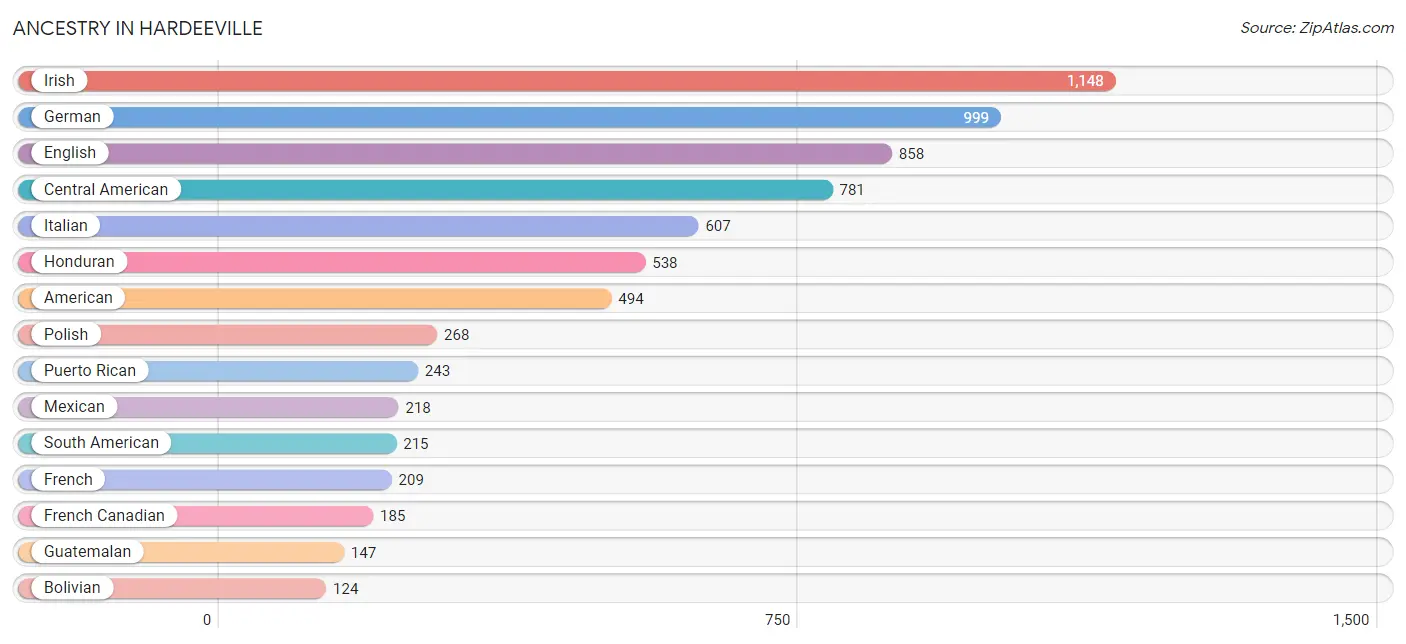
| Ancestry | # Population | % Population |
| African | 91 | 1.1% |
| American | 494 | 6.1% |
| Arab | 64 | 0.8% |
| Armenian | 10 | 0.1% |
| Austrian | 18 | 0.2% |
| Bolivian | 124 | 1.5% |
| British | 81 | 1.0% |
| Burmese | 27 | 0.3% |
| Canadian | 81 | 1.0% |
| Celtic | 11 | 0.1% |
| Central American | 781 | 9.7% |
| Cherokee | 1 | 0.0% |
| Colombian | 91 | 1.1% |
| Costa Rican | 82 | 1.0% |
| Croatian | 14 | 0.2% |
| Cuban | 17 | 0.2% |
| Czech | 29 | 0.4% |
| Dominican | 16 | 0.2% |
| Dutch | 40 | 0.5% |
| Eastern European | 36 | 0.4% |
| English | 858 | 10.7% |
| European | 45 | 0.6% |
| French | 209 | 2.6% |
| French Canadian | 185 | 2.3% |
| German | 999 | 12.4% |
| Greek | 52 | 0.6% |
| Guatemalan | 147 | 1.8% |
| Honduran | 538 | 6.7% |
| Hungarian | 37 | 0.5% |
| Irish | 1,148 | 14.3% |
| Italian | 607 | 7.5% |
| Lebanese | 64 | 0.8% |
| Lithuanian | 14 | 0.2% |
| Lumbee | 3 | 0.0% |
| Mexican | 218 | 2.7% |
| Nicaraguan | 14 | 0.2% |
| Norwegian | 68 | 0.8% |
| Polish | 268 | 3.3% |
| Portuguese | 35 | 0.4% |
| Puerto Rican | 243 | 3.0% |
| Romanian | 29 | 0.4% |
| Russian | 54 | 0.7% |
| Scandinavian | 20 | 0.3% |
| Scotch-Irish | 92 | 1.1% |
| Scottish | 108 | 1.3% |
| Slavic | 18 | 0.2% |
| Slovak | 14 | 0.2% |
| South American | 215 | 2.7% |
| Spaniard | 59 | 0.7% |
| Subsaharan African | 91 | 1.1% |
| Swedish | 64 | 0.8% |
| Swiss | 49 | 0.6% |
| Ukrainian | 73 | 0.9% |
| Welsh | 56 | 0.7% | View All 54 Rows |
Immigrants in Hardeeville
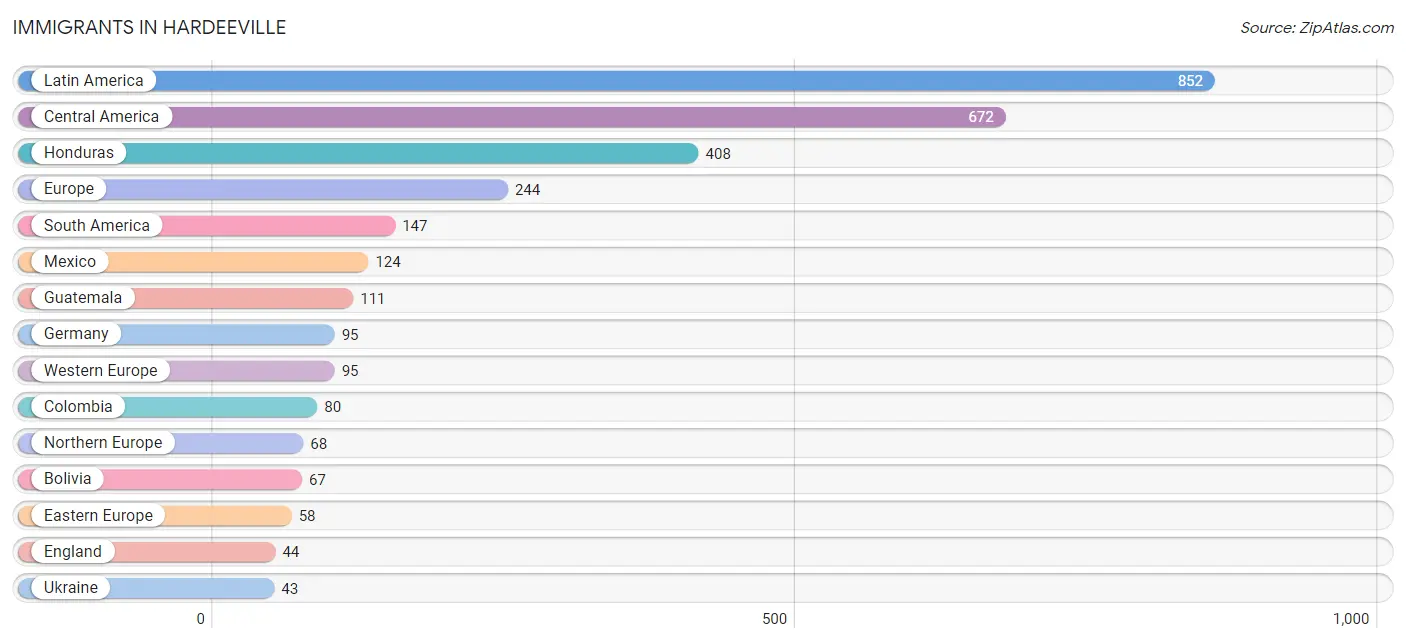
The most numerous immigrant groups reported in Hardeeville came from Latin America (852 | 10.6%), Central America (672 | 8.4%), Honduras (408 | 5.1%), Europe (244 | 3.0%), and South America (147 | 1.8%), together accounting for 28.9% of all Hardeeville residents.
| Immigration Origin | # Population | % Population |
| Asia | 37 | 0.5% |
| Bolivia | 67 | 0.8% |
| Canada | 35 | 0.4% |
| Caribbean | 33 | 0.4% |
| Central America | 672 | 8.4% |
| China | 10 | 0.1% |
| Colombia | 80 | 1.0% |
| Costa Rica | 29 | 0.4% |
| Cuba | 17 | 0.2% |
| Dominican Republic | 16 | 0.2% |
| Eastern Asia | 37 | 0.5% |
| Eastern Europe | 58 | 0.7% |
| England | 44 | 0.5% |
| Europe | 244 | 3.0% |
| Germany | 95 | 1.2% |
| Guatemala | 111 | 1.4% |
| Honduras | 408 | 5.1% |
| Hungary | 15 | 0.2% |
| Italy | 5 | 0.1% |
| Korea | 27 | 0.3% |
| Latin America | 852 | 10.6% |
| Mexico | 124 | 1.5% |
| Northern Europe | 68 | 0.8% |
| Scotland | 11 | 0.1% |
| South America | 147 | 1.8% |
| Southern Europe | 23 | 0.3% |
| Spain | 18 | 0.2% |
| Sweden | 13 | 0.2% |
| Ukraine | 43 | 0.5% |
| Western Europe | 95 | 1.2% | View All 30 Rows |
Sex and Age in Hardeeville
Sex and Age in Hardeeville
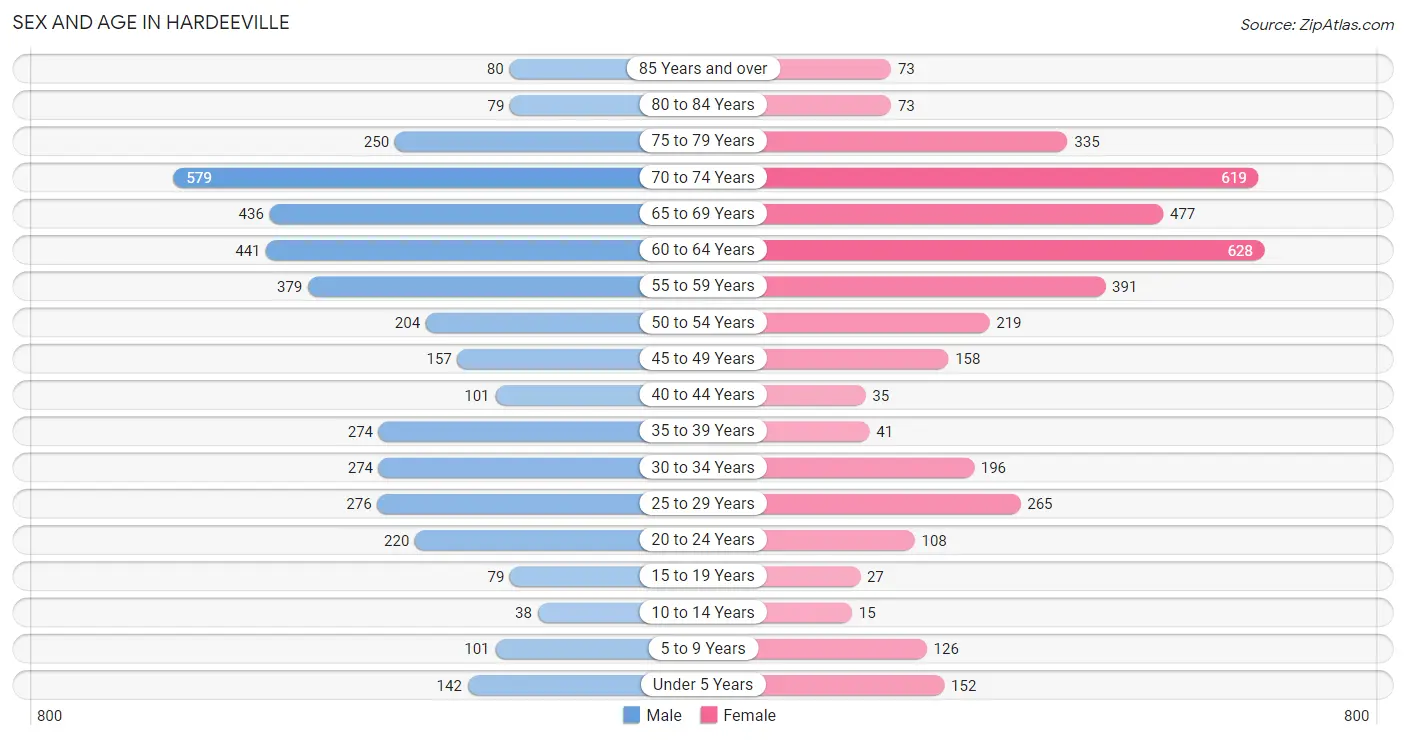
The most populous age groups in Hardeeville are 70 to 74 Years (579 | 14.1%) for men and 60 to 64 Years (628 | 16.0%) for women.
| Age Bracket | Male | Female |
| Under 5 Years | 142 (3.5%) | 152 (3.9%) |
| 5 to 9 Years | 101 (2.5%) | 126 (3.2%) |
| 10 to 14 Years | 38 (0.9%) | 15 (0.4%) |
| 15 to 19 Years | 79 (1.9%) | 27 (0.7%) |
| 20 to 24 Years | 220 (5.3%) | 108 (2.7%) |
| 25 to 29 Years | 276 (6.7%) | 265 (6.7%) |
| 30 to 34 Years | 274 (6.7%) | 196 (5.0%) |
| 35 to 39 Years | 274 (6.7%) | 41 (1.0%) |
| 40 to 44 Years | 101 (2.5%) | 35 (0.9%) |
| 45 to 49 Years | 157 (3.8%) | 158 (4.0%) |
| 50 to 54 Years | 204 (5.0%) | 219 (5.6%) |
| 55 to 59 Years | 379 (9.2%) | 391 (9.9%) |
| 60 to 64 Years | 441 (10.7%) | 628 (16.0%) |
| 65 to 69 Years | 436 (10.6%) | 477 (12.1%) |
| 70 to 74 Years | 579 (14.1%) | 619 (15.7%) |
| 75 to 79 Years | 250 (6.1%) | 335 (8.5%) |
| 80 to 84 Years | 79 (1.9%) | 73 (1.8%) |
| 85 Years and over | 80 (1.9%) | 73 (1.8%) |
| Total | 4,110 (100.0%) | 3,938 (100.0%) |
Families and Households in Hardeeville
Median Family Size in Hardeeville
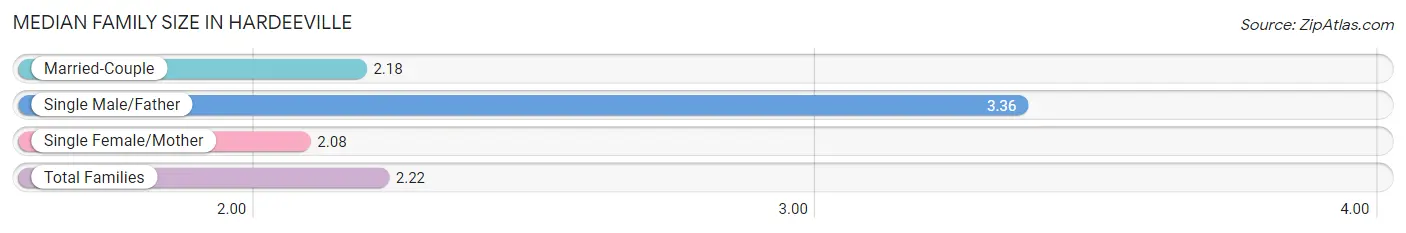
The median family size in Hardeeville is 2.22 persons per family, with single male/father families (114 | 4.4%) accounting for the largest median family size of 3.36 persons per family. On the other hand, single female/mother families (252 | 9.7%) represent the smallest median family size with 2.08 persons per family.
| Family Type | # Families | Family Size |
| Married-Couple | 2,235 (85.9%) | 2.18 |
| Single Male/Father | 114 (4.4%) | 3.36 |
| Single Female/Mother | 252 (9.7%) | 2.08 |
| Total Families | 2,601 (100.0%) | 2.22 |
Median Household Size in Hardeeville
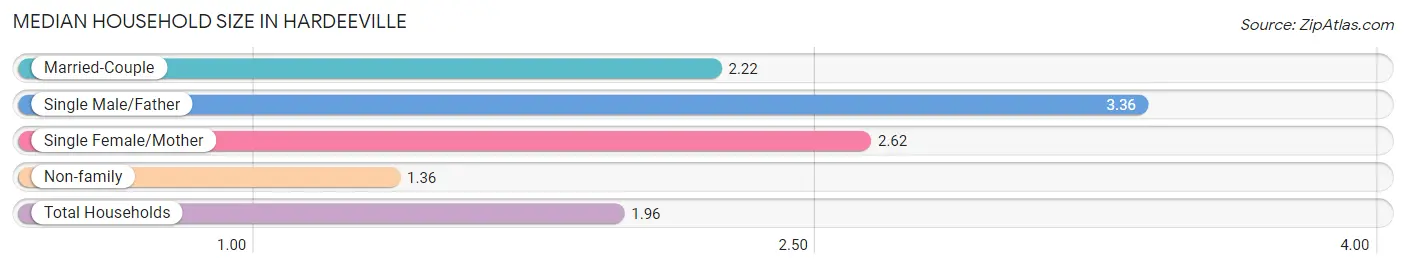
The median household size in Hardeeville is 1.96 persons per household, with single male/father households (114 | 2.8%) accounting for the largest median household size of 3.36 persons per household. non-family households (1,501 | 36.6%) represent the smallest median household size with 1.36 persons per household.
| Household Type | # Households | Household Size |
| Married-Couple | 2,235 (54.5%) | 2.22 |
| Single Male/Father | 114 (2.8%) | 3.36 |
| Single Female/Mother | 252 (6.1%) | 2.62 |
| Non-family | 1,501 (36.6%) | 1.36 |
| Total Households | 4,102 (100.0%) | 1.96 |
Household Size by Marriage Status in Hardeeville
Out of a total of 4,102 households in Hardeeville, 2,601 (63.4%) are family households, while 1,501 (36.6%) are nonfamily households. The most numerous type of family households are 2-person households, comprising 2,206, and the most common type of nonfamily households are 1-person households, comprising 1,135.
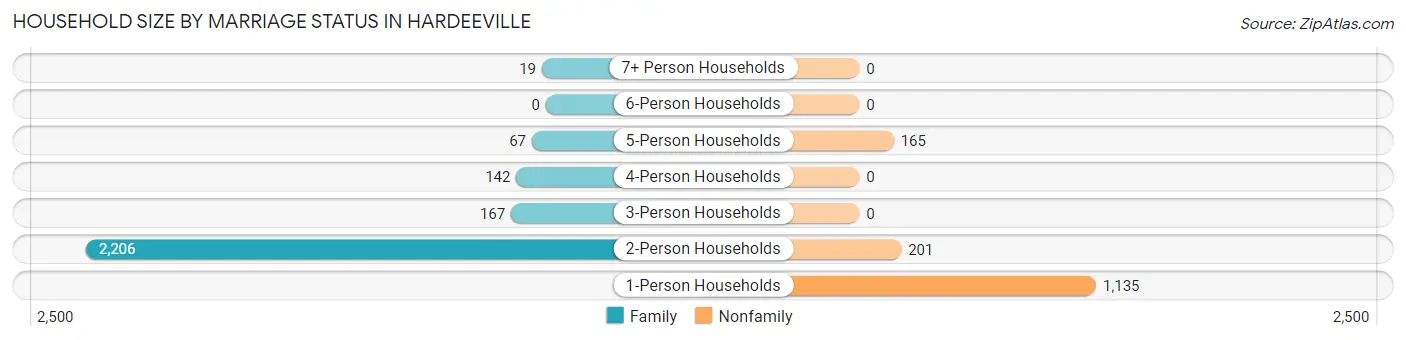
| Household Size | Family Households | Nonfamily Households |
| 1-Person Households | - | 1,135 (27.7%) |
| 2-Person Households | 2,206 (53.8%) | 201 (4.9%) |
| 3-Person Households | 167 (4.1%) | 0 (0.0%) |
| 4-Person Households | 142 (3.5%) | 0 (0.0%) |
| 5-Person Households | 67 (1.6%) | 165 (4.0%) |
| 6-Person Households | 0 (0.0%) | 0 (0.0%) |
| 7+ Person Households | 19 (0.5%) | 0 (0.0%) |
| Total | 2,601 (63.4%) | 1,501 (36.6%) |
Female Fertility in Hardeeville
Fertility by Age in Hardeeville
Average fertility rate in Hardeeville is 116.0 births per 1,000 women. Women in the age bracket of 20 to 34 years have the highest fertility rate with 181.0 births per 1,000 women. Women in the age bracket of 20 to 34 years acount for 100.0% of all women with births.
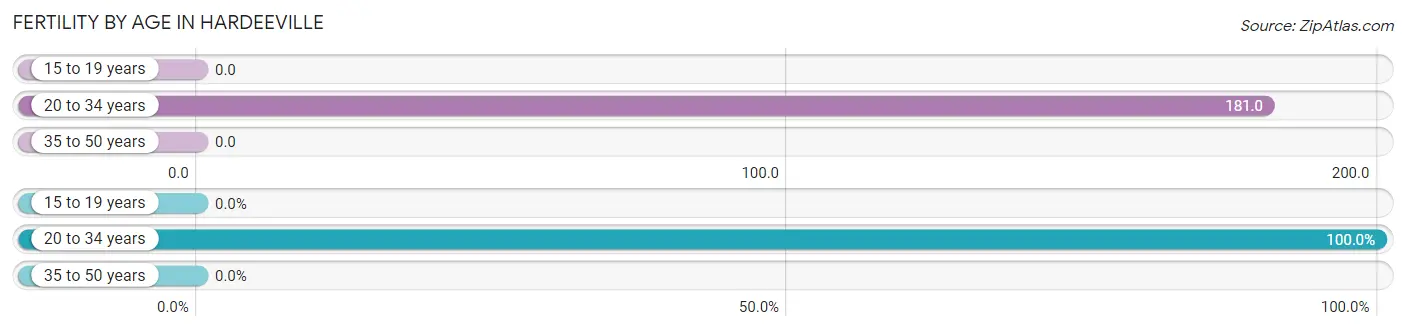
| Age Bracket | Women with Births | Births / 1,000 Women |
| 15 to 19 years | 0 (0.0%) | 0.0 |
| 20 to 34 years | 103 (100.0%) | 181.0 |
| 35 to 50 years | 0 (0.0%) | 0.0 |
| Total | 103 (100.0%) | 116.0 |
Fertility by Age by Marriage Status in Hardeeville
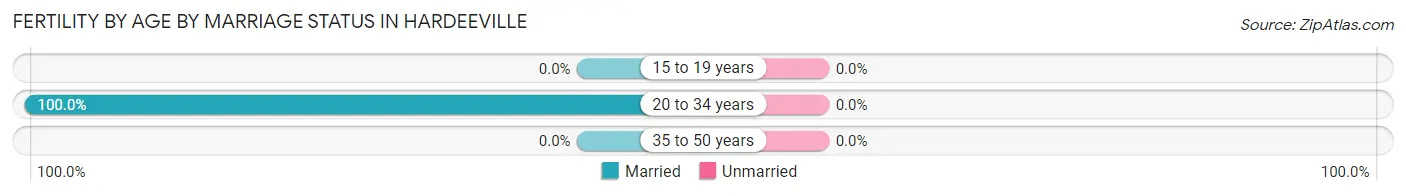
| Age Bracket | Married | Unmarried |
| 15 to 19 years | 0 (0.0%) | 0 (0.0%) |
| 20 to 34 years | 103 (100.0%) | 0 (0.0%) |
| 35 to 50 years | 0 (0.0%) | 0 (0.0%) |
| Total | 103 (100.0%) | 0 (0.0%) |
Fertility by Education in Hardeeville
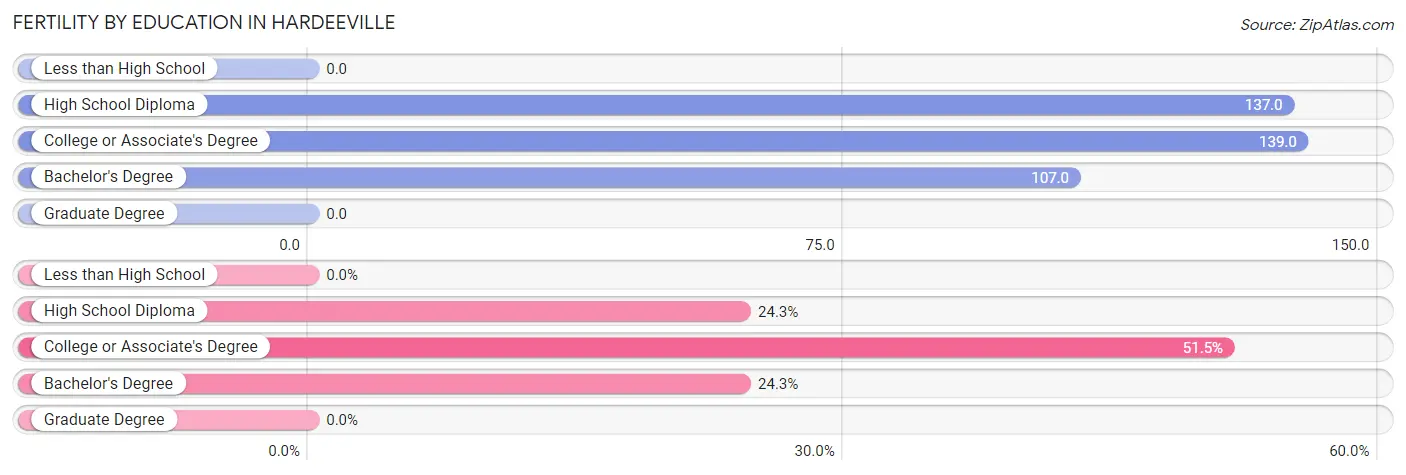
| Educational Attainment | Women with Births | Births / 1,000 Women |
| Less than High School | 0 (0.0%) | 0.0 |
| High School Diploma | 25 (24.3%) | 137.0 |
| College or Associate's Degree | 53 (51.5%) | 139.0 |
| Bachelor's Degree | 25 (24.3%) | 107.0 |
| Graduate Degree | 0 (0.0%) | 0.0 |
| Total | 103 (100.0%) | 116.0 |
Fertility by Education by Marriage Status in Hardeeville
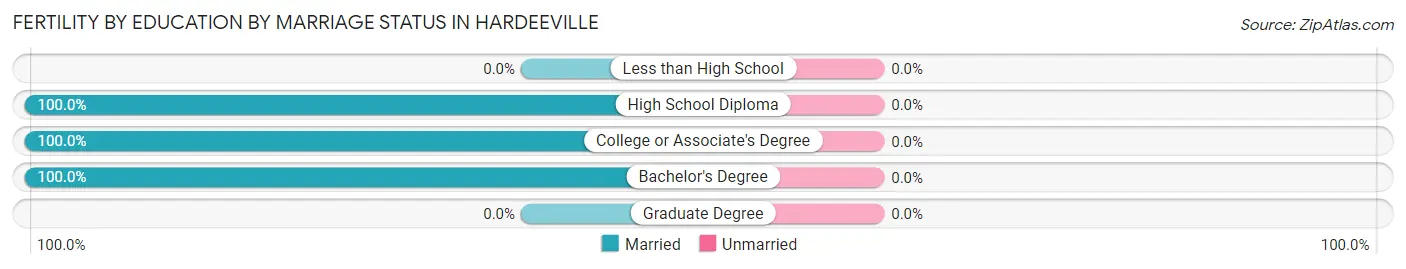
| Educational Attainment | Married | Unmarried |
| Less than High School | 0 (0.0%) | 0 (0.0%) |
| High School Diploma | 25 (100.0%) | 0 (0.0%) |
| College or Associate's Degree | 53 (100.0%) | 0 (0.0%) |
| Bachelor's Degree | 25 (100.0%) | 0 (0.0%) |
| Graduate Degree | 0 (0.0%) | 0 (0.0%) |
| Total | 103 (100.0%) | 0 (0.0%) |
Employment Characteristics in Hardeeville
Employment by Class of Employer in Hardeeville
Among the 3,167 employed individuals in Hardeeville, private company employees (1,937 | 61.2%), not-for-profit organizations (306 | 9.7%), and local government employees (255 | 8.1%) make up the most common classes of employment.
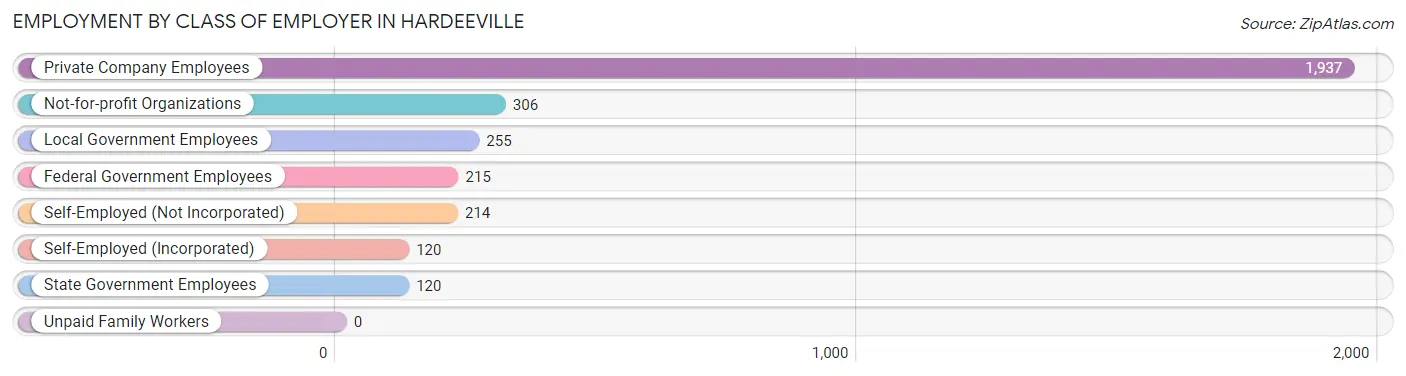
| Employer Class | # Employees | % Employees |
| Private Company Employees | 1,937 | 61.2% |
| Self-Employed (Incorporated) | 120 | 3.8% |
| Self-Employed (Not Incorporated) | 214 | 6.8% |
| Not-for-profit Organizations | 306 | 9.7% |
| Local Government Employees | 255 | 8.1% |
| State Government Employees | 120 | 3.8% |
| Federal Government Employees | 215 | 6.8% |
| Unpaid Family Workers | 0 | 0.0% |
| Total | 3,167 | 100.0% |
Employment Status by Age in Hardeeville
According to the labor force statistics for Hardeeville, out of the total population over 16 years of age (7,447), 48.0% or 3,575 individuals are in the labor force, with 9.0% or 322 of them unemployed. The age group with the highest labor force participation rate is 20 to 24 years, with 100.0% or 328 individuals in the labor force. Within the labor force, the 20 to 24 years age range has the highest percentage of unemployed individuals, with 42.0% or 138 of them being unemployed.
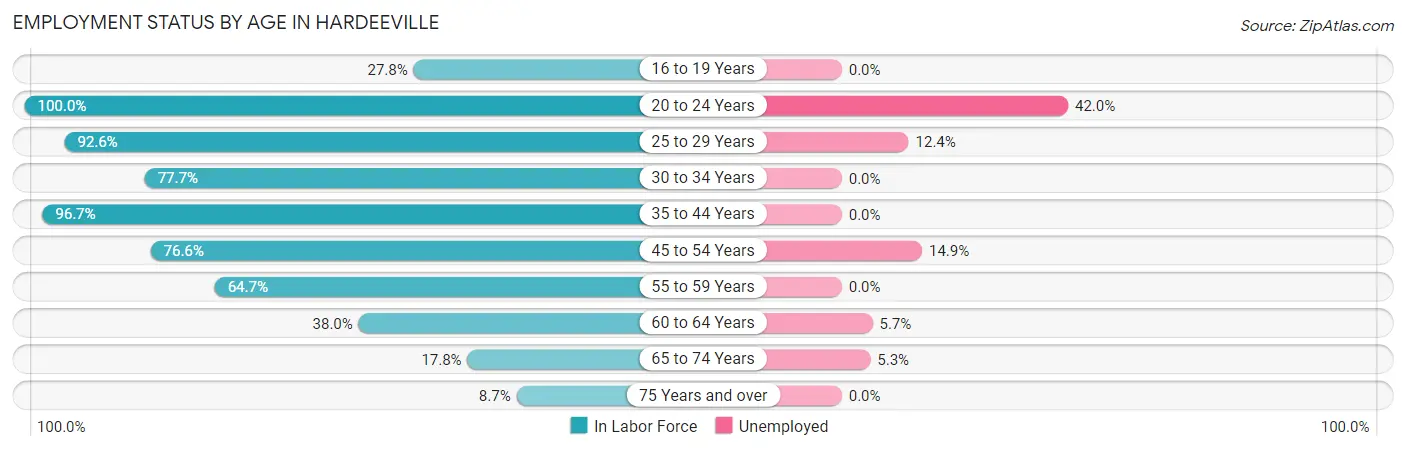
| Age Bracket | In Labor Force | Unemployed |
| 16 to 19 Years | 22 (27.8%) | 0 (0.0%) |
| 20 to 24 Years | 328 (100.0%) | 138 (42.0%) |
| 25 to 29 Years | 501 (92.6%) | 62 (12.4%) |
| 30 to 34 Years | 365 (77.7%) | 0 (0.0%) |
| 35 to 44 Years | 436 (96.7%) | 0 (0.0%) |
| 45 to 54 Years | 565 (76.6%) | 84 (14.9%) |
| 55 to 59 Years | 498 (64.7%) | 0 (0.0%) |
| 60 to 64 Years | 406 (38.0%) | 23 (5.7%) |
| 65 to 74 Years | 376 (17.8%) | 20 (5.3%) |
| 75 Years and over | 77 (8.7%) | 0 (0.0%) |
| Total | 3,575 (48.0%) | 322 (9.0%) |
Employment Status by Educational Attainment in Hardeeville
According to labor force statistics for Hardeeville, 68.6% of individuals (2,771) out of the total population between 25 and 64 years of age (4,039) are in the labor force, with 6.1% or 169 of them being unemployed. The group with the highest labor force participation rate are those with the educational attainment of less than high school, with 76.5% or 244 individuals in the labor force. Within the labor force, individuals with college / associate degree education have the highest percentage of unemployment, with 12.8% or 84 of them being unemployed.
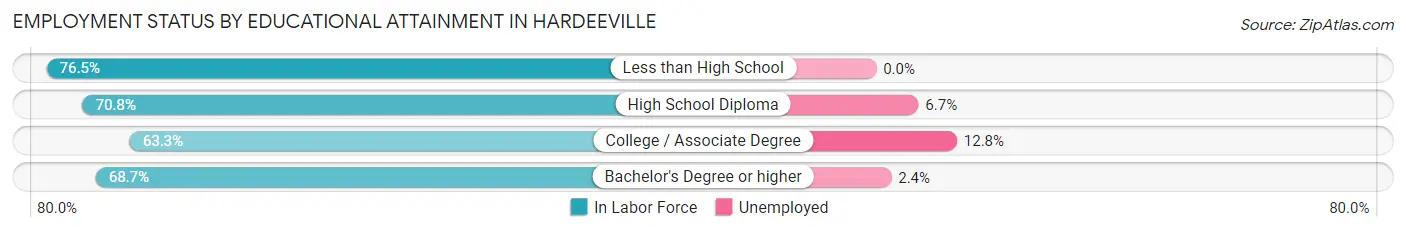
| Educational Attainment | In Labor Force | Unemployed |
| Less than High School | 244 (76.5%) | 0 (0.0%) |
| High School Diploma | 922 (70.8%) | 87 (6.7%) |
| College / Associate Degree | 658 (63.3%) | 133 (12.8%) |
| Bachelor's Degree or higher | 947 (68.7%) | 33 (2.4%) |
| Total | 2,771 (68.6%) | 246 (6.1%) |
Employment Occupations by Sex in Hardeeville
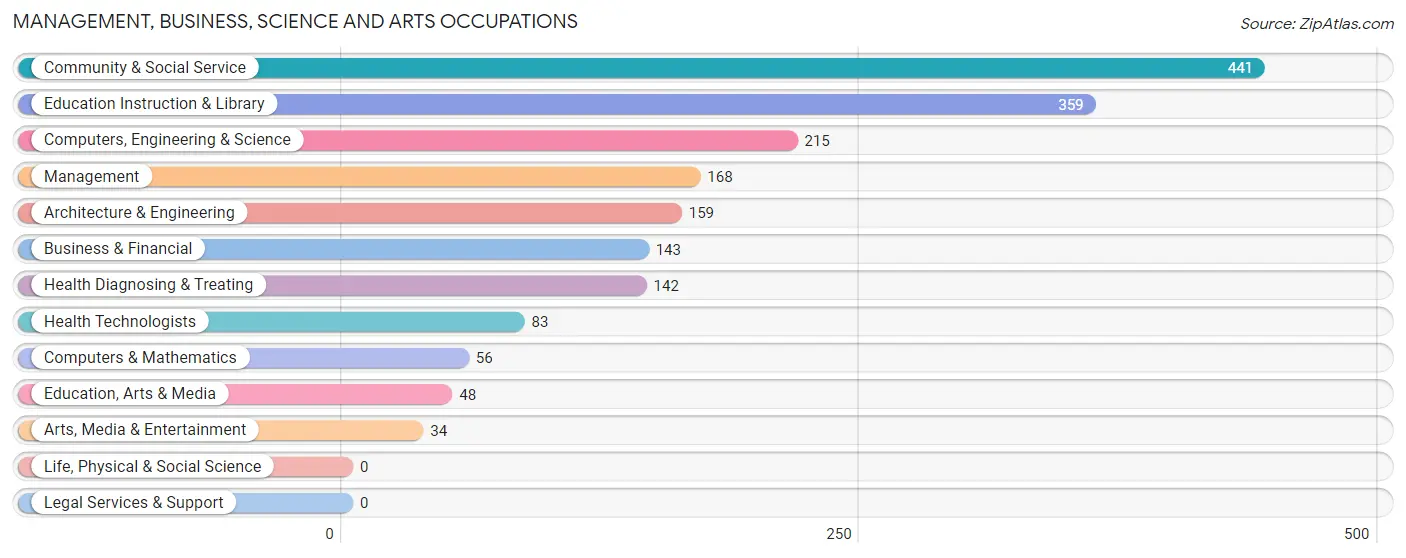
Management, Business, Science and Arts Occupations
The most common Management, Business, Science and Arts occupations in Hardeeville are Community & Social Service (441 | 13.6%), Education Instruction & Library (359 | 11.1%), Computers, Engineering & Science (215 | 6.7%), Management (168 | 5.2%), and Architecture & Engineering (159 | 4.9%).
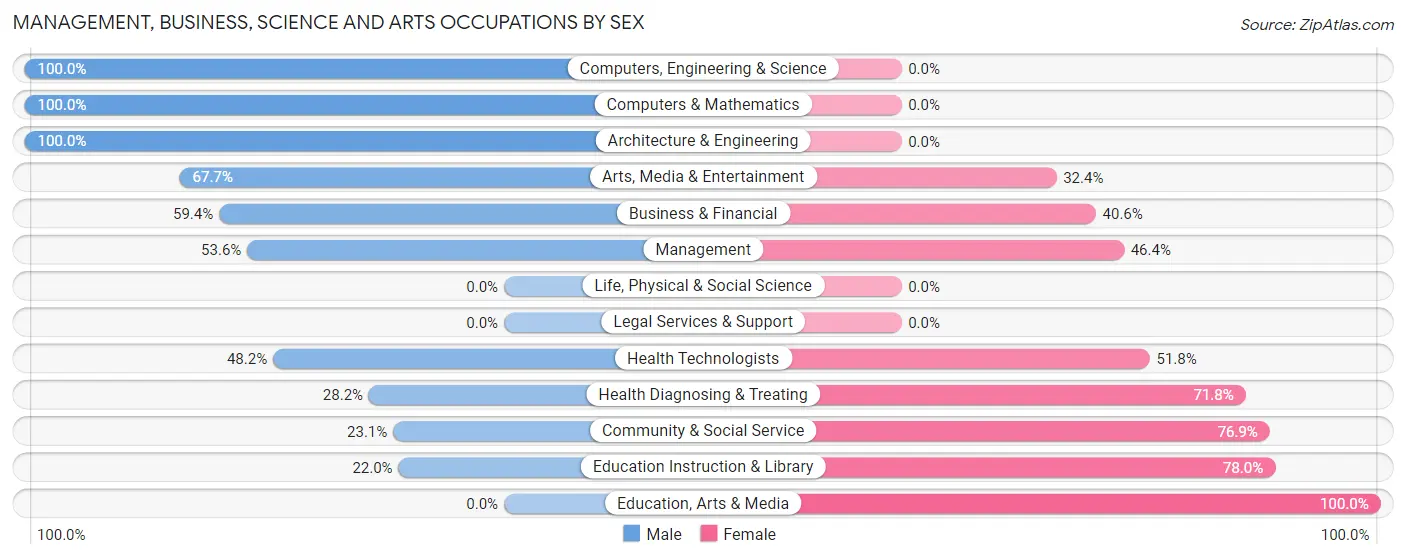
Management, Business, Science and Arts Occupations by Sex
Within the Management, Business, Science and Arts occupations in Hardeeville, the most male-oriented occupations are Computers, Engineering & Science (100.0%), Computers & Mathematics (100.0%), and Architecture & Engineering (100.0%), while the most female-oriented occupations are Education, Arts & Media (100.0%), Education Instruction & Library (78.0%), and Community & Social Service (76.9%).
| Occupation | Male | Female |
| Management | 90 (53.6%) | 78 (46.4%) |
| Business & Financial | 85 (59.4%) | 58 (40.6%) |
| Computers, Engineering & Science | 215 (100.0%) | 0 (0.0%) |
| Computers & Mathematics | 56 (100.0%) | 0 (0.0%) |
| Architecture & Engineering | 159 (100.0%) | 0 (0.0%) |
| Life, Physical & Social Science | 0 (0.0%) | 0 (0.0%) |
| Community & Social Service | 102 (23.1%) | 339 (76.9%) |
| Education, Arts & Media | 0 (0.0%) | 48 (100.0%) |
| Legal Services & Support | 0 (0.0%) | 0 (0.0%) |
| Education Instruction & Library | 79 (22.0%) | 280 (78.0%) |
| Arts, Media & Entertainment | 23 (67.6%) | 11 (32.4%) |
| Health Diagnosing & Treating | 40 (28.2%) | 102 (71.8%) |
| Health Technologists | 40 (48.2%) | 43 (51.8%) |
| Total (Category) | 532 (48.0%) | 577 (52.0%) |
| Total (Overall) | 1,888 (58.4%) | 1,347 (41.6%) |
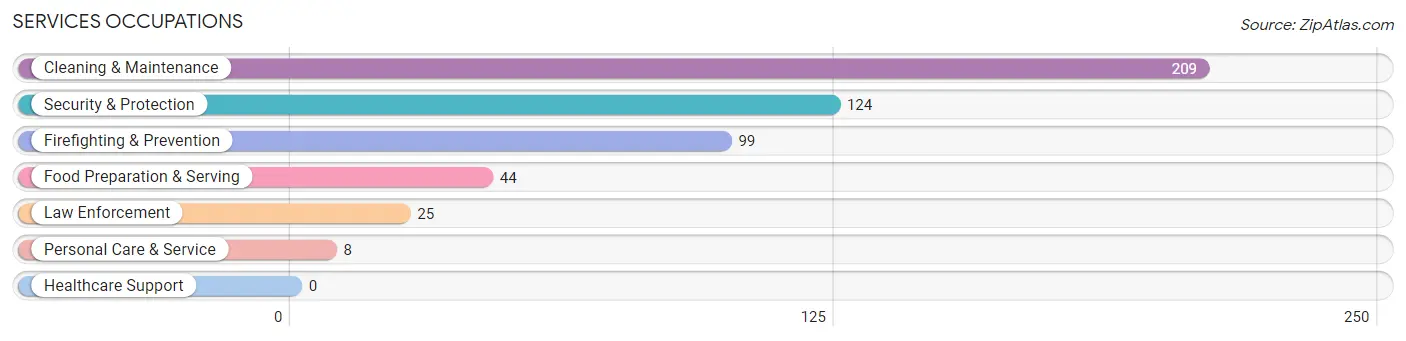
Services Occupations
The most common Services occupations in Hardeeville are Cleaning & Maintenance (209 | 6.5%), Security & Protection (124 | 3.8%), Firefighting & Prevention (99 | 3.1%), Food Preparation & Serving (44 | 1.4%), and Law Enforcement (25 | 0.8%).
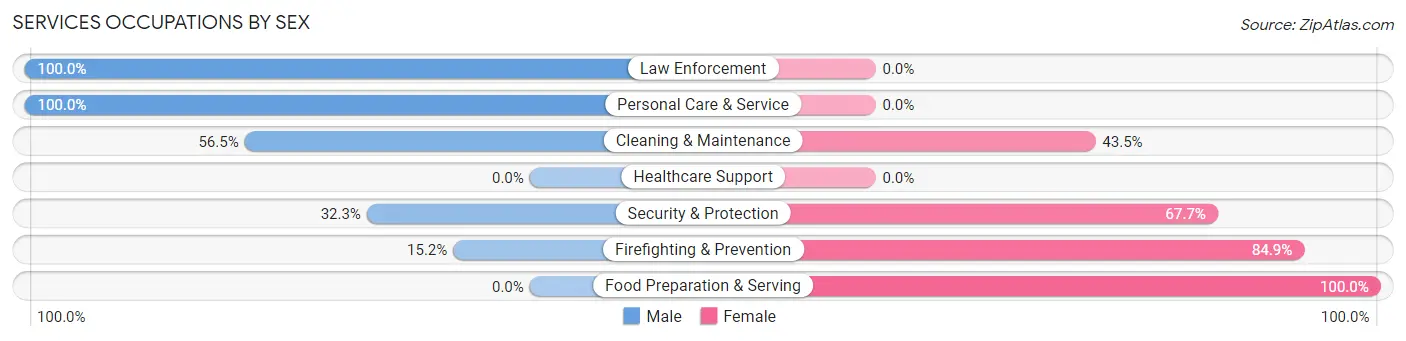
Services Occupations by Sex
Within the Services occupations in Hardeeville, the most male-oriented occupations are Law Enforcement (100.0%), Personal Care & Service (100.0%), and Cleaning & Maintenance (56.5%), while the most female-oriented occupations are Food Preparation & Serving (100.0%), Firefighting & Prevention (84.9%), and Security & Protection (67.7%).
| Occupation | Male | Female |
| Healthcare Support | 0 (0.0%) | 0 (0.0%) |
| Security & Protection | 40 (32.3%) | 84 (67.7%) |
| Firefighting & Prevention | 15 (15.1%) | 84 (84.9%) |
| Law Enforcement | 25 (100.0%) | 0 (0.0%) |
| Food Preparation & Serving | 0 (0.0%) | 44 (100.0%) |
| Cleaning & Maintenance | 118 (56.5%) | 91 (43.5%) |
| Personal Care & Service | 8 (100.0%) | 0 (0.0%) |
| Total (Category) | 166 (43.1%) | 219 (56.9%) |
| Total (Overall) | 1,888 (58.4%) | 1,347 (41.6%) |
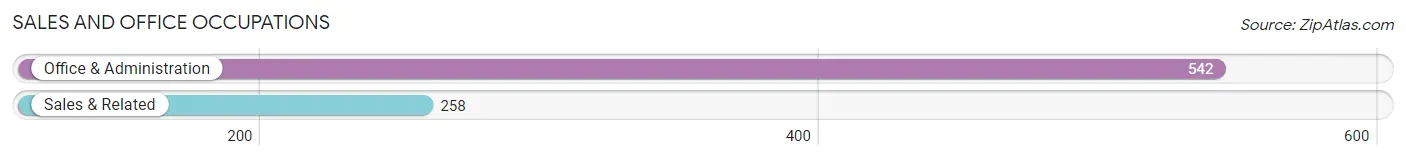
Sales and Office Occupations
The most common Sales and Office occupations in Hardeeville are Office & Administration (542 | 16.8%), and Sales & Related (258 | 8.0%).
Sales and Office Occupations by Sex
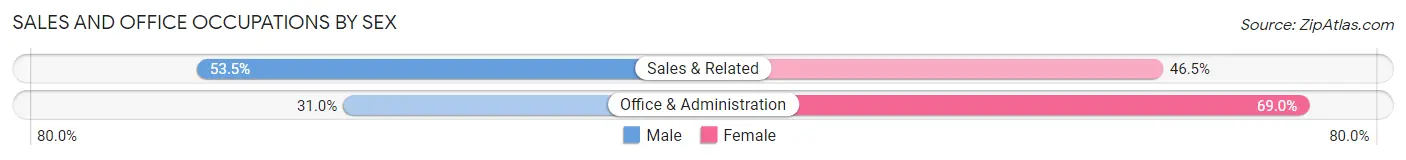
| Occupation | Male | Female |
| Sales & Related | 138 (53.5%) | 120 (46.5%) |
| Office & Administration | 168 (31.0%) | 374 (69.0%) |
| Total (Category) | 306 (38.3%) | 494 (61.8%) |
| Total (Overall) | 1,888 (58.4%) | 1,347 (41.6%) |
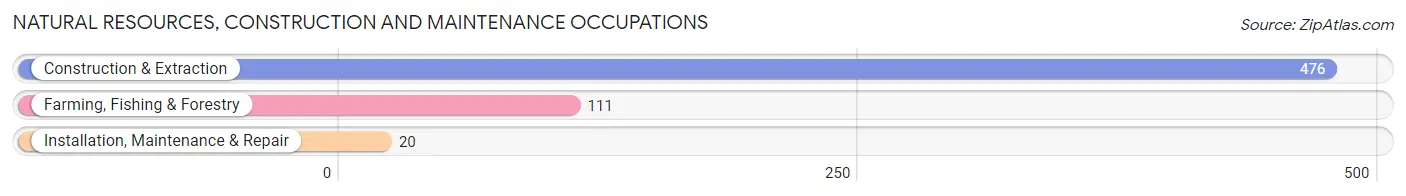
Natural Resources, Construction and Maintenance Occupations
The most common Natural Resources, Construction and Maintenance occupations in Hardeeville are Construction & Extraction (476 | 14.7%), Farming, Fishing & Forestry (111 | 3.4%), and Installation, Maintenance & Repair (20 | 0.6%).
Natural Resources, Construction and Maintenance Occupations by Sex
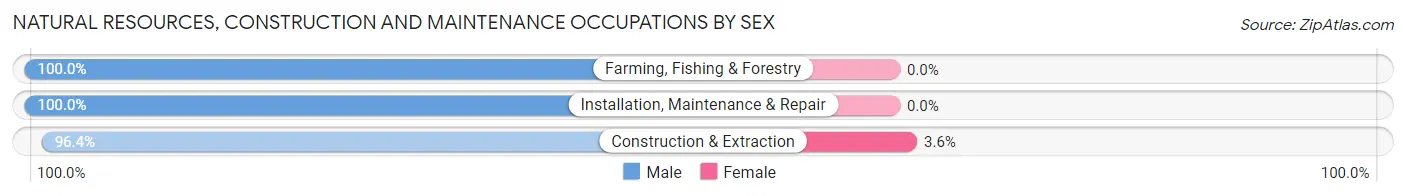
| Occupation | Male | Female |
| Farming, Fishing & Forestry | 111 (100.0%) | 0 (0.0%) |
| Construction & Extraction | 459 (96.4%) | 17 (3.6%) |
| Installation, Maintenance & Repair | 20 (100.0%) | 0 (0.0%) |
| Total (Category) | 590 (97.2%) | 17 (2.8%) |
| Total (Overall) | 1,888 (58.4%) | 1,347 (41.6%) |
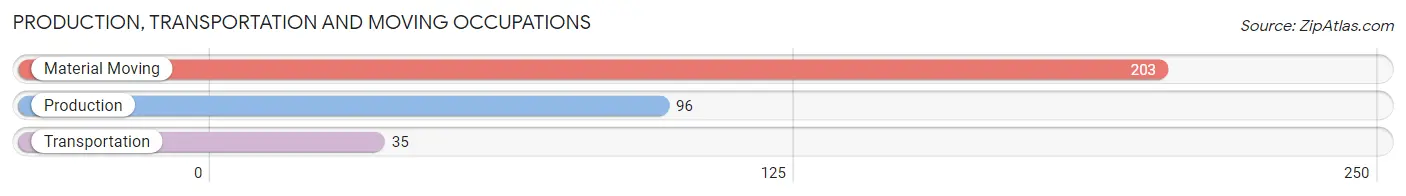
Production, Transportation and Moving Occupations
The most common Production, Transportation and Moving occupations in Hardeeville are Material Moving (203 | 6.3%), Production (96 | 3.0%), and Transportation (35 | 1.1%).
Production, Transportation and Moving Occupations by Sex
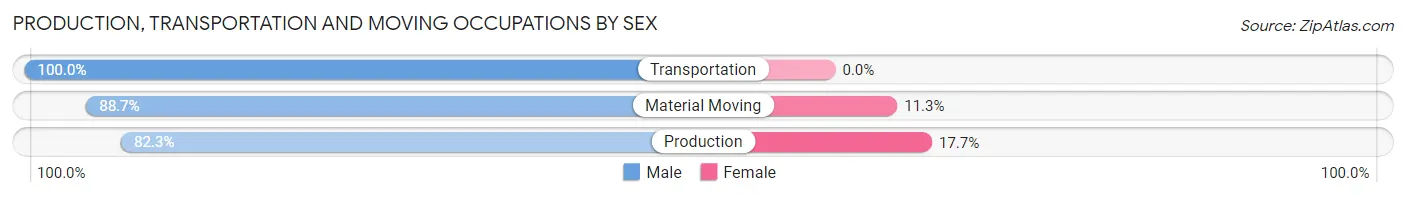
| Occupation | Male | Female |
| Production | 79 (82.3%) | 17 (17.7%) |
| Transportation | 35 (100.0%) | 0 (0.0%) |
| Material Moving | 180 (88.7%) | 23 (11.3%) |
| Total (Category) | 294 (88.0%) | 40 (12.0%) |
| Total (Overall) | 1,888 (58.4%) | 1,347 (41.6%) |
Employment Industries by Sex in Hardeeville
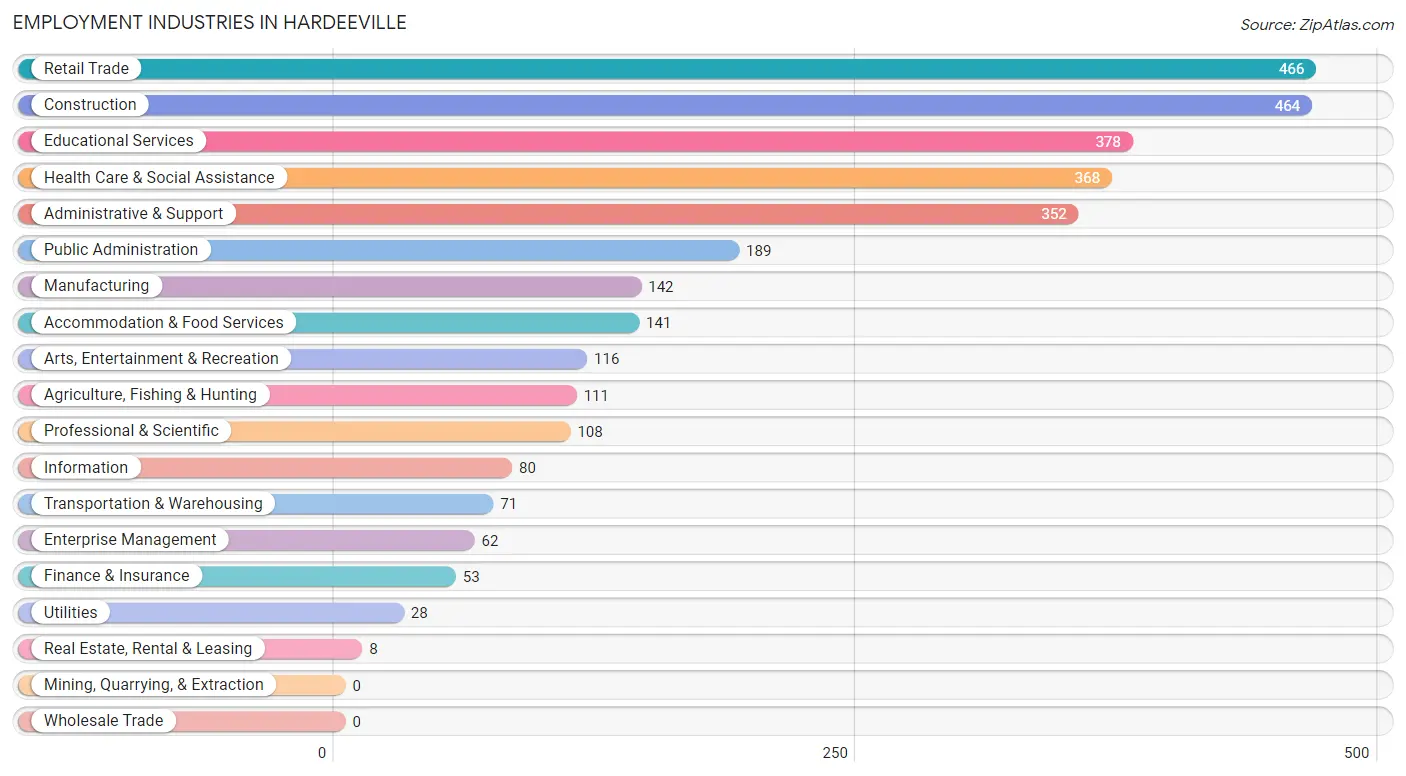
Employment Industries in Hardeeville
The major employment industries in Hardeeville include Retail Trade (466 | 14.4%), Construction (464 | 14.3%), Educational Services (378 | 11.7%), Health Care & Social Assistance (368 | 11.4%), and Administrative & Support (352 | 10.9%).
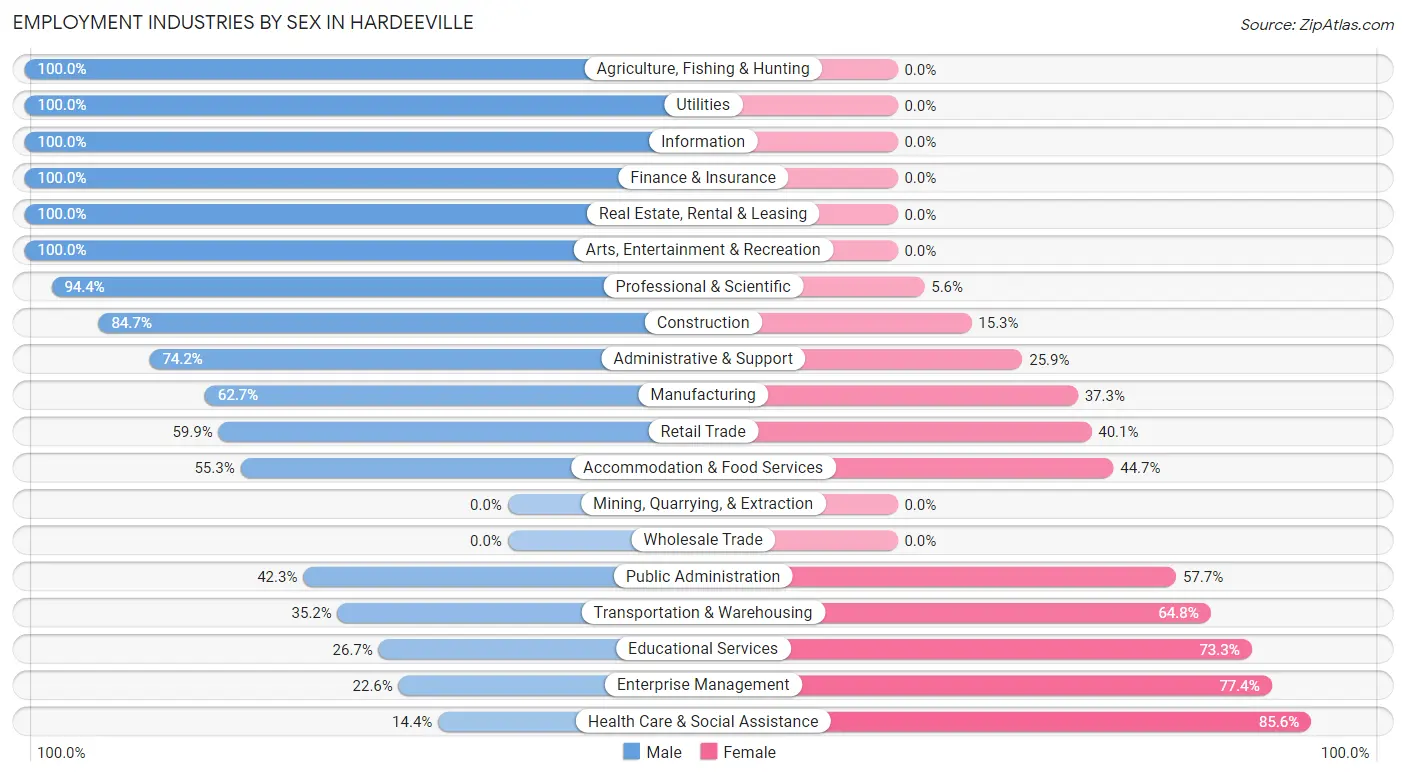
Employment Industries by Sex in Hardeeville
The Hardeeville industries that see more men than women are Agriculture, Fishing & Hunting (100.0%), Utilities (100.0%), and Information (100.0%), whereas the industries that tend to have a higher number of women are Health Care & Social Assistance (85.6%), Enterprise Management (77.4%), and Educational Services (73.3%).
| Industry | Male | Female |
| Agriculture, Fishing & Hunting | 111 (100.0%) | 0 (0.0%) |
| Mining, Quarrying, & Extraction | 0 (0.0%) | 0 (0.0%) |
| Construction | 393 (84.7%) | 71 (15.3%) |
| Manufacturing | 89 (62.7%) | 53 (37.3%) |
| Wholesale Trade | 0 (0.0%) | 0 (0.0%) |
| Retail Trade | 279 (59.9%) | 187 (40.1%) |
| Transportation & Warehousing | 25 (35.2%) | 46 (64.8%) |
| Utilities | 28 (100.0%) | 0 (0.0%) |
| Information | 80 (100.0%) | 0 (0.0%) |
| Finance & Insurance | 53 (100.0%) | 0 (0.0%) |
| Real Estate, Rental & Leasing | 8 (100.0%) | 0 (0.0%) |
| Professional & Scientific | 102 (94.4%) | 6 (5.6%) |
| Enterprise Management | 14 (22.6%) | 48 (77.4%) |
| Administrative & Support | 261 (74.2%) | 91 (25.9%) |
| Educational Services | 101 (26.7%) | 277 (73.3%) |
| Health Care & Social Assistance | 53 (14.4%) | 315 (85.6%) |
| Arts, Entertainment & Recreation | 116 (100.0%) | 0 (0.0%) |
| Accommodation & Food Services | 78 (55.3%) | 63 (44.7%) |
| Public Administration | 80 (42.3%) | 109 (57.7%) |
| Total | 1,888 (58.4%) | 1,347 (41.6%) |
Education in Hardeeville
School Enrollment in Hardeeville
The most common levels of schooling among the 572 students in Hardeeville are elementary school (198 | 34.6%), college / undergraduate (93 | 16.3%), and high school (91 | 15.9%).
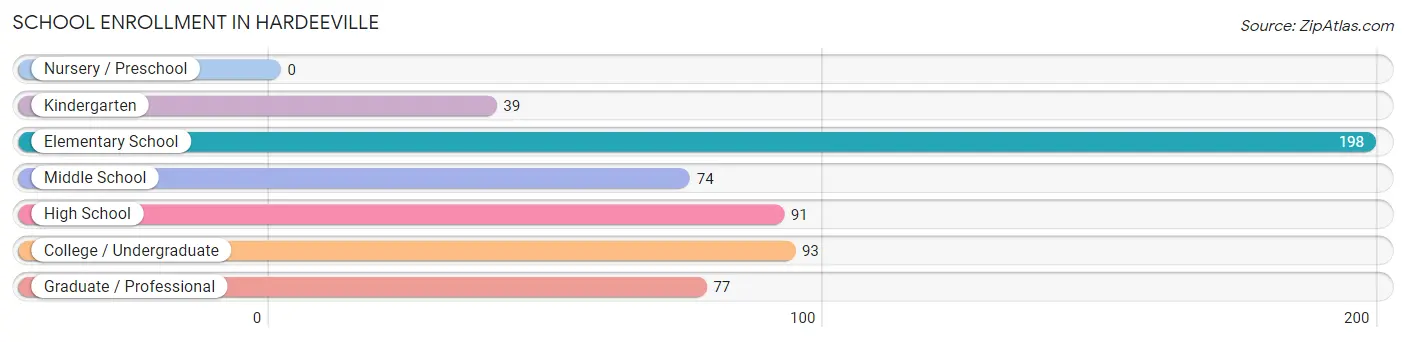
| School Level | # Students | % Students |
| Nursery / Preschool | 0 | 0.0% |
| Kindergarten | 39 | 6.8% |
| Elementary School | 198 | 34.6% |
| Middle School | 74 | 12.9% |
| High School | 91 | 15.9% |
| College / Undergraduate | 93 | 16.3% |
| Graduate / Professional | 77 | 13.5% |
| Total | 572 | 100.0% |
School Enrollment by Age by Funding Source in Hardeeville
Out of a total of 572 students who are enrolled in schools in Hardeeville, 269 (47.0%) attend a private institution, while the remaining 303 (53.0%) are enrolled in public schools. The age group of 25 to 34 year olds has the highest likelihood of being enrolled in private schools, with 91 (89.2% in the age bracket) enrolled. Conversely, the age group of 3 to 4 year olds has the lowest likelihood of being enrolled in a private school, with 24 (100.0% in the age bracket) attending a public institution.
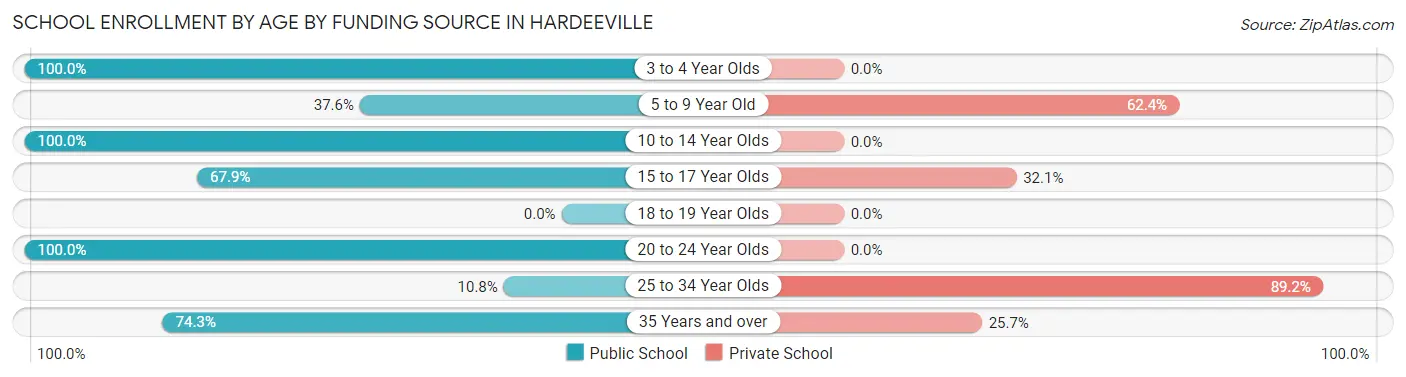
| Age Bracket | Public School | Private School |
| 3 to 4 Year Olds | 24 (100.0%) | 0 (0.0%) |
| 5 to 9 Year Old | 80 (37.6%) | 133 (62.4%) |
| 10 to 14 Year Olds | 53 (100.0%) | 0 (0.0%) |
| 15 to 17 Year Olds | 57 (67.9%) | 27 (32.1%) |
| 18 to 19 Year Olds | 0 (0.0%) | 0 (0.0%) |
| 20 to 24 Year Olds | 26 (100.0%) | 0 (0.0%) |
| 25 to 34 Year Olds | 11 (10.8%) | 91 (89.2%) |
| 35 Years and over | 52 (74.3%) | 18 (25.7%) |
| Total | 303 (53.0%) | 269 (47.0%) |
Educational Attainment by Field of Study in Hardeeville
Business (651 | 20.3%), education (470 | 14.7%), engineering (406 | 12.7%), social sciences (380 | 11.9%), and science & technology (256 | 8.0%) are the most common fields of study among 3,205 individuals in Hardeeville who have obtained a bachelor's degree or higher.
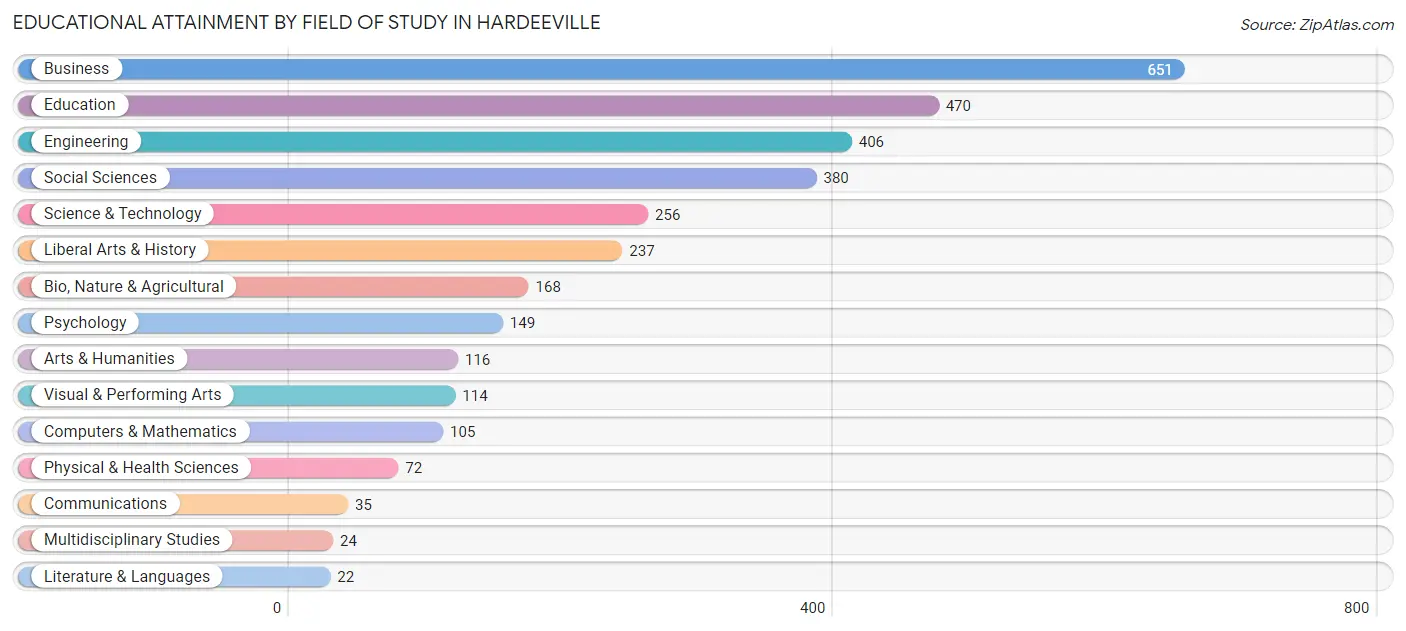
| Field of Study | # Graduates | % Graduates |
| Computers & Mathematics | 105 | 3.3% |
| Bio, Nature & Agricultural | 168 | 5.2% |
| Physical & Health Sciences | 72 | 2.2% |
| Psychology | 149 | 4.6% |
| Social Sciences | 380 | 11.9% |
| Engineering | 406 | 12.7% |
| Multidisciplinary Studies | 24 | 0.7% |
| Science & Technology | 256 | 8.0% |
| Business | 651 | 20.3% |
| Education | 470 | 14.7% |
| Literature & Languages | 22 | 0.7% |
| Liberal Arts & History | 237 | 7.4% |
| Visual & Performing Arts | 114 | 3.6% |
| Communications | 35 | 1.1% |
| Arts & Humanities | 116 | 3.6% |
| Total | 3,205 | 100.0% |
Transportation & Commute in Hardeeville
Vehicle Availability by Sex in Hardeeville
The most prevalent vehicle ownership categories in Hardeeville are males with 2 vehicles (844, accounting for 44.2%) and females with 2 vehicles (494, making up 67.1%).
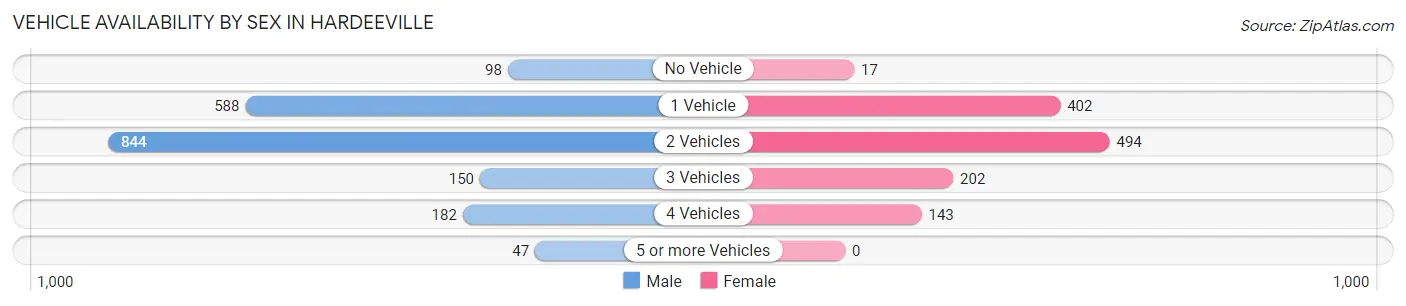
| Vehicles Available | Male | Female |
| No Vehicle | 98 (5.1%) | 17 (1.3%) |
| 1 Vehicle | 588 (30.8%) | 402 (32.0%) |
| 2 Vehicles | 844 (44.2%) | 494 (39.3%) |
| 3 Vehicles | 150 (7.9%) | 202 (16.1%) |
| 4 Vehicles | 182 (9.5%) | 143 (11.4%) |
| 5 or more Vehicles | 47 (2.5%) | 0 (0.0%) |
| Total | 1,909 (100.0%) | 1,258 (100.0%) |
Commute Time in Hardeeville
The most frequently occuring commute durations in Hardeeville are 30 to 34 minutes (726 commuters, 24.9%), 20 to 24 minutes (439 commuters, 15.0%), and 5 to 9 minutes (403 commuters, 13.8%).
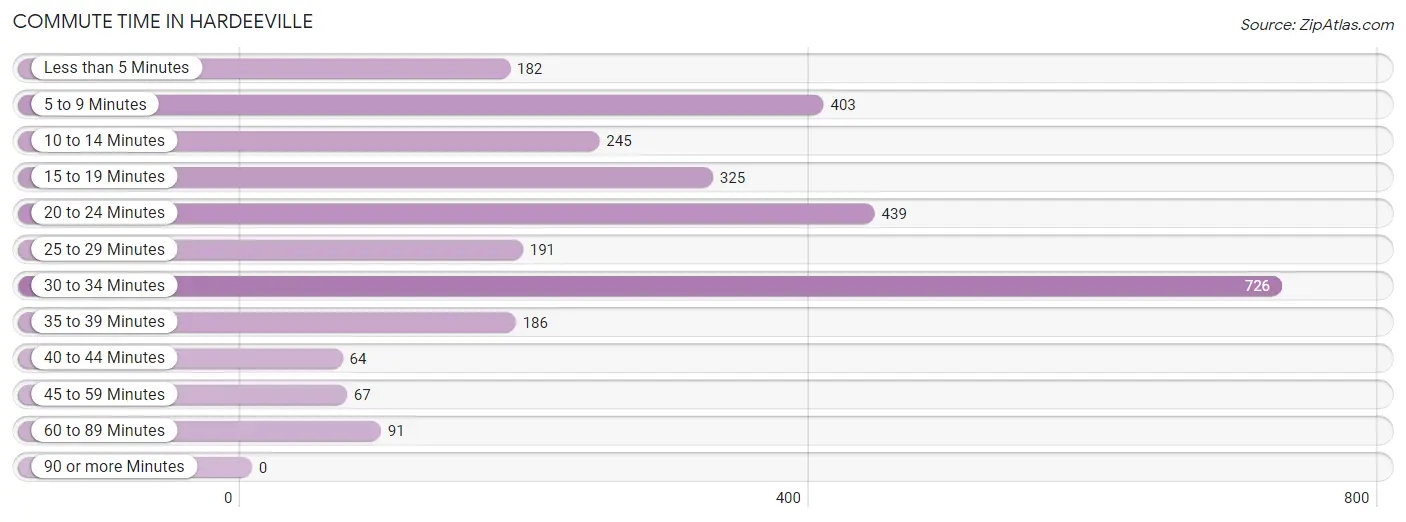
| Commute Time | # Commuters | % Commuters |
| Less than 5 Minutes | 182 | 6.2% |
| 5 to 9 Minutes | 403 | 13.8% |
| 10 to 14 Minutes | 245 | 8.4% |
| 15 to 19 Minutes | 325 | 11.1% |
| 20 to 24 Minutes | 439 | 15.0% |
| 25 to 29 Minutes | 191 | 6.5% |
| 30 to 34 Minutes | 726 | 24.9% |
| 35 to 39 Minutes | 186 | 6.4% |
| 40 to 44 Minutes | 64 | 2.2% |
| 45 to 59 Minutes | 67 | 2.3% |
| 60 to 89 Minutes | 91 | 3.1% |
| 90 or more Minutes | 0 | 0.0% |
Commute Time by Sex in Hardeeville
The most common commute times in Hardeeville are 5 to 9 minutes (350 commuters, 20.4%) for males and 30 to 34 minutes (394 commuters, 32.7%) for females.
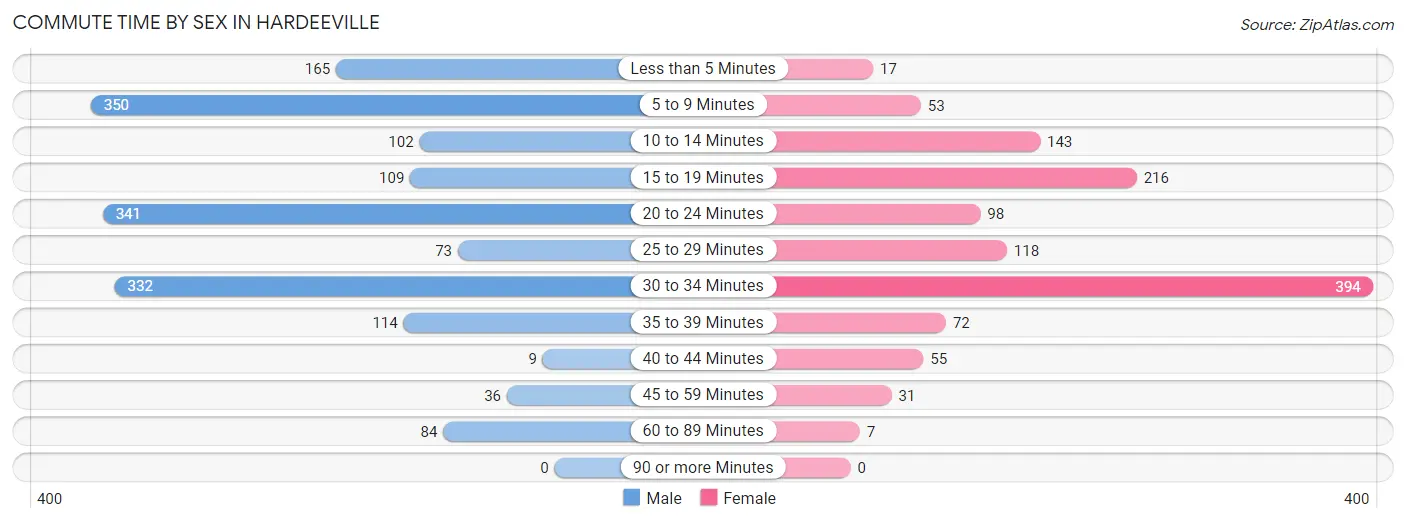
| Commute Time | Male | Female |
| Less than 5 Minutes | 165 (9.6%) | 17 (1.4%) |
| 5 to 9 Minutes | 350 (20.4%) | 53 (4.4%) |
| 10 to 14 Minutes | 102 (5.9%) | 143 (11.9%) |
| 15 to 19 Minutes | 109 (6.4%) | 216 (17.9%) |
| 20 to 24 Minutes | 341 (19.9%) | 98 (8.1%) |
| 25 to 29 Minutes | 73 (4.3%) | 118 (9.8%) |
| 30 to 34 Minutes | 332 (19.4%) | 394 (32.7%) |
| 35 to 39 Minutes | 114 (6.7%) | 72 (6.0%) |
| 40 to 44 Minutes | 9 (0.5%) | 55 (4.6%) |
| 45 to 59 Minutes | 36 (2.1%) | 31 (2.6%) |
| 60 to 89 Minutes | 84 (4.9%) | 7 (0.6%) |
| 90 or more Minutes | 0 (0.0%) | 0 (0.0%) |
Time of Departure to Work by Sex in Hardeeville
The most frequent times of departure to work in Hardeeville are 6:30 AM to 6:59 AM (414, 24.1%) for males and 6:30 AM to 6:59 AM (199, 16.5%) for females.
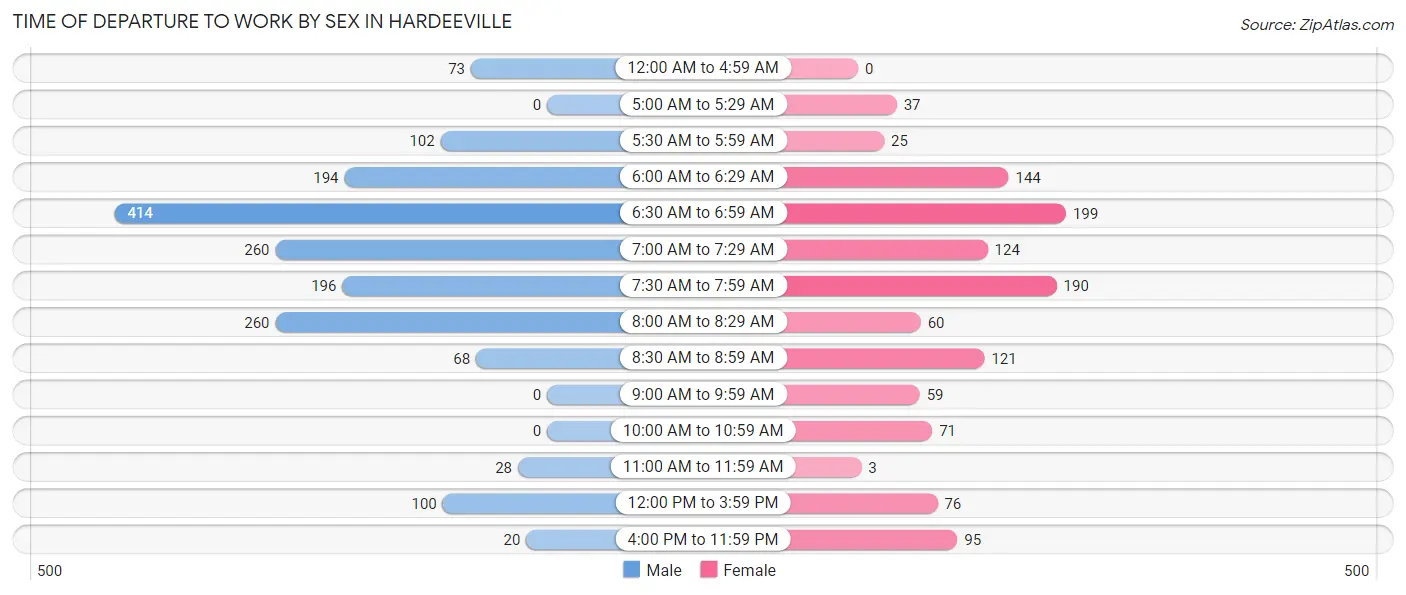
| Time of Departure | Male | Female |
| 12:00 AM to 4:59 AM | 73 (4.3%) | 0 (0.0%) |
| 5:00 AM to 5:29 AM | 0 (0.0%) | 37 (3.1%) |
| 5:30 AM to 5:59 AM | 102 (5.9%) | 25 (2.1%) |
| 6:00 AM to 6:29 AM | 194 (11.3%) | 144 (12.0%) |
| 6:30 AM to 6:59 AM | 414 (24.1%) | 199 (16.5%) |
| 7:00 AM to 7:29 AM | 260 (15.2%) | 124 (10.3%) |
| 7:30 AM to 7:59 AM | 196 (11.4%) | 190 (15.8%) |
| 8:00 AM to 8:29 AM | 260 (15.2%) | 60 (5.0%) |
| 8:30 AM to 8:59 AM | 68 (4.0%) | 121 (10.1%) |
| 9:00 AM to 9:59 AM | 0 (0.0%) | 59 (4.9%) |
| 10:00 AM to 10:59 AM | 0 (0.0%) | 71 (5.9%) |
| 11:00 AM to 11:59 AM | 28 (1.6%) | 3 (0.3%) |
| 12:00 PM to 3:59 PM | 100 (5.8%) | 76 (6.3%) |
| 4:00 PM to 11:59 PM | 20 (1.2%) | 95 (7.9%) |
| Total | 1,715 (100.0%) | 1,204 (100.0%) |
Housing Occupancy in Hardeeville
Occupancy by Ownership in Hardeeville
Of the total 4,102 dwellings in Hardeeville, owner-occupied units account for 3,054 (74.5%), while renter-occupied units make up 1,048 (25.6%).
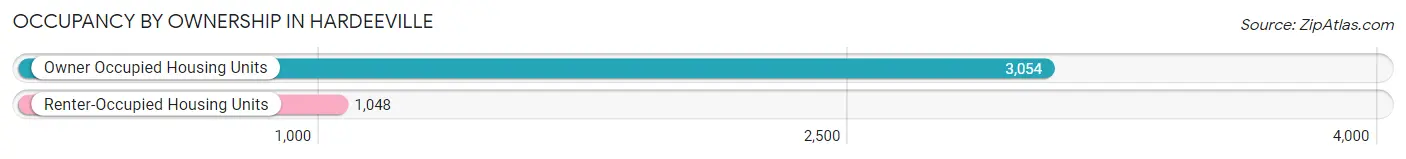
| Occupancy | # Housing Units | % Housing Units |
| Owner Occupied Housing Units | 3,054 | 74.5% |
| Renter-Occupied Housing Units | 1,048 | 25.6% |
| Total Occupied Housing Units | 4,102 | 100.0% |
Occupancy by Household Size in Hardeeville
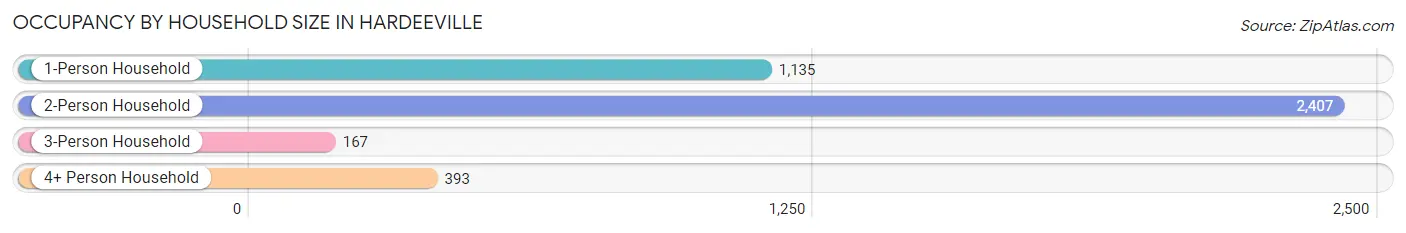
| Household Size | # Housing Units | % Housing Units |
| 1-Person Household | 1,135 | 27.7% |
| 2-Person Household | 2,407 | 58.7% |
| 3-Person Household | 167 | 4.1% |
| 4+ Person Household | 393 | 9.6% |
| Total Housing Units | 4,102 | 100.0% |
Occupancy by Ownership by Household Size in Hardeeville
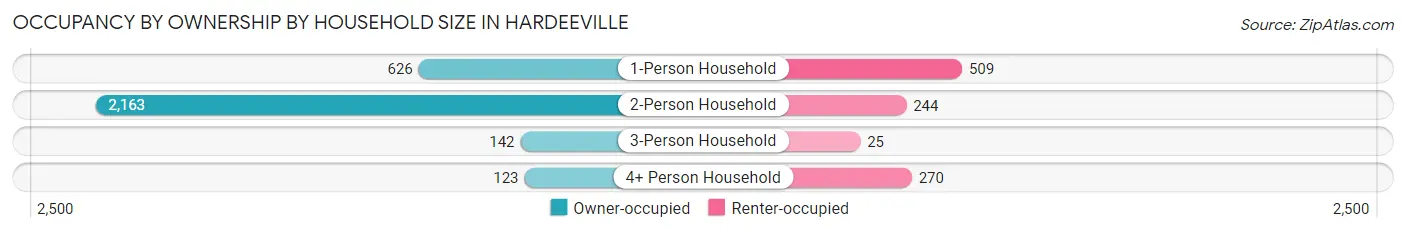
| Household Size | Owner-occupied | Renter-occupied |
| 1-Person Household | 626 (55.1%) | 509 (44.9%) |
| 2-Person Household | 2,163 (89.9%) | 244 (10.1%) |
| 3-Person Household | 142 (85.0%) | 25 (15.0%) |
| 4+ Person Household | 123 (31.3%) | 270 (68.7%) |
| Total Housing Units | 3,054 (74.5%) | 1,048 (25.6%) |
Occupancy by Educational Attainment in Hardeeville
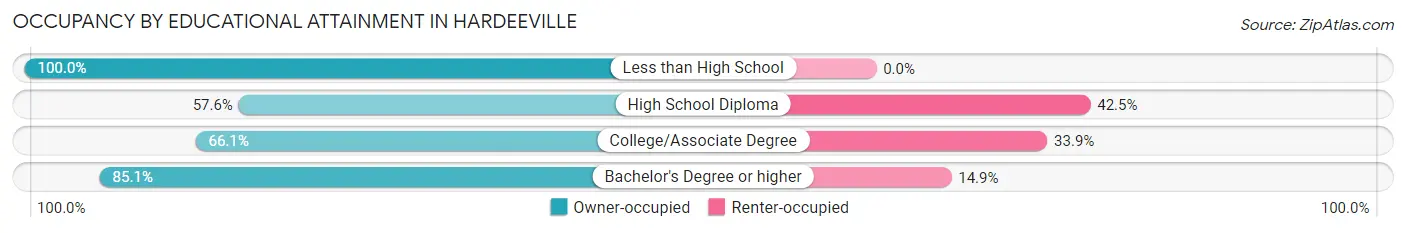
| Household Size | Owner-occupied | Renter-occupied |
| Less than High School | 56 (100.0%) | 0 (0.0%) |
| High School Diploma | 461 (57.6%) | 340 (42.4%) |
| College/Associate Degree | 782 (66.1%) | 401 (33.9%) |
| Bachelor's Degree or higher | 1,755 (85.1%) | 307 (14.9%) |
Occupancy by Age of Householder in Hardeeville
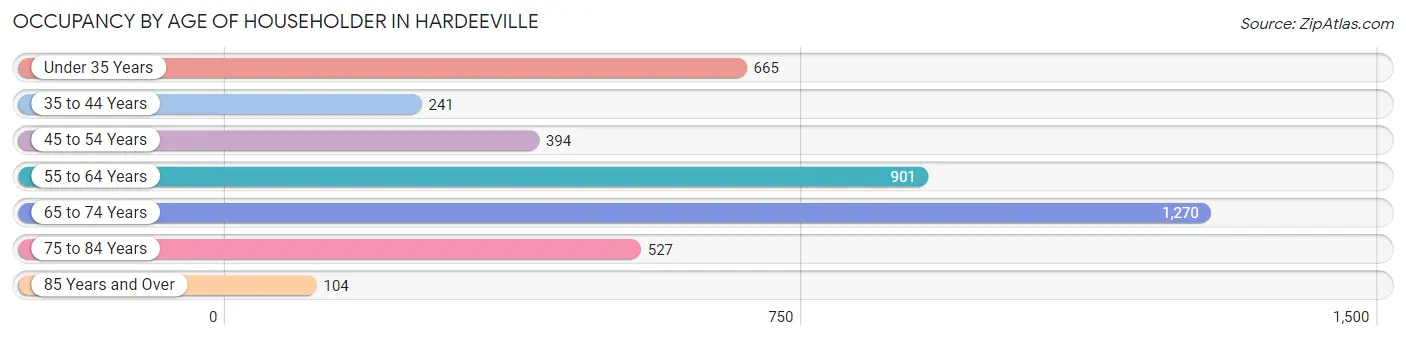
| Age Bracket | # Households | % Households |
| Under 35 Years | 665 | 16.2% |
| 35 to 44 Years | 241 | 5.9% |
| 45 to 54 Years | 394 | 9.6% |
| 55 to 64 Years | 901 | 22.0% |
| 65 to 74 Years | 1,270 | 31.0% |
| 75 to 84 Years | 527 | 12.9% |
| 85 Years and Over | 104 | 2.5% |
| Total | 4,102 | 100.0% |
Housing Finances in Hardeeville
Median Income by Occupancy in Hardeeville
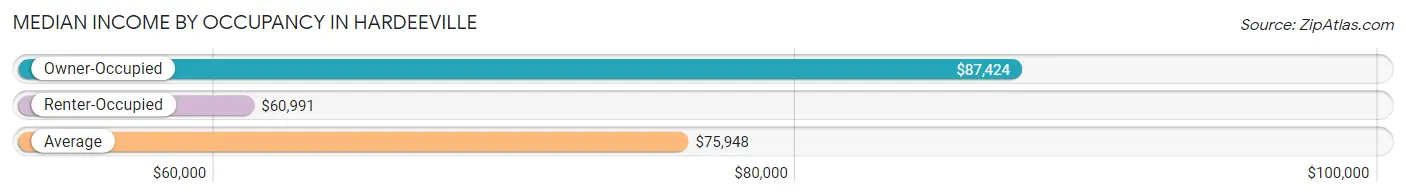
| Occupancy Type | # Households | Median Income |
| Owner-Occupied | 3,054 (74.5%) | $87,424 |
| Renter-Occupied | 1,048 (25.6%) | $60,991 |
| Average | 4,102 (100.0%) | $75,948 |
Occupancy by Householder Income Bracket in Hardeeville
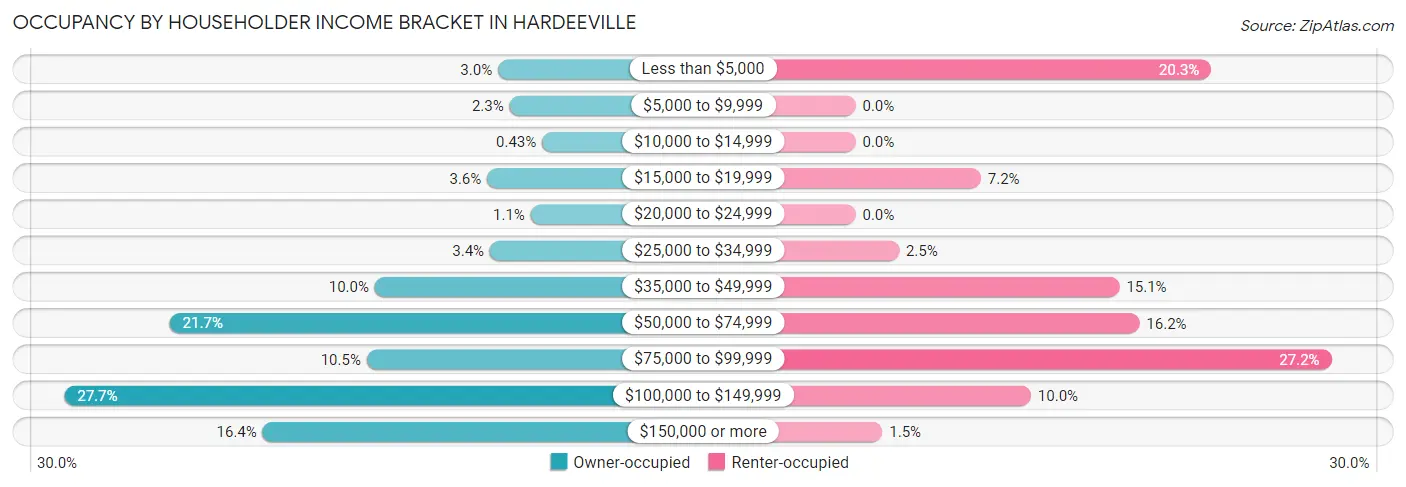
| Income Bracket | Owner-occupied | Renter-occupied |
| Less than $5,000 | 90 (2.9%) | 213 (20.3%) |
| $5,000 to $9,999 | 70 (2.3%) | 0 (0.0%) |
| $10,000 to $14,999 | 13 (0.4%) | 0 (0.0%) |
| $15,000 to $19,999 | 109 (3.6%) | 75 (7.2%) |
| $20,000 to $24,999 | 33 (1.1%) | 0 (0.0%) |
| $25,000 to $34,999 | 104 (3.4%) | 26 (2.5%) |
| $35,000 to $49,999 | 305 (10.0%) | 158 (15.1%) |
| $50,000 to $74,999 | 663 (21.7%) | 170 (16.2%) |
| $75,000 to $99,999 | 319 (10.4%) | 285 (27.2%) |
| $100,000 to $149,999 | 847 (27.7%) | 105 (10.0%) |
| $150,000 or more | 501 (16.4%) | 16 (1.5%) |
| Total | 3,054 (100.0%) | 1,048 (100.0%) |
Monthly Housing Cost Tiers in Hardeeville
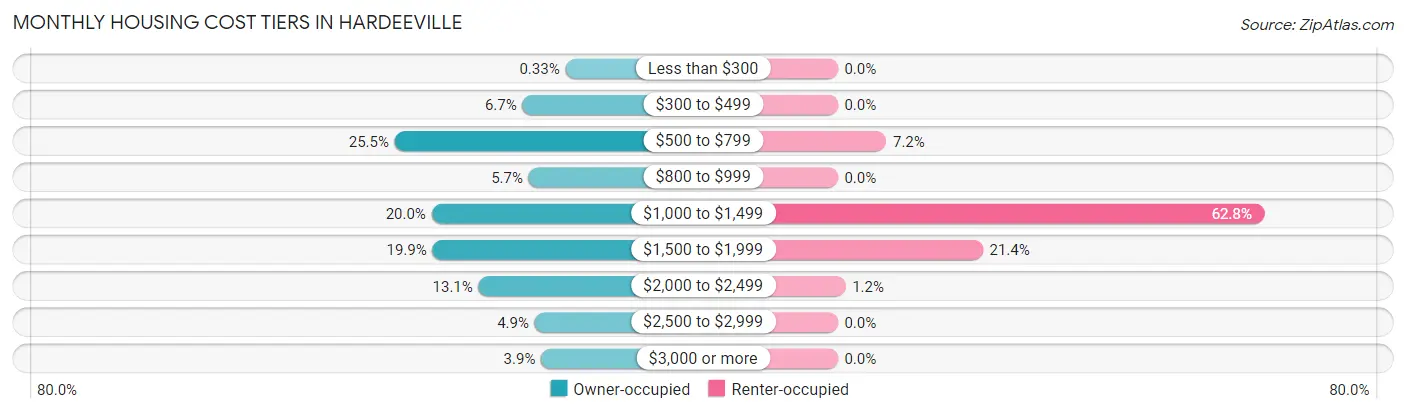
| Monthly Cost | Owner-occupied | Renter-occupied |
| Less than $300 | 10 (0.3%) | 0 (0.0%) |
| $300 to $499 | 203 (6.7%) | 0 (0.0%) |
| $500 to $799 | 778 (25.5%) | 75 (7.2%) |
| $800 to $999 | 175 (5.7%) | 0 (0.0%) |
| $1,000 to $1,499 | 612 (20.0%) | 658 (62.8%) |
| $1,500 to $1,999 | 608 (19.9%) | 224 (21.4%) |
| $2,000 to $2,499 | 401 (13.1%) | 12 (1.1%) |
| $2,500 to $2,999 | 148 (4.9%) | 0 (0.0%) |
| $3,000 or more | 119 (3.9%) | 0 (0.0%) |
| Total | 3,054 (100.0%) | 1,048 (100.0%) |
Physical Housing Characteristics in Hardeeville
Housing Structures in Hardeeville
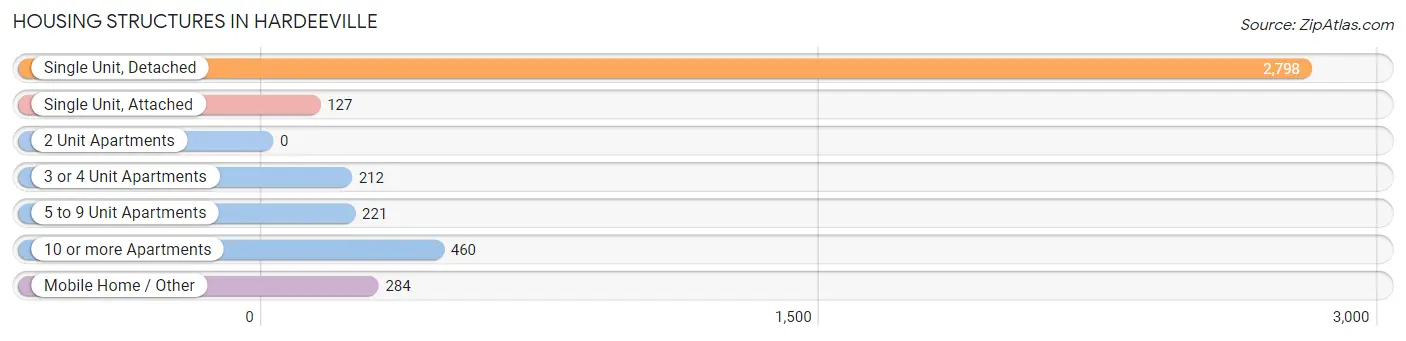
| Structure Type | # Housing Units | % Housing Units |
| Single Unit, Detached | 2,798 | 68.2% |
| Single Unit, Attached | 127 | 3.1% |
| 2 Unit Apartments | 0 | 0.0% |
| 3 or 4 Unit Apartments | 212 | 5.2% |
| 5 to 9 Unit Apartments | 221 | 5.4% |
| 10 or more Apartments | 460 | 11.2% |
| Mobile Home / Other | 284 | 6.9% |
| Total | 4,102 | 100.0% |
Housing Structures by Occupancy in Hardeeville
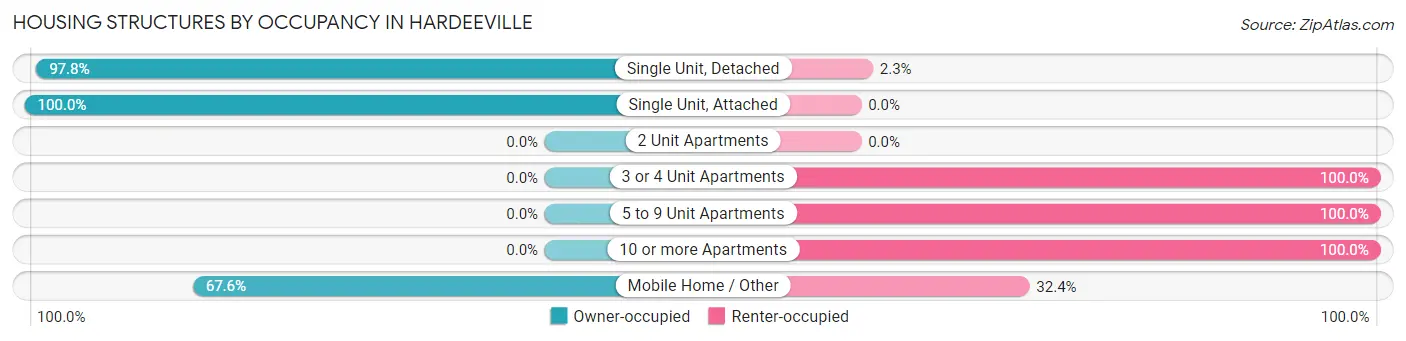
| Structure Type | Owner-occupied | Renter-occupied |
| Single Unit, Detached | 2,735 (97.8%) | 63 (2.2%) |
| Single Unit, Attached | 127 (100.0%) | 0 (0.0%) |
| 2 Unit Apartments | 0 (0.0%) | 0 (0.0%) |
| 3 or 4 Unit Apartments | 0 (0.0%) | 212 (100.0%) |
| 5 to 9 Unit Apartments | 0 (0.0%) | 221 (100.0%) |
| 10 or more Apartments | 0 (0.0%) | 460 (100.0%) |
| Mobile Home / Other | 192 (67.6%) | 92 (32.4%) |
| Total | 3,054 (74.5%) | 1,048 (25.6%) |
Housing Structures by Number of Rooms in Hardeeville
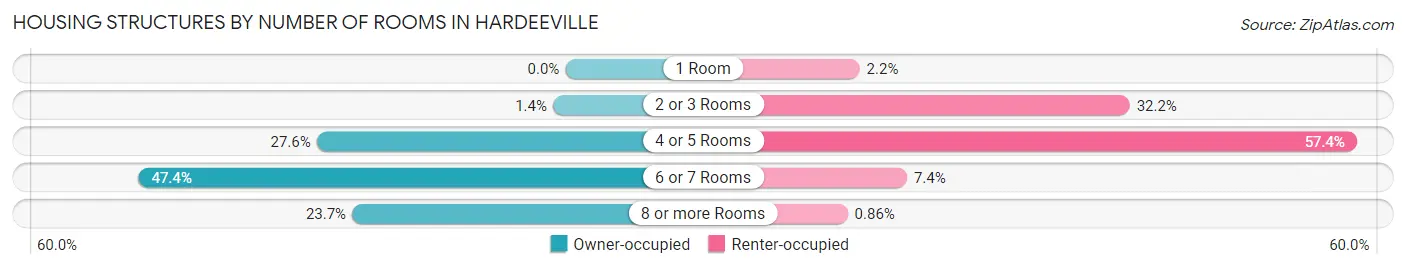
| Number of Rooms | Owner-occupied | Renter-occupied |
| 1 Room | 0 (0.0%) | 23 (2.2%) |
| 2 or 3 Rooms | 42 (1.4%) | 337 (32.2%) |
| 4 or 5 Rooms | 843 (27.6%) | 601 (57.4%) |
| 6 or 7 Rooms | 1,446 (47.3%) | 78 (7.4%) |
| 8 or more Rooms | 723 (23.7%) | 9 (0.9%) |
| Total | 3,054 (100.0%) | 1,048 (100.0%) |
Housing Structure by Heating Type in Hardeeville
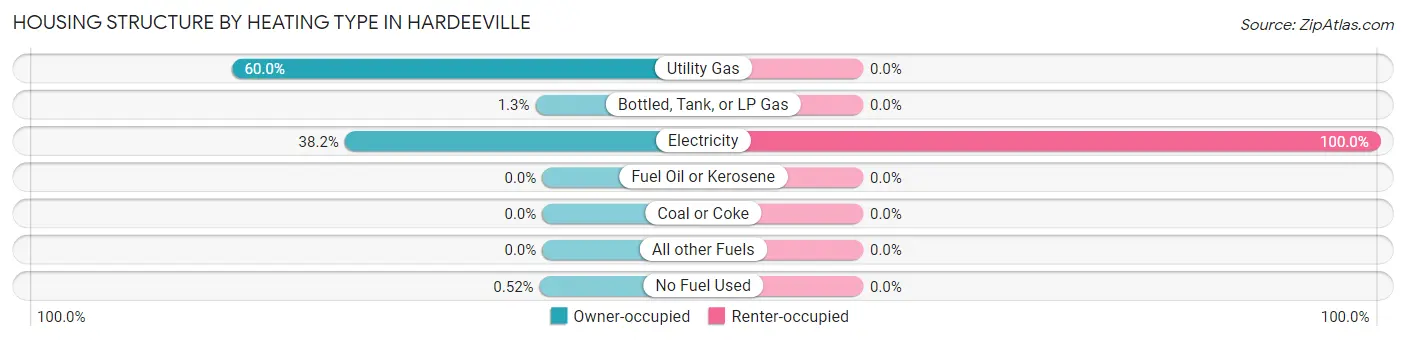
| Heating Type | Owner-occupied | Renter-occupied |
| Utility Gas | 1,833 (60.0%) | 0 (0.0%) |
| Bottled, Tank, or LP Gas | 40 (1.3%) | 0 (0.0%) |
| Electricity | 1,165 (38.2%) | 1,048 (100.0%) |
| Fuel Oil or Kerosene | 0 (0.0%) | 0 (0.0%) |
| Coal or Coke | 0 (0.0%) | 0 (0.0%) |
| All other Fuels | 0 (0.0%) | 0 (0.0%) |
| No Fuel Used | 16 (0.5%) | 0 (0.0%) |
| Total | 3,054 (100.0%) | 1,048 (100.0%) |
Household Vehicle Usage in Hardeeville
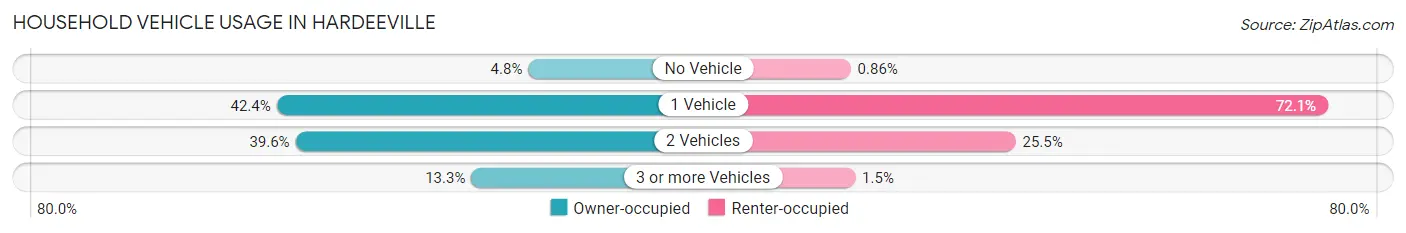
| Vehicles per Household | Owner-occupied | Renter-occupied |
| No Vehicle | 146 (4.8%) | 9 (0.9%) |
| 1 Vehicle | 1,294 (42.4%) | 756 (72.1%) |
| 2 Vehicles | 1,208 (39.6%) | 267 (25.5%) |
| 3 or more Vehicles | 406 (13.3%) | 16 (1.5%) |
| Total | 3,054 (100.0%) | 1,048 (100.0%) |
Real Estate & Mortgages in Hardeeville
Real Estate and Mortgage Overview in Hardeeville
| Characteristic | Without Mortgage | With Mortgage |
| Housing Units | 1,072 | 1,982 |
| Median Property Value | $457,800 | $415,600 |
| Median Household Income | $76,071 | $341 |
| Monthly Housing Costs | $663 | $106 |
| Real Estate Taxes | $3,612 | $204 |
Property Value by Mortgage Status in Hardeeville
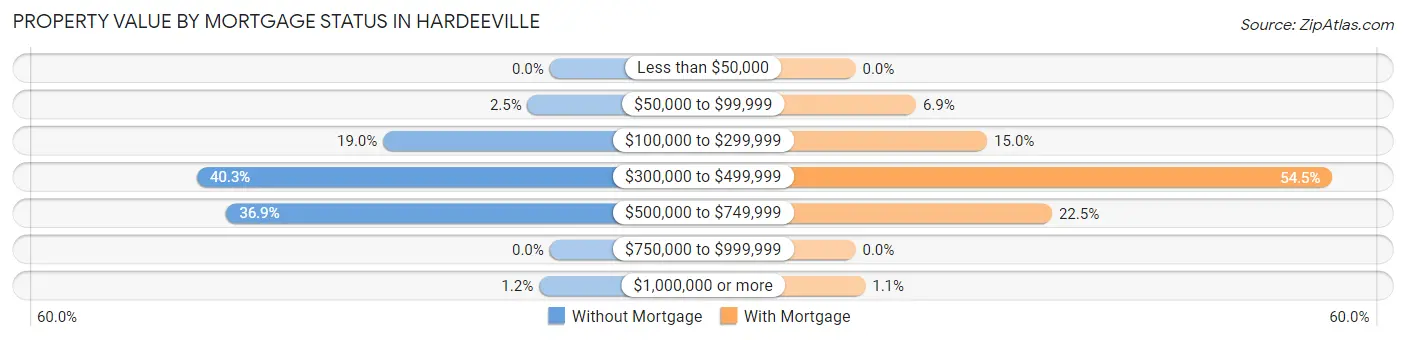
| Property Value | Without Mortgage | With Mortgage |
| Less than $50,000 | 0 (0.0%) | 0 (0.0%) |
| $50,000 to $99,999 | 27 (2.5%) | 137 (6.9%) |
| $100,000 to $299,999 | 204 (19.0%) | 298 (15.0%) |
| $300,000 to $499,999 | 432 (40.3%) | 1,080 (54.5%) |
| $500,000 to $749,999 | 396 (36.9%) | 445 (22.5%) |
| $750,000 to $999,999 | 0 (0.0%) | 0 (0.0%) |
| $1,000,000 or more | 13 (1.2%) | 22 (1.1%) |
| Total | 1,072 (100.0%) | 1,982 (100.0%) |
Household Income by Mortgage Status in Hardeeville
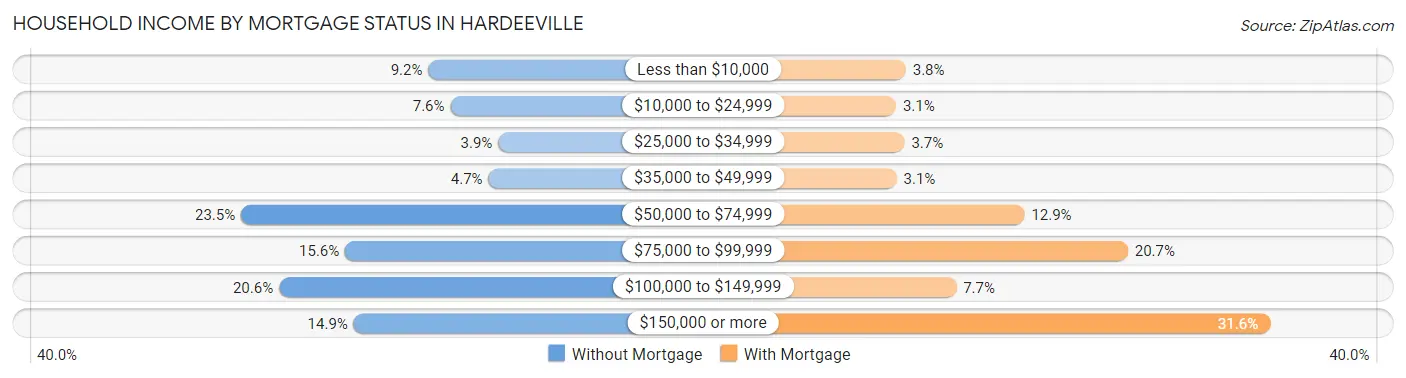
| Household Income | Without Mortgage | With Mortgage |
| Less than $10,000 | 99 (9.2%) | 76 (3.8%) |
| $10,000 to $24,999 | 81 (7.6%) | 61 (3.1%) |
| $25,000 to $34,999 | 42 (3.9%) | 74 (3.7%) |
| $35,000 to $49,999 | 50 (4.7%) | 62 (3.1%) |
| $50,000 to $74,999 | 252 (23.5%) | 255 (12.9%) |
| $75,000 to $99,999 | 167 (15.6%) | 411 (20.7%) |
| $100,000 to $149,999 | 221 (20.6%) | 152 (7.7%) |
| $150,000 or more | 160 (14.9%) | 626 (31.6%) |
| Total | 1,072 (100.0%) | 1,982 (100.0%) |
Property Value to Household Income Ratio in Hardeeville
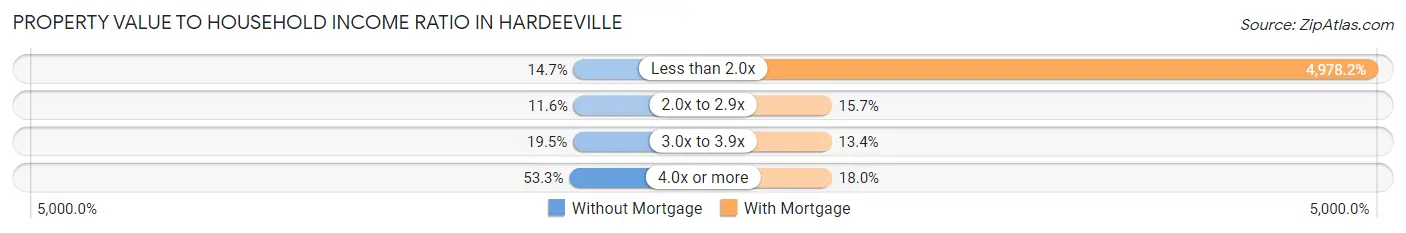
| Value-to-Income Ratio | Without Mortgage | With Mortgage |
| Less than 2.0x | 158 (14.7%) | 98,667 (4,978.2%) |
| 2.0x to 2.9x | 124 (11.6%) | 311 (15.7%) |
| 3.0x to 3.9x | 209 (19.5%) | 265 (13.4%) |
| 4.0x or more | 571 (53.3%) | 356 (18.0%) |
| Total | 1,072 (100.0%) | 1,982 (100.0%) |
Real Estate Taxes by Mortgage Status in Hardeeville
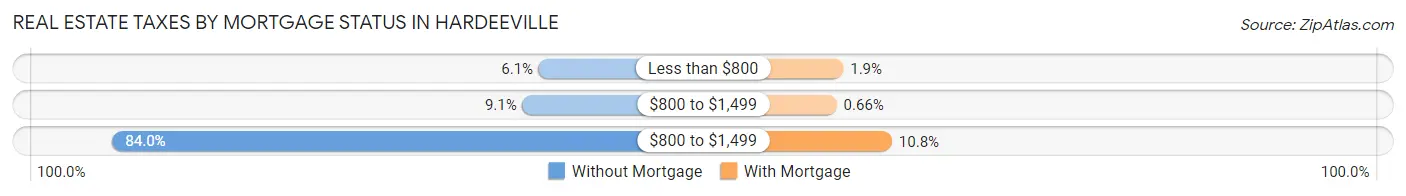
| Property Taxes | Without Mortgage | With Mortgage |
| Less than $800 | 65 (6.1%) | 37 (1.9%) |
| $800 to $1,499 | 97 (9.0%) | 13 (0.7%) |
| $800 to $1,499 | 900 (84.0%) | 213 (10.7%) |
| Total | 1,072 (100.0%) | 1,982 (100.0%) |
Health & Disability in Hardeeville
Health Insurance Coverage by Age in Hardeeville
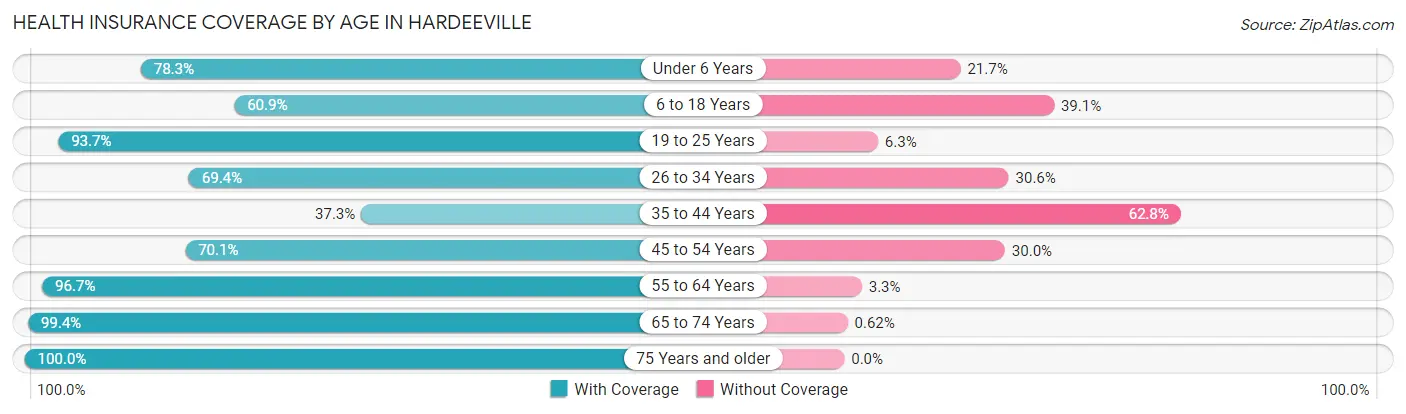
| Age Bracket | With Coverage | Without Coverage |
| Under 6 Years | 253 (78.3%) | 70 (21.7%) |
| 6 to 18 Years | 204 (60.9%) | 131 (39.1%) |
| 19 to 25 Years | 329 (93.7%) | 22 (6.3%) |
| 26 to 34 Years | 686 (69.4%) | 303 (30.6%) |
| 35 to 44 Years | 168 (37.2%) | 283 (62.7%) |
| 45 to 54 Years | 517 (70.1%) | 221 (29.9%) |
| 55 to 64 Years | 1,779 (96.7%) | 60 (3.3%) |
| 65 to 74 Years | 2,098 (99.4%) | 13 (0.6%) |
| 75 Years and older | 890 (100.0%) | 0 (0.0%) |
| Total | 6,924 (86.3%) | 1,103 (13.7%) |
Health Insurance Coverage by Citizenship Status in Hardeeville
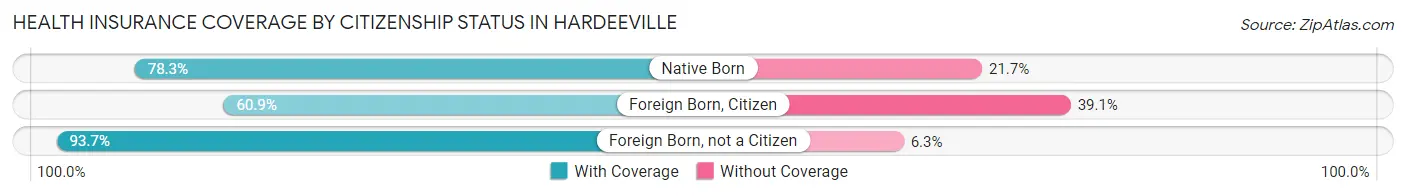
| Citizenship Status | With Coverage | Without Coverage |
| Native Born | 253 (78.3%) | 70 (21.7%) |
| Foreign Born, Citizen | 204 (60.9%) | 131 (39.1%) |
| Foreign Born, not a Citizen | 329 (93.7%) | 22 (6.3%) |
Health Insurance Coverage by Household Income in Hardeeville
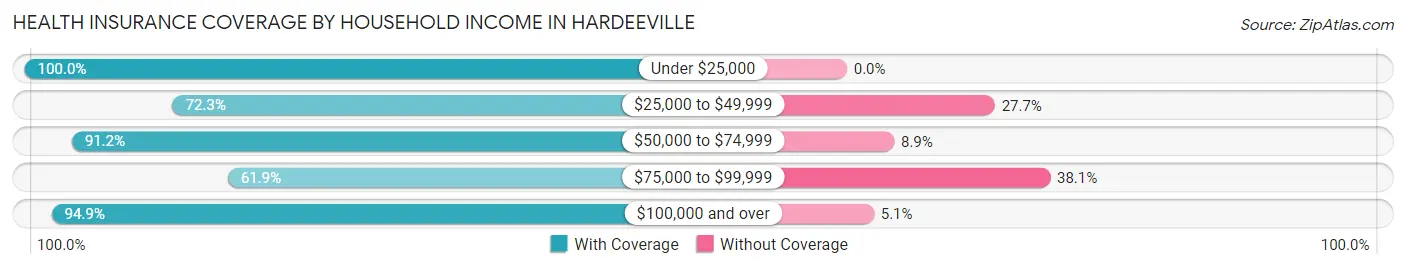
| Household Income | With Coverage | Without Coverage |
| Under $25,000 | 760 (100.0%) | 0 (0.0%) |
| $25,000 to $49,999 | 866 (72.3%) | 332 (27.7%) |
| $50,000 to $74,999 | 1,628 (91.1%) | 158 (8.8%) |
| $75,000 to $99,999 | 743 (61.9%) | 457 (38.1%) |
| $100,000 and over | 2,927 (94.9%) | 156 (5.1%) |
Public vs Private Health Insurance Coverage by Age in Hardeeville
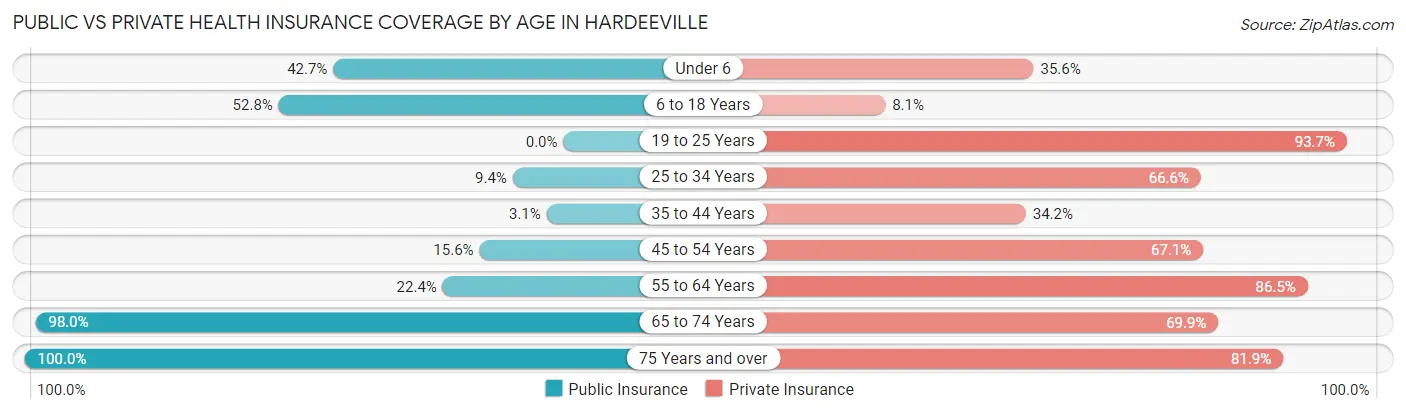
| Age Bracket | Public Insurance | Private Insurance |
| Under 6 | 138 (42.7%) | 115 (35.6%) |
| 6 to 18 Years | 177 (52.8%) | 27 (8.1%) |
| 19 to 25 Years | 0 (0.0%) | 329 (93.7%) |
| 25 to 34 Years | 93 (9.4%) | 659 (66.6%) |
| 35 to 44 Years | 14 (3.1%) | 154 (34.2%) |
| 45 to 54 Years | 115 (15.6%) | 495 (67.1%) |
| 55 to 64 Years | 412 (22.4%) | 1,590 (86.5%) |
| 65 to 74 Years | 2,069 (98.0%) | 1,475 (69.9%) |
| 75 Years and over | 890 (100.0%) | 729 (81.9%) |
| Total | 3,908 (48.7%) | 5,573 (69.4%) |
Disability Status by Sex by Age in Hardeeville
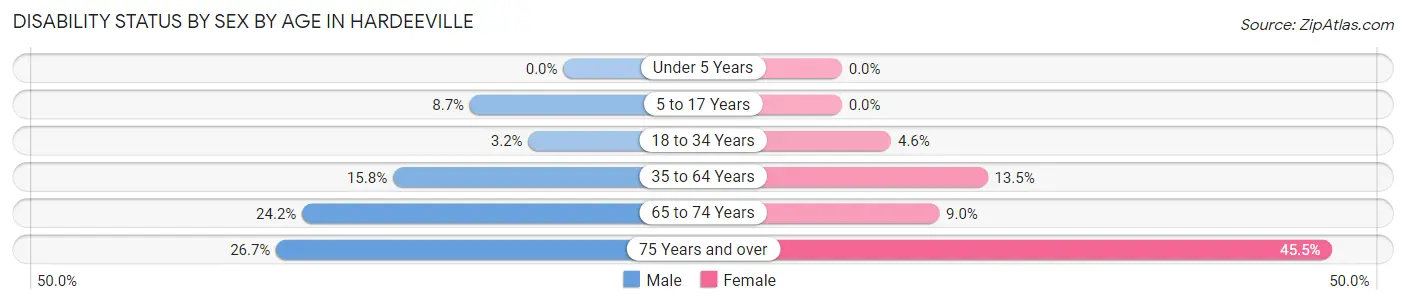
| Age Bracket | Male | Female |
| Under 5 Years | 0 (0.0%) | 0 (0.0%) |
| 5 to 17 Years | 17 (8.7%) | 0 (0.0%) |
| 18 to 34 Years | 25 (3.2%) | 26 (4.6%) |
| 35 to 64 Years | 246 (15.8%) | 199 (13.5%) |
| 65 to 74 Years | 246 (24.2%) | 99 (9.0%) |
| 75 Years and over | 109 (26.7%) | 219 (45.5%) |
Disability Class by Sex by Age in Hardeeville
Disability Class: Hearing Difficulty
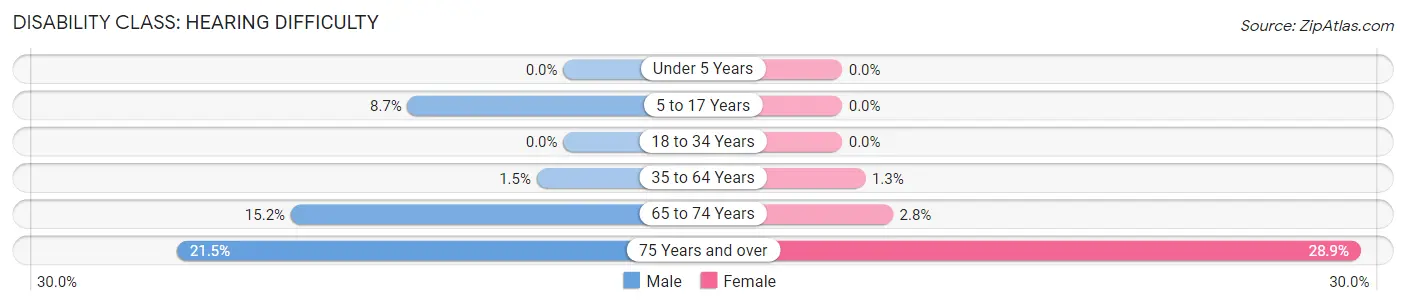
| Age Bracket | Male | Female |
| Under 5 Years | 0 (0.0%) | 0 (0.0%) |
| 5 to 17 Years | 17 (8.7%) | 0 (0.0%) |
| 18 to 34 Years | 0 (0.0%) | 0 (0.0%) |
| 35 to 64 Years | 23 (1.5%) | 19 (1.3%) |
| 65 to 74 Years | 154 (15.2%) | 31 (2.8%) |
| 75 Years and over | 88 (21.5%) | 139 (28.9%) |
Disability Class: Vision Difficulty
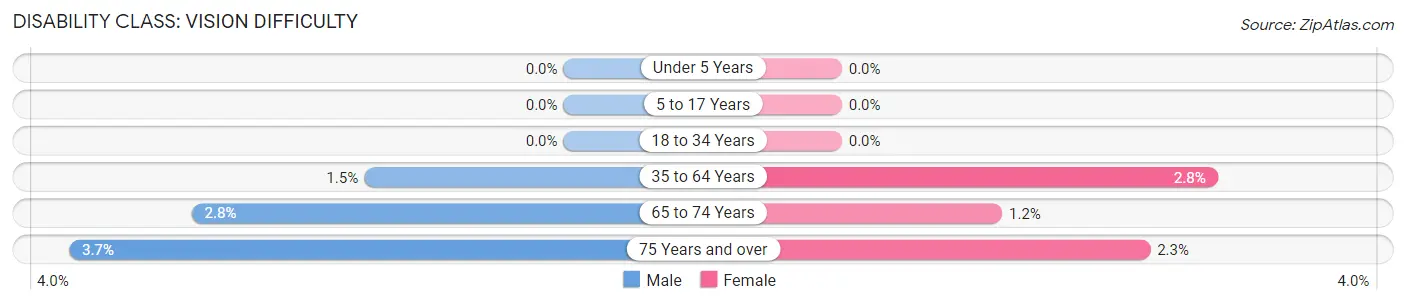
| Age Bracket | Male | Female |
| Under 5 Years | 0 (0.0%) | 0 (0.0%) |
| 5 to 17 Years | 0 (0.0%) | 0 (0.0%) |
| 18 to 34 Years | 0 (0.0%) | 0 (0.0%) |
| 35 to 64 Years | 23 (1.5%) | 41 (2.8%) |
| 65 to 74 Years | 28 (2.8%) | 13 (1.2%) |
| 75 Years and over | 15 (3.7%) | 11 (2.3%) |
Disability Class: Cognitive Difficulty
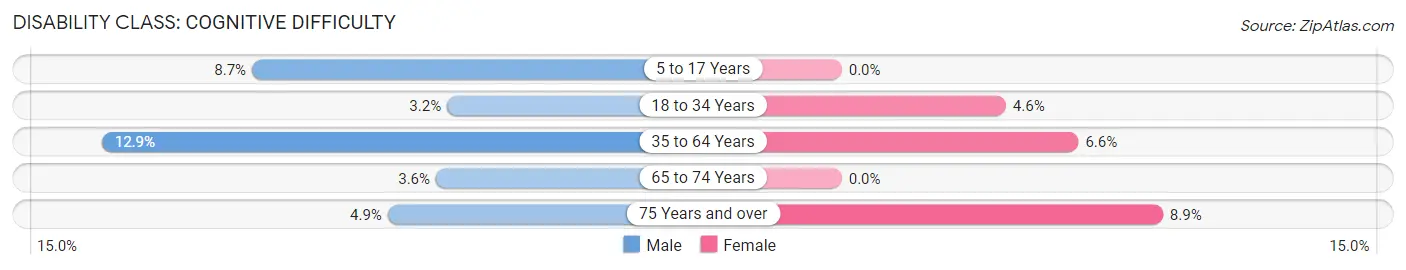
| Age Bracket | Male | Female |
| 5 to 17 Years | 17 (8.7%) | 0 (0.0%) |
| 18 to 34 Years | 25 (3.2%) | 26 (4.6%) |
| 35 to 64 Years | 200 (12.9%) | 97 (6.6%) |
| 65 to 74 Years | 36 (3.5%) | 0 (0.0%) |
| 75 Years and over | 20 (4.9%) | 43 (8.9%) |
Disability Class: Ambulatory Difficulty
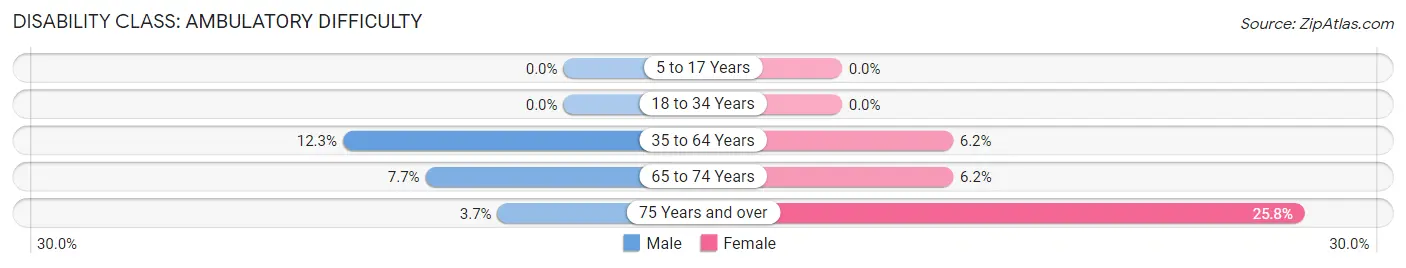
| Age Bracket | Male | Female |
| 5 to 17 Years | 0 (0.0%) | 0 (0.0%) |
| 18 to 34 Years | 0 (0.0%) | 0 (0.0%) |
| 35 to 64 Years | 191 (12.3%) | 91 (6.2%) |
| 65 to 74 Years | 78 (7.7%) | 68 (6.2%) |
| 75 Years and over | 15 (3.7%) | 124 (25.8%) |
Disability Class: Self-Care Difficulty
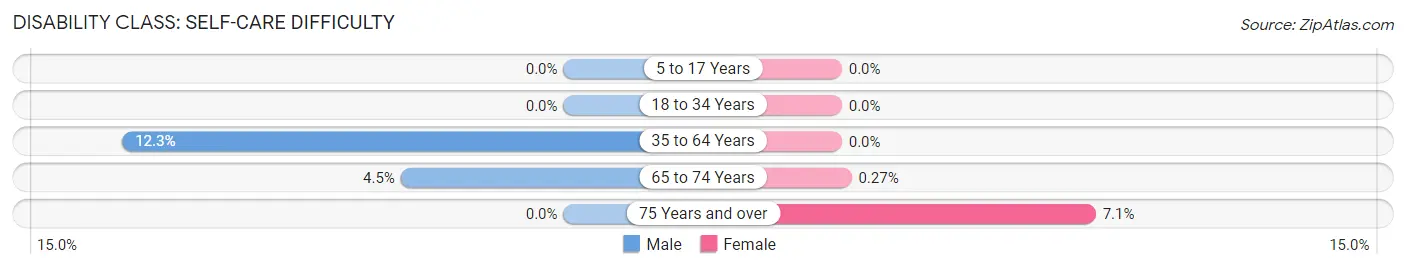
| Age Bracket | Male | Female |
| 5 to 17 Years | 0 (0.0%) | 0 (0.0%) |
| 18 to 34 Years | 0 (0.0%) | 0 (0.0%) |
| 35 to 64 Years | 191 (12.3%) | 0 (0.0%) |
| 65 to 74 Years | 46 (4.5%) | 3 (0.3%) |
| 75 Years and over | 0 (0.0%) | 34 (7.1%) |
Technology Access in Hardeeville
Computing Device Access in Hardeeville
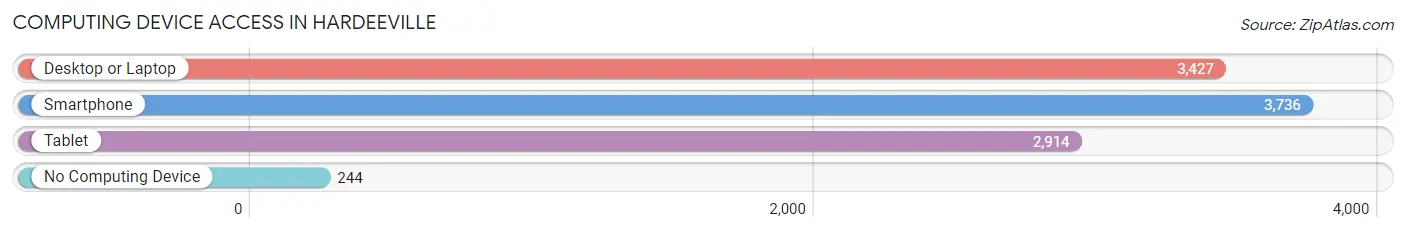
| Device Type | # Households | % Households |
| Desktop or Laptop | 3,427 | 83.5% |
| Smartphone | 3,736 | 91.1% |
| Tablet | 2,914 | 71.0% |
| No Computing Device | 244 | 5.9% |
| Total | 4,102 | 100.0% |
Internet Access in Hardeeville
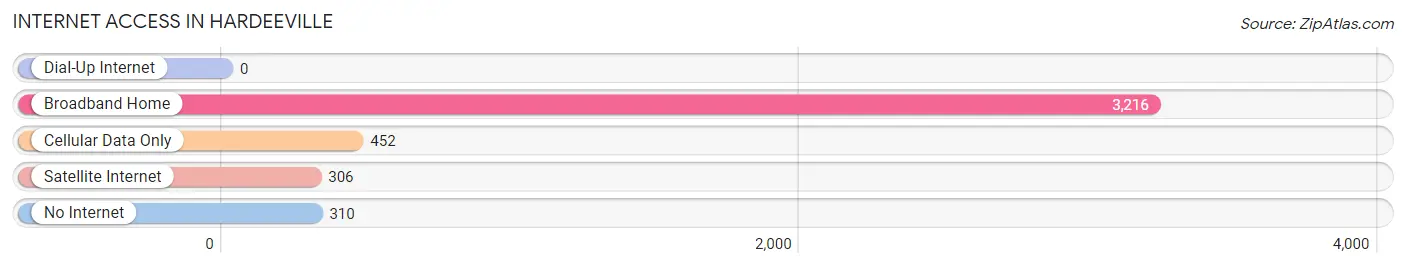
| Internet Type | # Households | % Households |
| Dial-Up Internet | 0 | 0.0% |
| Broadband Home | 3,216 | 78.4% |
| Cellular Data Only | 452 | 11.0% |
| Satellite Internet | 306 | 7.5% |
| No Internet | 310 | 7.6% |
| Total | 4,102 | 100.0% |
Hardeeville Summary
Hardeeville, SC is a small town located in Jasper County, South Carolina. It is situated along the Savannah River, just north of the Georgia border. The town was founded in 1872 and named after William Hardee, a Confederate general. Hardeeville is a rural community with a population of just over 4,000 people.
Geography
Hardeeville is located in the Lowcountry region of South Carolina, which is characterized by its flat terrain and coastal plains. The town is situated along the Savannah River, which forms the border between South Carolina and Georgia. The town is located about 25 miles northwest of Savannah, Georgia and about 50 miles south of Charleston, South Carolina. The town is also located near the Savannah National Wildlife Refuge, which is a popular destination for birdwatchers and nature lovers.
The climate in Hardeeville is humid subtropical, with hot, humid summers and mild winters. The average annual temperature is around 70 degrees Fahrenheit. The town receives an average of 48 inches of rain per year, with most of it falling in the summer months.
Economy
The economy of Hardeeville is largely based on agriculture and tourism. The town is home to several farms, which produce a variety of crops, including corn, soybeans, cotton, and peanuts. The town is also home to several tourist attractions, including the Savannah National Wildlife Refuge, the Hardeeville Motor Speedway, and the Savannah River.
The town is also home to several manufacturing companies, including a paper mill, a plastics plant, and a furniture factory. The town is also home to several retail stores, restaurants, and other businesses.
Demographics
As of the 2010 census, the population of Hardeeville was 4,099. The racial makeup of the town was 79.3% White, 16.2% African American, 0.3% Native American, 0.7% Asian, 0.1% Pacific Islander, and 3.4% from other races. The median household income was $35,945, and the median family income was $41,944.
The town is home to several churches, including the First Baptist Church of Hardeeville, the Hardeeville United Methodist Church, and the Hardeeville Presbyterian Church. The town is also home to several schools, including Hardeeville Elementary School, Hardeeville Middle School, and Hardeeville High School.
Conclusion
Hardeeville, SC is a small town located in Jasper County, South Carolina. It is situated along the Savannah River, just north of the Georgia border. The town was founded in 1872 and named after William Hardee, a Confederate general. Hardeeville is a rural community with a population of just over 4,000 people. The economy of Hardeeville is largely based on agriculture and tourism, and the town is home to several farms, manufacturing companies, retail stores, restaurants, and other businesses. The town is also home to several churches and schools. The racial makeup of the town is 79.3% White, 16.2% African American, 0.3% Native American, 0.7% Asian, 0.1% Pacific Islander, and 3.4% from other races. The median household income was $35,945, and the median family income was $41,944.
Common Questions
What is Per Capita Income in Hardeeville?
Per Capita income in Hardeeville is $47,552.
What is the Median Family Income in Hardeeville?
Median Family Income in Hardeeville is $88,365.
What is the Median Household income in Hardeeville?
Median Household Income in Hardeeville is $75,948.
What is Income or Wage Gap in Hardeeville?
Income or Wage Gap in Hardeeville is 24.7%.
Women in Hardeeville earn 75.3 cents for every dollar earned by a man.
What is Inequality or Gini Index in Hardeeville?
Inequality or Gini Index in Hardeeville is 0.42.
What is the Total Population of Hardeeville?
Total Population of Hardeeville is 8,048.
What is the Total Male Population of Hardeeville?
Total Male Population of Hardeeville is 4,110.
What is the Total Female Population of Hardeeville?
Total Female Population of Hardeeville is 3,938.
What is the Ratio of Males per 100 Females in Hardeeville?
There are 104.37 Males per 100 Females in Hardeeville.
What is the Ratio of Females per 100 Males in Hardeeville?
There are 95.82 Females per 100 Males in Hardeeville.
What is the Median Population Age in Hardeeville?
Median Population Age in Hardeeville is 60.3 Years.
What is the Average Family Size in Hardeeville
Average Family Size in Hardeeville is 2.2 People.
What is the Average Household Size in Hardeeville
Average Household Size in Hardeeville is 2.0 People.
How Large is the Labor Force in Hardeeville?
There are 3,575 People in the Labor Forcein in Hardeeville.
What is the Percentage of People in the Labor Force in Hardeeville?
48.0% of People are in the Labor Force in Hardeeville.
What is the Unemployment Rate in Hardeeville?
Unemployment Rate in Hardeeville is 9.0%.