Cities with the Highest Percentage of Immigrants from Caribbean in Texas
RELATED REPORTS & OPTIONS
Caribbean
Texas
Compare Cities
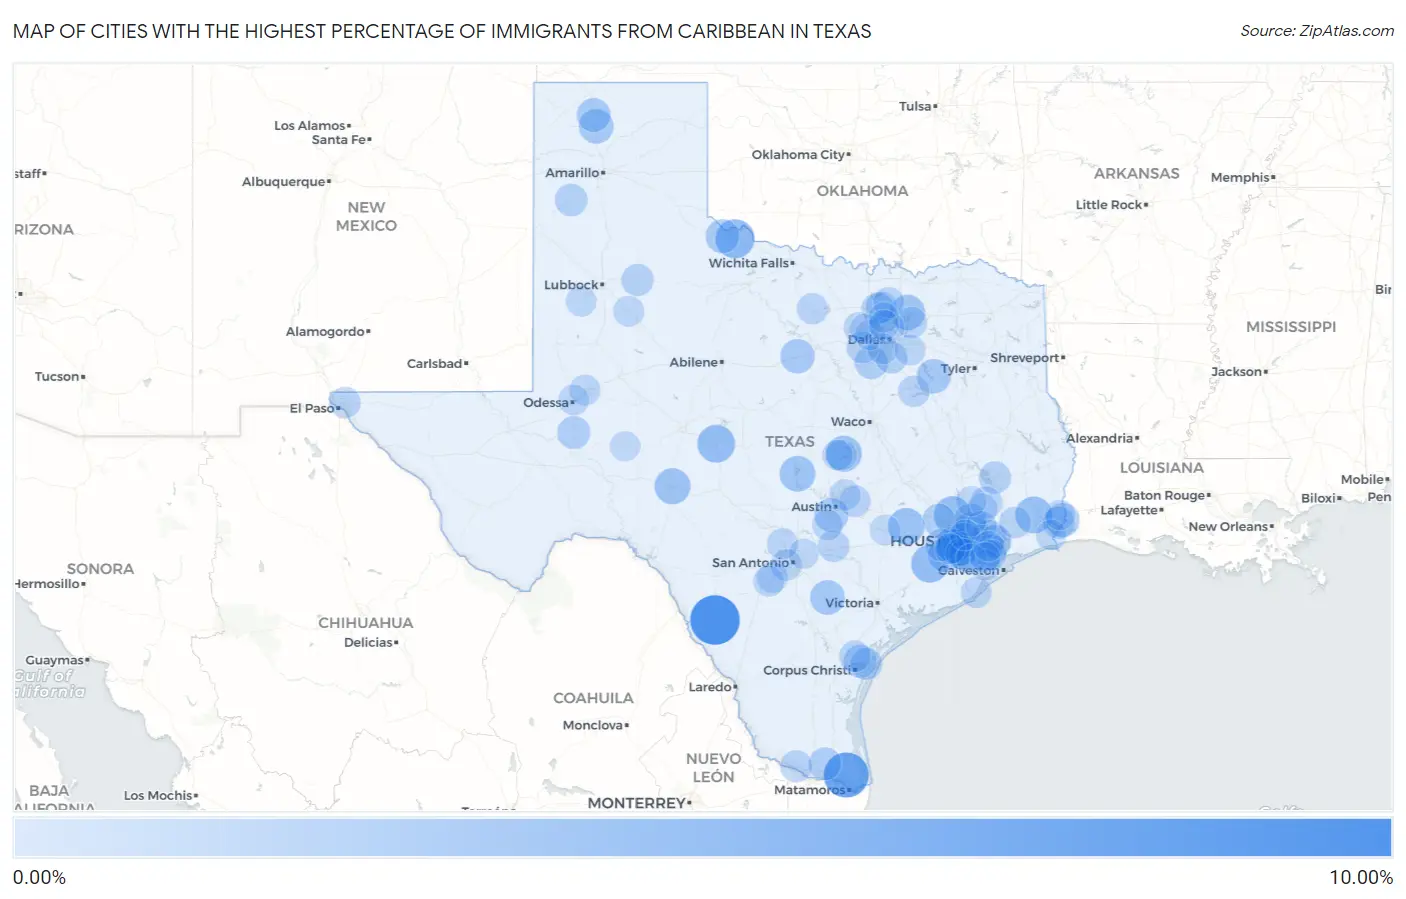
Map of Cities with the Highest Percentage of Immigrants from Caribbean in Texas
0.00%
10.00%
Cities with the Highest Percentage of Immigrants from Caribbean in Texas
| City | Caribbean | vs State | vs National | |
| 1. | Carrizo Springs | 8.80% | 0.42%(+8.38)#-1 | 1.37%(+7.42)#0 |
| 2. | Green Valley Farms | 6.84% | 0.42%(+6.42)#0 | 1.37%(+5.47)#1 |
| 3. | Pendleton | 4.50% | 0.42%(+4.08)#1 | 1.37%(+3.13)#2 |
| 4. | Chillicothe | 4.27% | 0.42%(+3.86)#2 | 1.37%(+2.90)#3 |
| 5. | Eden | 3.73% | 0.42%(+3.32)#3 | 1.37%(+2.36)#4 |
| 6. | Hungerford | 3.73% | 0.42%(+3.31)#4 | 1.37%(+2.36)#5 |
| 7. | Stagecoach | 3.61% | 0.42%(+3.19)#26 | 1.37%(+2.24)#483 |
| 8. | Bevil Oaks | 3.39% | 0.42%(+2.97)#27 | 1.37%(+2.01)#484 |
| 9. | Meadows Place | 3.37% | 0.42%(+2.95)#28 | 1.37%(+2.00)#485 |
| 10. | Industry | 3.26% | 0.42%(+2.84)#29 | 1.37%(+1.89)#486 |
| 11. | Mission Bend | 3.16% | 0.42%(+2.75)#30 | 1.37%(+1.79)#487 |
| 12. | Nolanville | 3.05% | 0.42%(+2.63)#31 | 1.37%(+1.68)#488 |
| 13. | Sonora | 3.02% | 0.42%(+2.60)#32 | 1.37%(+1.64)#489 |
| 14. | Buchanan Dam | 2.90% | 0.42%(+2.49)#33 | 1.37%(+1.53)#490 |
| 15. | Princeton | 2.73% | 0.42%(+2.31)#34 | 1.37%(+1.36)#491 |
| 16. | Aldine | 2.72% | 0.42%(+2.30)#35 | 1.37%(+1.35)#492 |
| 17. | Karnes City | 2.50% | 0.42%(+2.09)#36 | 1.37%(+1.13)#493 |
| 18. | Dumas | 2.48% | 0.42%(+2.06)#37 | 1.37%(+1.11)#494 |
| 19. | Highlands | 2.38% | 0.42%(+1.96)#38 | 1.37%(+1.01)#495 |
| 20. | Rosenberg | 2.38% | 0.42%(+1.96)#39 | 1.37%(+1.00)#496 |
| 21. | Log Cabin | 2.34% | 0.42%(+1.92)#40 | 1.37%(+0.966)#497 |
| 22. | Mingus | 2.33% | 0.42%(+1.91)#41 | 1.37%(+0.953)#498 |
| 23. | West Orange | 2.29% | 0.42%(+1.88)#42 | 1.37%(+0.921)#499 |
| 24. | Hunters Creek Village | 2.28% | 0.42%(+1.86)#43 | 1.37%(+0.909)#500 |
| 25. | San Leanna | 2.24% | 0.42%(+1.82)#44 | 1.37%(+0.863)#501 |
| 26. | Four Corners | 2.21% | 0.42%(+1.79)#45 | 1.37%(+0.835)#502 |
| 27. | Quanah | 2.18% | 0.42%(+1.76)#46 | 1.37%(+0.804)#503 |
| 28. | Cactus | 2.13% | 0.42%(+1.71)#47 | 1.37%(+0.755)#504 |
| 29. | Stafford | 2.09% | 0.42%(+1.67)#48 | 1.37%(+0.716)#505 |
| 30. | Rice Tracts | 2.03% | 0.42%(+1.61)#49 | 1.37%(+0.653)#506 |
| 31. | Venus | 1.94% | 0.42%(+1.52)#50 | 1.37%(+0.566)#507 |
| 32. | Addison | 1.82% | 0.42%(+1.40)#54 | 1.37%(+0.448)#1,165 |
| 33. | Crane | 1.79% | 0.42%(+1.38)#55 | 1.37%(+0.422)#1,166 |
| 34. | Oak Ridge Town Kaufman County | 1.77% | 0.42%(+1.35)#56 | 1.37%(+0.394)#1,167 |
| 35. | Baytown | 1.74% | 0.42%(+1.32)#57 | 1.37%(+0.368)#1,168 |
| 36. | Portland | 1.72% | 0.42%(+1.30)#58 | 1.37%(+0.346)#1,169 |
| 37. | La Villa | 1.71% | 0.42%(+1.29)#59 | 1.37%(+0.334)#1,170 |
| 38. | Hereford | 1.67% | 0.42%(+1.25)#60 | 1.37%(+0.294)#1,171 |
| 39. | Spring | 1.65% | 0.42%(+1.23)#61 | 1.37%(+0.276)#1,172 |
| 40. | Waller | 1.57% | 0.42%(+1.15)#62 | 1.37%(+0.193)#1,173 |
| 41. | Fulshear | 1.53% | 0.42%(+1.11)#63 | 1.37%(+0.159)#1,174 |
| 42. | Crosbyton | 1.51% | 0.42%(+1.09)#64 | 1.37%(+0.136)#1,175 |
| 43. | Livingston | 1.50% | 0.42%(+1.08)#65 | 1.37%(+0.126)#1,176 |
| 44. | Bridge City | 1.45% | 0.42%(+1.03)#66 | 1.37%(+0.076)#1,177 |
| 45. | Ingleside | 1.44% | 0.42%(+1.02)#67 | 1.37%(+0.069)#1,178 |
| 46. | Fresno | 1.41% | 0.42%(+0.998)#68 | 1.37%(+0.042)#1,179 |
| 47. | Cross Roads | 1.40% | 0.42%(+0.981)#69 | 1.37%(+0.026)#1,180 |
| 48. | Red Oak | 1.39% | 0.42%(+0.977)#70 | 1.37%(+0.021)#1,181 |
| 49. | Cleveland | 1.37% | 0.42%(+0.950)#71 | 1.37%(-0.006)#1,182 |
| 50. | Penitas | 1.35% | 0.42%(+0.929)#72 | 1.37%(-0.026)#1,183 |
| 51. | Forest Hill | 1.30% | 0.42%(+0.879)#73 | 1.37%(-0.076)#1,184 |
| 52. | Shoreacres | 1.28% | 0.42%(+0.865)#74 | 1.37%(-0.090)#1,185 |
| 53. | Kingsbury | 1.27% | 0.42%(+0.857)#75 | 1.37%(-0.099)#1,186 |
| 54. | Nassau Bay | 1.27% | 0.42%(+0.848)#76 | 1.37%(-0.107)#1,187 |
| 55. | Providence Village | 1.26% | 0.42%(+0.841)#77 | 1.37%(-0.114)#1,188 |
| 56. | Devers | 1.22% | 0.42%(+0.802)#78 | 1.37%(-0.153)#1,189 |
| 57. | Taft | 1.20% | 0.42%(+0.781)#79 | 1.37%(-0.174)#1,190 |
| 58. | Lavon | 1.19% | 0.42%(+0.777)#80 | 1.37%(-0.178)#1,191 |
| 59. | Missouri City | 1.18% | 0.42%(+0.762)#81 | 1.37%(-0.193)#1,192 |
| 60. | Elgin | 1.16% | 0.42%(+0.748)#82 | 1.37%(-0.207)#1,193 |
| 61. | Lackland Afb | 1.14% | 0.42%(+0.727)#83 | 1.37%(-0.228)#1,194 |
| 62. | Jacksboro | 1.14% | 0.42%(+0.722)#84 | 1.37%(-0.233)#1,195 |
| 63. | Navarro | 1.14% | 0.42%(+0.719)#85 | 1.37%(-0.236)#1,196 |
| 64. | Fort Bliss | 1.12% | 0.42%(+0.702)#86 | 1.37%(-0.253)#1,197 |
| 65. | Pflugerville | 1.09% | 0.42%(+0.669)#87 | 1.37%(-0.286)#1,198 |
| 66. | Natalia | 1.00% | 0.42%(+0.580)#88 | 1.37%(-0.375)#1,199 |
| 67. | Celina | 0.98% | 0.42%(+0.564)#89 | 1.37%(-0.391)#1,200 |
| 68. | Surfside Beach | 0.97% | 0.42%(+0.555)#90 | 1.37%(-0.400)#1,201 |
| 69. | Santa Fe | 0.96% | 0.42%(+0.544)#91 | 1.37%(-0.411)#1,202 |
| 70. | Scenic Oaks | 0.95% | 0.42%(+0.537)#92 | 1.37%(-0.418)#1,203 |
| 71. | Midland | 0.94% | 0.42%(+0.527)#97 | 1.37%(-0.428)#2,091 |
| 72. | Kyle | 0.93% | 0.42%(+0.513)#98 | 1.37%(-0.442)#2,092 |
| 73. | Post | 0.93% | 0.42%(+0.511)#99 | 1.37%(-0.444)#2,093 |
| 74. | Duncanville | 0.93% | 0.42%(+0.511)#100 | 1.37%(-0.444)#2,094 |
| 75. | Crandall | 0.92% | 0.42%(+0.501)#101 | 1.37%(-0.454)#2,095 |
| 76. | Devine | 0.91% | 0.42%(+0.497)#102 | 1.37%(-0.458)#2,096 |
| 77. | Odessa | 0.90% | 0.42%(+0.487)#116 | 1.37%(-0.468)#2,342 |
| 78. | Heartland | 0.90% | 0.42%(+0.483)#117 | 1.37%(-0.473)#2,343 |
| 79. | Houston | 0.87% | 0.42%(+0.453)#118 | 1.37%(-0.503)#2,344 |
| 80. | Atascocita | 0.87% | 0.42%(+0.451)#119 | 1.37%(-0.504)#2,345 |
| 81. | Harker Heights | 0.86% | 0.42%(+0.446)#120 | 1.37%(-0.510)#2,346 |
| 82. | Pecan Grove | 0.86% | 0.42%(+0.439)#121 | 1.37%(-0.517)#2,347 |
| 83. | Meadow | 0.85% | 0.42%(+0.433)#122 | 1.37%(-0.522)#2,348 |
| 84. | Kemah | 0.82% | 0.42%(+0.405)#123 | 1.37%(-0.550)#2,349 |
| 85. | Killeen | 0.82% | 0.42%(+0.398)#124 | 1.37%(-0.557)#2,350 |
| 86. | Haslet | 0.81% | 0.42%(+0.396)#125 | 1.37%(-0.559)#2,351 |
| 87. | La Grange | 0.79% | 0.42%(+0.375)#126 | 1.37%(-0.580)#2,352 |
| 88. | Splendora | 0.78% | 0.42%(+0.364)#127 | 1.37%(-0.592)#2,353 |
| 89. | Bedford | 0.78% | 0.42%(+0.363)#128 | 1.37%(-0.592)#2,354 |
| 90. | Port Arthur | 0.78% | 0.42%(+0.363)#129 | 1.37%(-0.592)#2,355 |
| 91. | Manvel | 0.75% | 0.42%(+0.337)#130 | 1.37%(-0.618)#2,356 |
| 92. | Keller | 0.72% | 0.42%(+0.307)#131 | 1.37%(-0.649)#2,357 |
| 93. | League City | 0.72% | 0.42%(+0.306)#132 | 1.37%(-0.650)#2,358 |
| 94. | La Porte | 0.72% | 0.42%(+0.304)#133 | 1.37%(-0.651)#2,359 |
| 95. | Cut And Shoot | 0.70% | 0.42%(+0.281)#134 | 1.37%(-0.675)#2,360 |
| 96. | Universal City | 0.68% | 0.42%(+0.265)#135 | 1.37%(-0.691)#2,361 |
| 97. | Big Lake | 0.67% | 0.42%(+0.255)#136 | 1.37%(-0.701)#2,362 |
| 98. | Orange | 0.67% | 0.42%(+0.254)#137 | 1.37%(-0.701)#2,363 |
| 99. | The Colony | 0.67% | 0.42%(+0.253)#138 | 1.37%(-0.702)#2,364 |
| 100. | Carrollton | 0.67% | 0.42%(+0.253)#139 | 1.37%(-0.703)#2,365 |
Common Questions
What are the Top 10 Cities with the Highest Percentage of Immigrants from Caribbean in Texas?
Top 10 Cities with the Highest Percentage of Immigrants from Caribbean in Texas are:
#1
8.80%
#2
6.84%
#3
4.27%
#4
3.73%
#5
3.73%
#6
3.61%
#7
3.39%
#8
3.37%
#9
3.26%
#10
3.16%
What city has the Highest Percentage of Immigrants from Caribbean in Texas?
Carrizo Springs has the Highest Percentage of Immigrants from Caribbean in Texas with 8.80%.
What is the Percentage of Immigrants from Caribbean in the State of Texas?
Percentage of Immigrants from Caribbean in Texas is 0.42%.
What is the Percentage of Immigrants from Caribbean in the United States?
Percentage of Immigrants from Caribbean in the United States is 1.37%.