Hollywood, SC Map & Demographics
Hollywood Map
Hollywood Overview
$44,857
PER CAPITA INCOME
$101,453
AVG FAMILY INCOME
$77,191
AVG HOUSEHOLD INCOME
7.2%
WAGE / INCOME GAP [ % ]
92.8¢/ $1
WAGE / INCOME GAP [ $ ]
0.51
INEQUALITY / GINI INDEX
5,397
TOTAL POPULATION
2,652
MALE POPULATION
2,745
FEMALE POPULATION
96.61
MALES / 100 FEMALES
103.51
FEMALES / 100 MALES
53.0
MEDIAN AGE
3.2
AVG FAMILY SIZE
2.6
AVG HOUSEHOLD SIZE
2,543
LABOR FORCE [ PEOPLE ]
55.7%
PERCENT IN LABOR FORCE
4.8%
UNEMPLOYMENT RATE
Hollywood Zip Codes
Hollywood Area Codes
Income in Hollywood
Income Overview in Hollywood
Per Capita Income in Hollywood is $44,857, while median incomes of families and households are $101,453 and $77,191 respectively.
| Characteristic | Number | Measure |
| Per Capita Income | 5,397 | $44,857 |
| Median Family Income | 1,473 | $101,453 |
| Mean Family Income | 1,473 | $141,071 |
| Median Household Income | 2,026 | $77,191 |
| Mean Household Income | 2,026 | $115,724 |
| Income Deficit | 1,473 | $0 |
| Wage / Income Gap (%) | 5,397 | 7.18% |
| Wage / Income Gap ($) | 5,397 | 92.82¢ per $1 |
| Gini / Inequality Index | 5,397 | 0.51 |
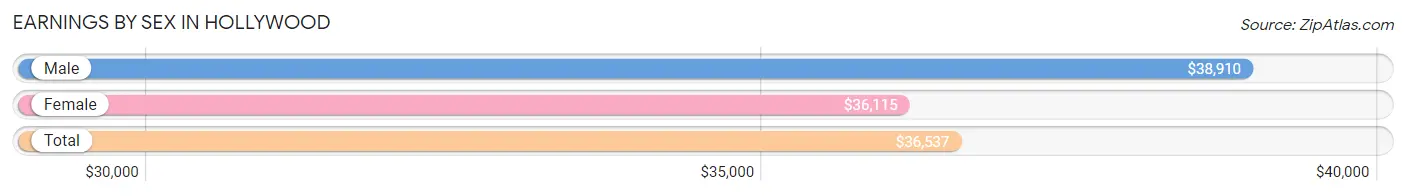
Earnings by Sex in Hollywood
Average Earnings in Hollywood are $36,537, $38,910 for men and $36,115 for women, a difference of 7.2%.
| Sex | Number | Average Earnings |
| Male | 1,503 (56.6%) | $38,910 |
| Female | 1,152 (43.4%) | $36,115 |
| Total | 2,655 (100.0%) | $36,537 |
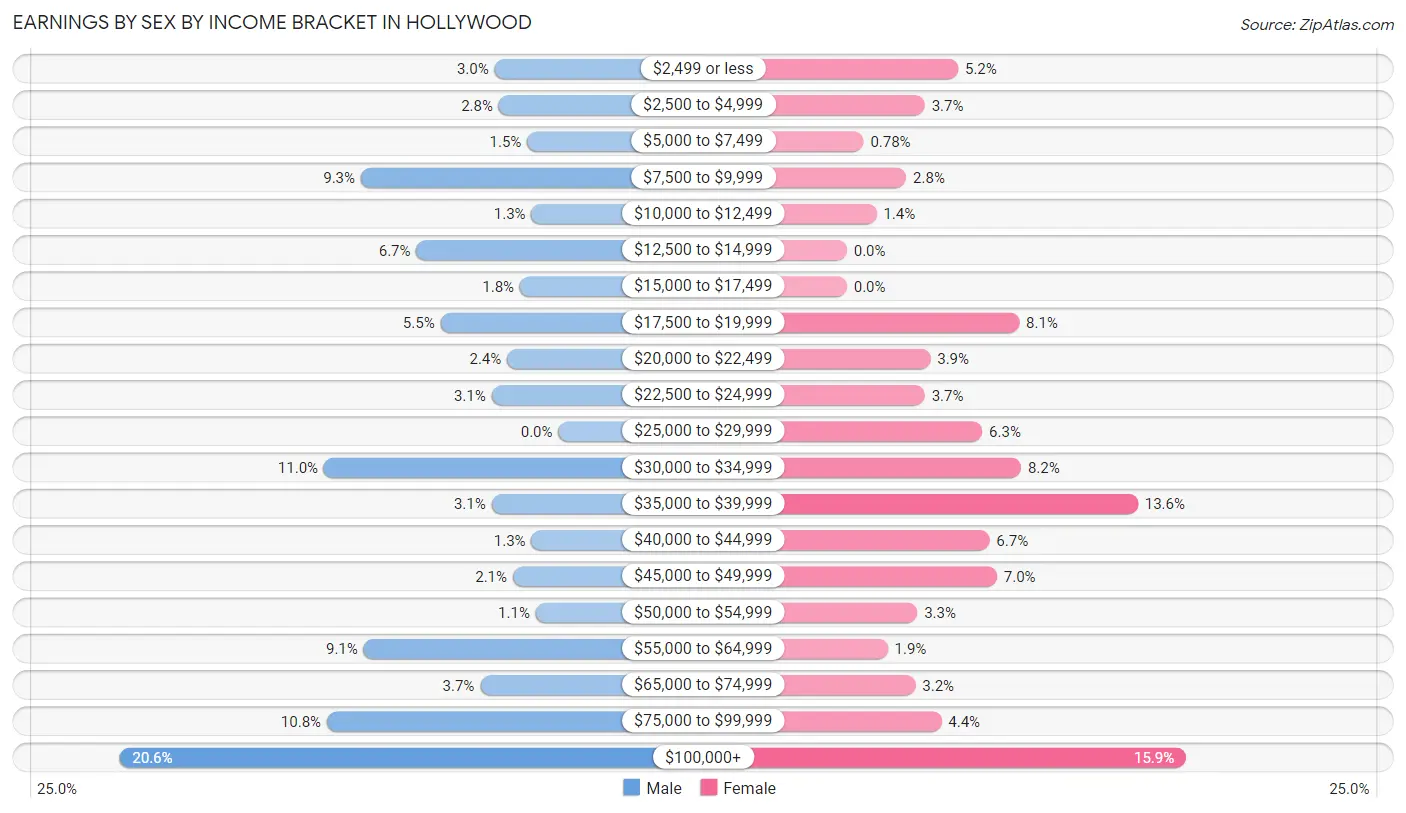
Earnings by Sex by Income Bracket in Hollywood
The most common earnings brackets in Hollywood are $100,000+ for men (309 | 20.6%) and $100,000+ for women (183 | 15.9%).
| Income | Male | Female |
| $2,499 or less | 45 (3.0%) | 60 (5.2%) |
| $2,500 to $4,999 | 42 (2.8%) | 42 (3.6%) |
| $5,000 to $7,499 | 22 (1.5%) | 9 (0.8%) |
| $7,500 to $9,999 | 139 (9.2%) | 32 (2.8%) |
| $10,000 to $12,499 | 19 (1.3%) | 16 (1.4%) |
| $12,500 to $14,999 | 100 (6.7%) | 0 (0.0%) |
| $15,000 to $17,499 | 27 (1.8%) | 0 (0.0%) |
| $17,500 to $19,999 | 83 (5.5%) | 93 (8.1%) |
| $20,000 to $22,499 | 36 (2.4%) | 45 (3.9%) |
| $22,500 to $24,999 | 47 (3.1%) | 42 (3.6%) |
| $25,000 to $29,999 | 0 (0.0%) | 73 (6.3%) |
| $30,000 to $34,999 | 165 (11.0%) | 94 (8.2%) |
| $35,000 to $39,999 | 47 (3.1%) | 157 (13.6%) |
| $40,000 to $44,999 | 19 (1.3%) | 77 (6.7%) |
| $45,000 to $49,999 | 32 (2.1%) | 81 (7.0%) |
| $50,000 to $54,999 | 16 (1.1%) | 38 (3.3%) |
| $55,000 to $64,999 | 137 (9.1%) | 22 (1.9%) |
| $65,000 to $74,999 | 55 (3.7%) | 37 (3.2%) |
| $75,000 to $99,999 | 163 (10.8%) | 51 (4.4%) |
| $100,000+ | 309 (20.6%) | 183 (15.9%) |
| Total | 1,503 (100.0%) | 1,152 (100.0%) |
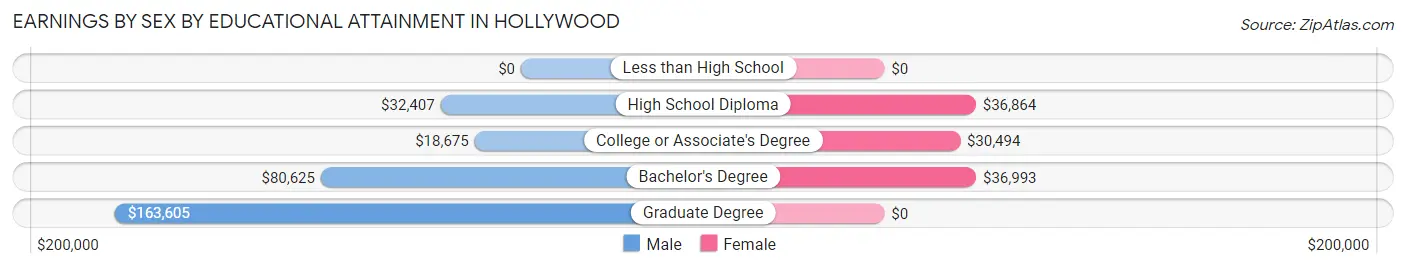
Earnings by Sex by Educational Attainment in Hollywood
Average earnings in Hollywood are $45,508 for men and $36,919 for women, a difference of 18.9%. Men with an educational attainment of graduate degree enjoy the highest average annual earnings of $163,605, while those with college or associate's degree education earn the least with $18,675. Women with an educational attainment of bachelor's degree earn the most with the average annual earnings of $36,993, while those with college or associate's degree education have the smallest earnings of $30,494.
| Educational Attainment | Male Income | Female Income |
| Less than High School | - | - |
| High School Diploma | $32,407 | $36,864 |
| College or Associate's Degree | $18,675 | $30,494 |
| Bachelor's Degree | $80,625 | $36,993 |
| Graduate Degree | $163,605 | $0 |
| Total | $45,508 | $36,919 |
Family Income in Hollywood
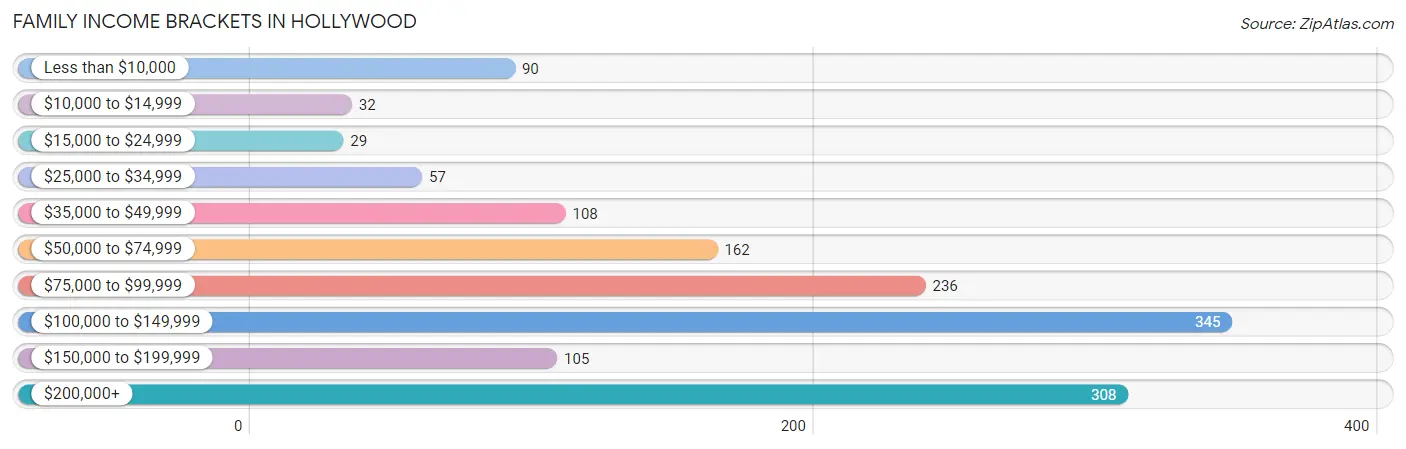
Family Income Brackets in Hollywood
According to the Hollywood family income data, there are 345 families falling into the $100,000 to $149,999 income range, which is the most common income bracket and makes up 23.4% of all families. Conversely, the $15,000 to $24,999 income bracket is the least frequent group with only 29 families (2.0%) belonging to this category.
| Income Bracket | # Families | % Families |
| Less than $10,000 | 90 | 6.1% |
| $10,000 to $14,999 | 32 | 2.2% |
| $15,000 to $24,999 | 29 | 2.0% |
| $25,000 to $34,999 | 57 | 3.9% |
| $35,000 to $49,999 | 108 | 7.3% |
| $50,000 to $74,999 | 162 | 11.0% |
| $75,000 to $99,999 | 236 | 16.0% |
| $100,000 to $149,999 | 345 | 23.4% |
| $150,000 to $199,999 | 105 | 7.1% |
| $200,000+ | 308 | 20.9% |
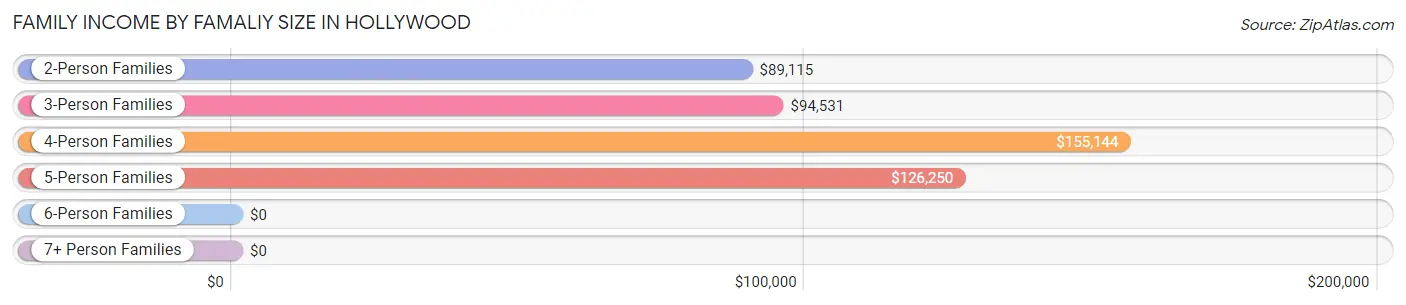
Family Income by Famaliy Size in Hollywood
4-person families (173 | 11.7%) account for the highest median family income in Hollywood with $155,144 per family, while 2-person families (827 | 56.1%) have the highest median income of $44,558 per family member.
| Income Bracket | # Families | Median Income |
| 2-Person Families | 827 (56.1%) | $89,115 |
| 3-Person Families | 246 (16.7%) | $94,531 |
| 4-Person Families | 173 (11.7%) | $155,144 |
| 5-Person Families | 214 (14.5%) | $126,250 |
| 6-Person Families | 13 (0.9%) | $0 |
| 7+ Person Families | 0 (0.0%) | $0 |
| Total | 1,473 (100.0%) | $101,453 |
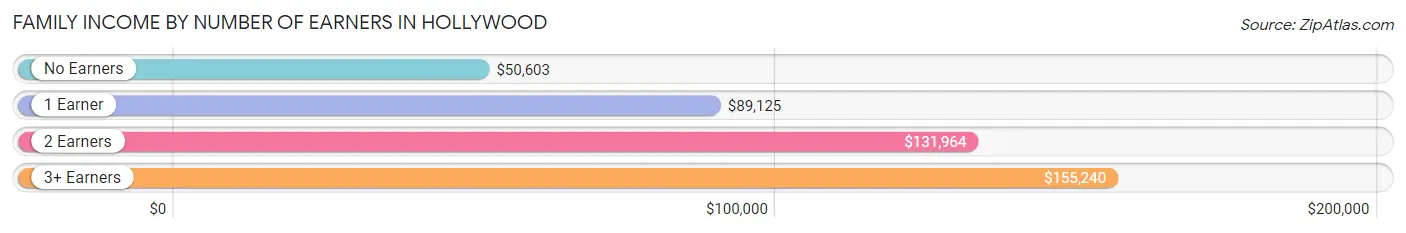
Family Income by Number of Earners in Hollywood
The median family income in Hollywood is $101,453, with families comprising 3+ earners (161) having the highest median family income of $155,240, while families with no earners (472) have the lowest median family income of $50,603, accounting for 10.9% and 32.0% of families, respectively.
| Number of Earners | # Families | Median Income |
| No Earners | 472 (32.0%) | $50,603 |
| 1 Earner | 323 (21.9%) | $89,125 |
| 2 Earners | 517 (35.1%) | $131,964 |
| 3+ Earners | 161 (10.9%) | $155,240 |
| Total | 1,473 (100.0%) | $101,453 |
Household Income in Hollywood
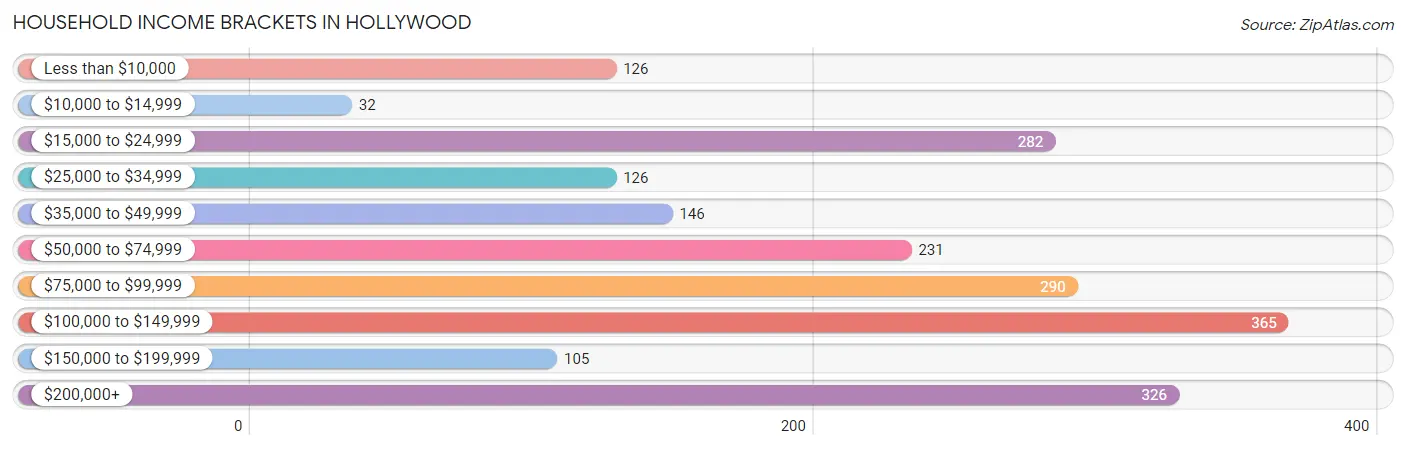
Household Income Brackets in Hollywood
With 365 households falling in the category, the $100,000 to $149,999 income range is the most frequent in Hollywood, accounting for 18.0% of all households. In contrast, only 32 households (1.6%) fall into the $10,000 to $14,999 income bracket, making it the least populous group.
| Income Bracket | # Households | % Households |
| Less than $10,000 | 126 | 6.2% |
| $10,000 to $14,999 | 32 | 1.6% |
| $15,000 to $24,999 | 282 | 13.9% |
| $25,000 to $34,999 | 126 | 6.2% |
| $35,000 to $49,999 | 146 | 7.2% |
| $50,000 to $74,999 | 231 | 11.4% |
| $75,000 to $99,999 | 290 | 14.3% |
| $100,000 to $149,999 | 365 | 18.0% |
| $150,000 to $199,999 | 105 | 5.2% |
| $200,000+ | 326 | 16.1% |
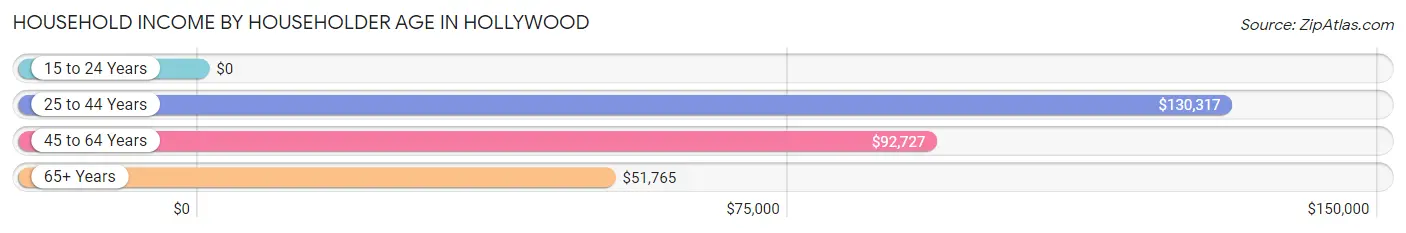
Household Income by Householder Age in Hollywood
The median household income in Hollywood is $77,191, with the highest median household income of $130,317 found in the 25 to 44 years age bracket for the primary householder. A total of 326 households (16.1%) fall into this category. Meanwhile, the 15 to 24 years age bracket for the primary householder has the lowest median household income of $0, with 12 households (0.6%) in this group.
| Income Bracket | # Households | Median Income |
| 15 to 24 Years | 12 (0.6%) | $0 |
| 25 to 44 Years | 326 (16.1%) | $130,317 |
| 45 to 64 Years | 854 (42.1%) | $92,727 |
| 65+ Years | 834 (41.2%) | $51,765 |
| Total | 2,026 (100.0%) | $77,191 |
Poverty in Hollywood
Income Below Poverty by Sex and Age in Hollywood
With 4.3% poverty level for males and 8.7% for females among the residents of Hollywood, 16 and 17 year old males and 16 and 17 year old females are the most vulnerable to poverty, with 10 males (15.4%) and 20 females (52.6%) in their respective age groups living below the poverty level.
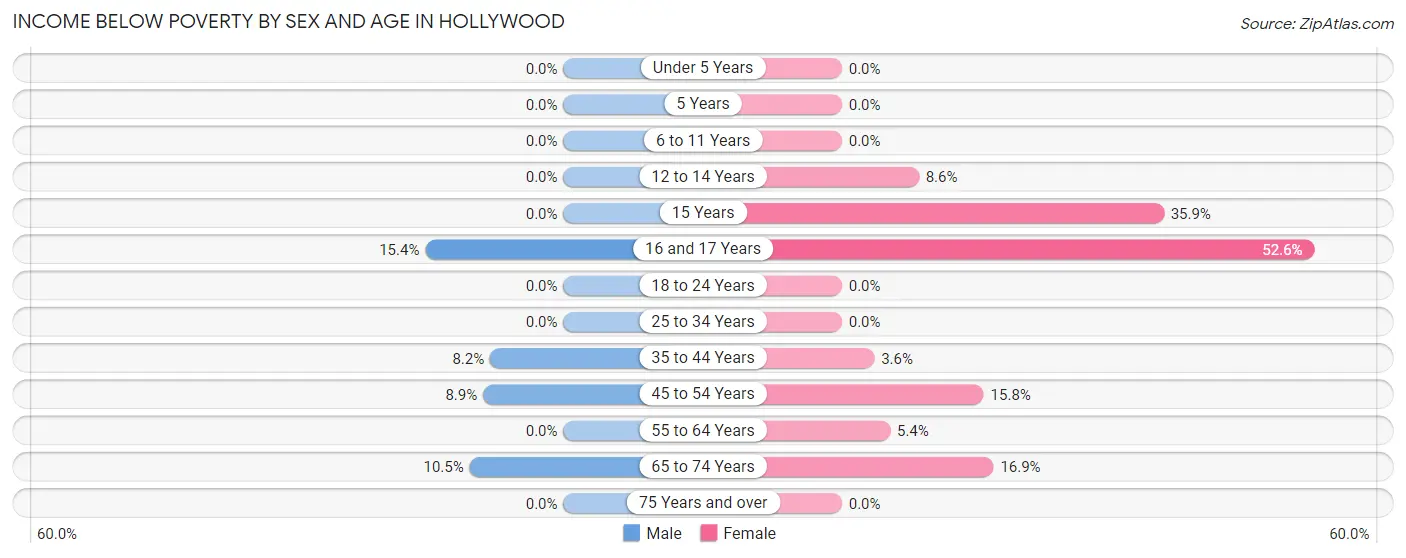
| Age Bracket | Male | Female |
| Under 5 Years | 0 (0.0%) | 0 (0.0%) |
| 5 Years | 0 (0.0%) | 0 (0.0%) |
| 6 to 11 Years | 0 (0.0%) | 0 (0.0%) |
| 12 to 14 Years | 0 (0.0%) | 9 (8.6%) |
| 15 Years | 0 (0.0%) | 19 (35.8%) |
| 16 and 17 Years | 10 (15.4%) | 20 (52.6%) |
| 18 to 24 Years | 0 (0.0%) | 0 (0.0%) |
| 25 to 34 Years | 0 (0.0%) | 0 (0.0%) |
| 35 to 44 Years | 20 (8.2%) | 9 (3.6%) |
| 45 to 54 Years | 37 (8.9%) | 64 (15.8%) |
| 55 to 64 Years | 0 (0.0%) | 26 (5.4%) |
| 65 to 74 Years | 46 (10.4%) | 90 (16.9%) |
| 75 Years and over | 0 (0.0%) | 0 (0.0%) |
| Total | 113 (4.3%) | 237 (8.7%) |
Income Above Poverty by Sex and Age in Hollywood
According to the poverty statistics in Hollywood, males aged under 5 years and females aged under 5 years are the age groups that are most secure financially, with 100.0% of males and 100.0% of females in these age groups living above the poverty line.
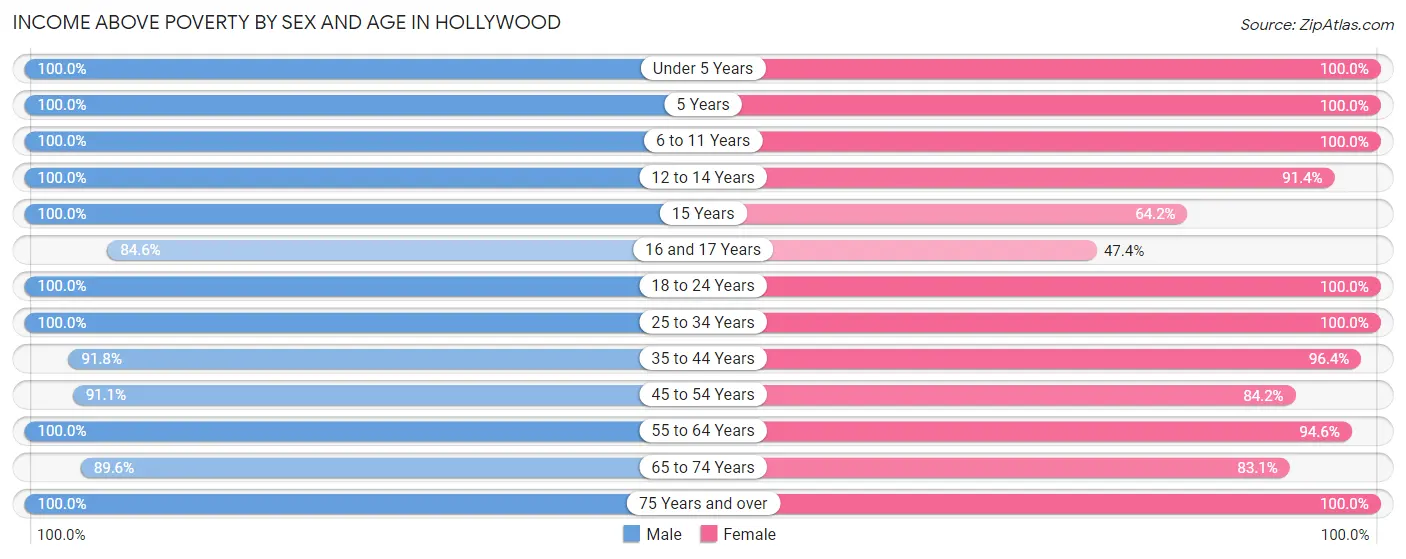
| Age Bracket | Male | Female |
| Under 5 Years | 128 (100.0%) | 166 (100.0%) |
| 5 Years | 12 (100.0%) | 17 (100.0%) |
| 6 to 11 Years | 57 (100.0%) | 155 (100.0%) |
| 12 to 14 Years | 87 (100.0%) | 96 (91.4%) |
| 15 Years | 51 (100.0%) | 34 (64.1%) |
| 16 and 17 Years | 55 (84.6%) | 18 (47.4%) |
| 18 to 24 Years | 47 (100.0%) | 113 (100.0%) |
| 25 to 34 Years | 380 (100.0%) | 267 (100.0%) |
| 35 to 44 Years | 225 (91.8%) | 240 (96.4%) |
| 45 to 54 Years | 377 (91.1%) | 341 (84.2%) |
| 55 to 64 Years | 533 (100.0%) | 458 (94.6%) |
| 65 to 74 Years | 394 (89.5%) | 443 (83.1%) |
| 75 Years and over | 186 (100.0%) | 148 (100.0%) |
| Total | 2,532 (95.7%) | 2,496 (91.3%) |
Income Below Poverty Among Married-Couple Families in Hollywood
The poverty statistics for married-couple families in Hollywood show that 4.0% or 45 of the total 1,127 families live below the poverty line. Families with no children have the highest poverty rate of 5.4%, comprising of 45 families. On the other hand, families with 1 or 2 children have the lowest poverty rate of 0.0%, which includes 0 families.
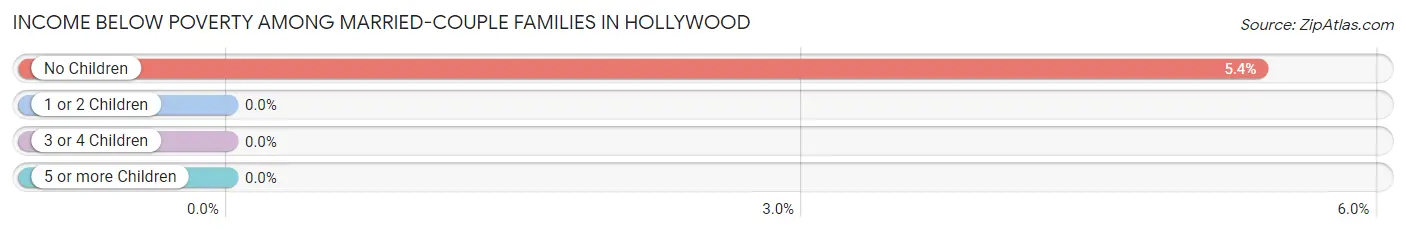
| Children | Above Poverty | Below Poverty |
| No Children | 791 (94.6%) | 45 (5.4%) |
| 1 or 2 Children | 133 (100.0%) | 0 (0.0%) |
| 3 or 4 Children | 158 (100.0%) | 0 (0.0%) |
| 5 or more Children | 0 (0.0%) | 0 (0.0%) |
| Total | 1,082 (96.0%) | 45 (4.0%) |
Income Below Poverty Among Single-Parent Households in Hollywood
According to the poverty data in Hollywood, 16.1% or 20 single-father households and 26.1% or 58 single-mother households are living below the poverty line. Among single-father households, those with 1 or 2 children have the highest poverty rate, with 20 households (34.5%) experiencing poverty. Likewise, among single-mother households, those with 1 or 2 children have the highest poverty rate, with 28 households (50.0%) falling below the poverty line.
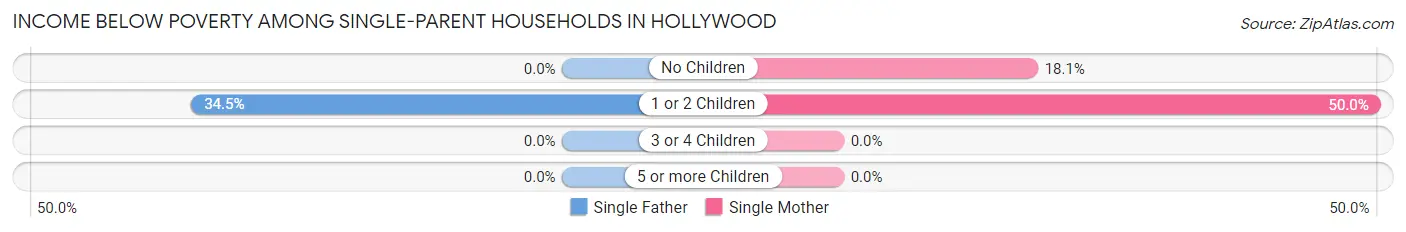
| Children | Single Father | Single Mother |
| No Children | 0 (0.0%) | 30 (18.1%) |
| 1 or 2 Children | 20 (34.5%) | 28 (50.0%) |
| 3 or 4 Children | 0 (0.0%) | 0 (0.0%) |
| 5 or more Children | 0 (0.0%) | 0 (0.0%) |
| Total | 20 (16.1%) | 58 (26.1%) |
Income Below Poverty Among Married-Couple vs Single-Parent Households in Hollywood
The poverty data for Hollywood shows that 45 of the married-couple family households (4.0%) and 78 of the single-parent households (22.5%) are living below the poverty level. Within the married-couple family households, those with no children have the highest poverty rate, with 45 households (5.4%) falling below the poverty line. Among the single-parent households, those with 1 or 2 children have the highest poverty rate, with 48 household (42.1%) living below poverty.
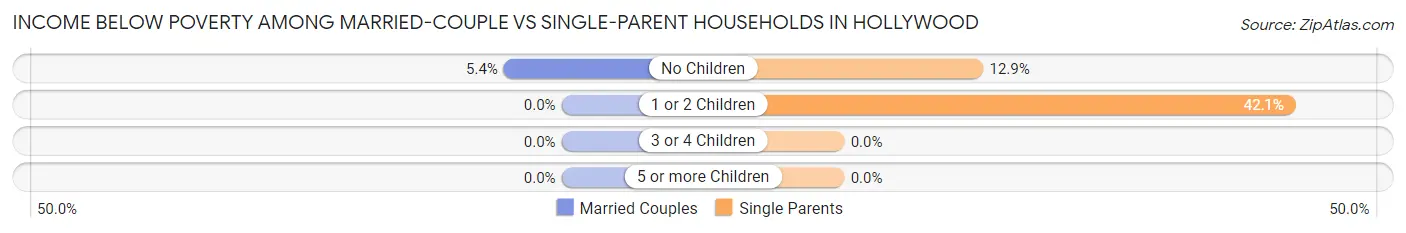
| Children | Married-Couple Families | Single-Parent Households |
| No Children | 45 (5.4%) | 30 (12.9%) |
| 1 or 2 Children | 0 (0.0%) | 48 (42.1%) |
| 3 or 4 Children | 0 (0.0%) | 0 (0.0%) |
| 5 or more Children | 0 (0.0%) | 0 (0.0%) |
| Total | 45 (4.0%) | 78 (22.5%) |
Race in Hollywood
The most populous races in Hollywood are White / Caucasian (3,216 | 59.6%), Black / African American (1,913 | 35.4%), and Two or more Races (173 | 3.2%).
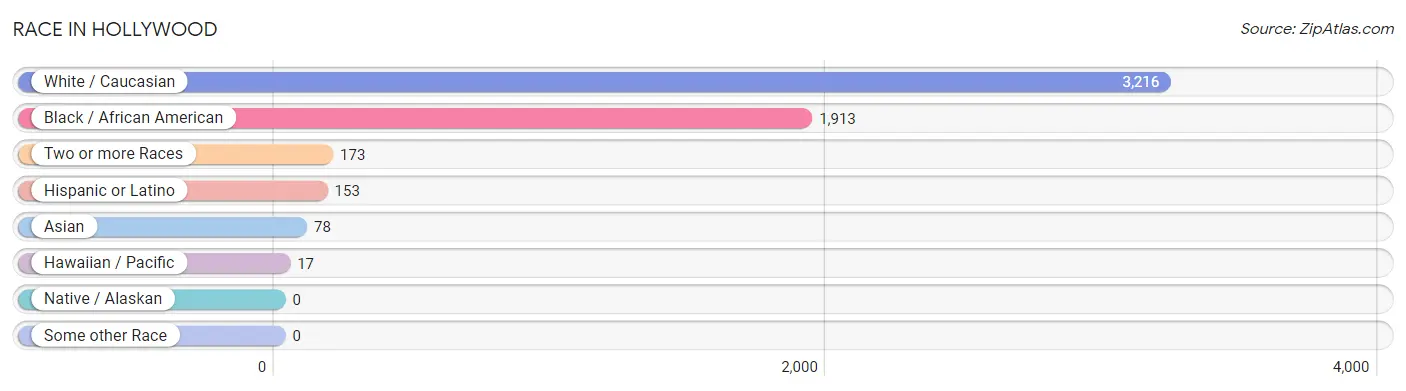
| Race | # Population | % Population |
| Asian | 78 | 1.5% |
| Black / African American | 1,913 | 35.4% |
| Hawaiian / Pacific | 17 | 0.3% |
| Hispanic or Latino | 153 | 2.8% |
| Native / Alaskan | 0 | 0.0% |
| White / Caucasian | 3,216 | 59.6% |
| Two or more Races | 173 | 3.2% |
| Some other Race | 0 | 0.0% |
| Total | 5,397 | 100.0% |
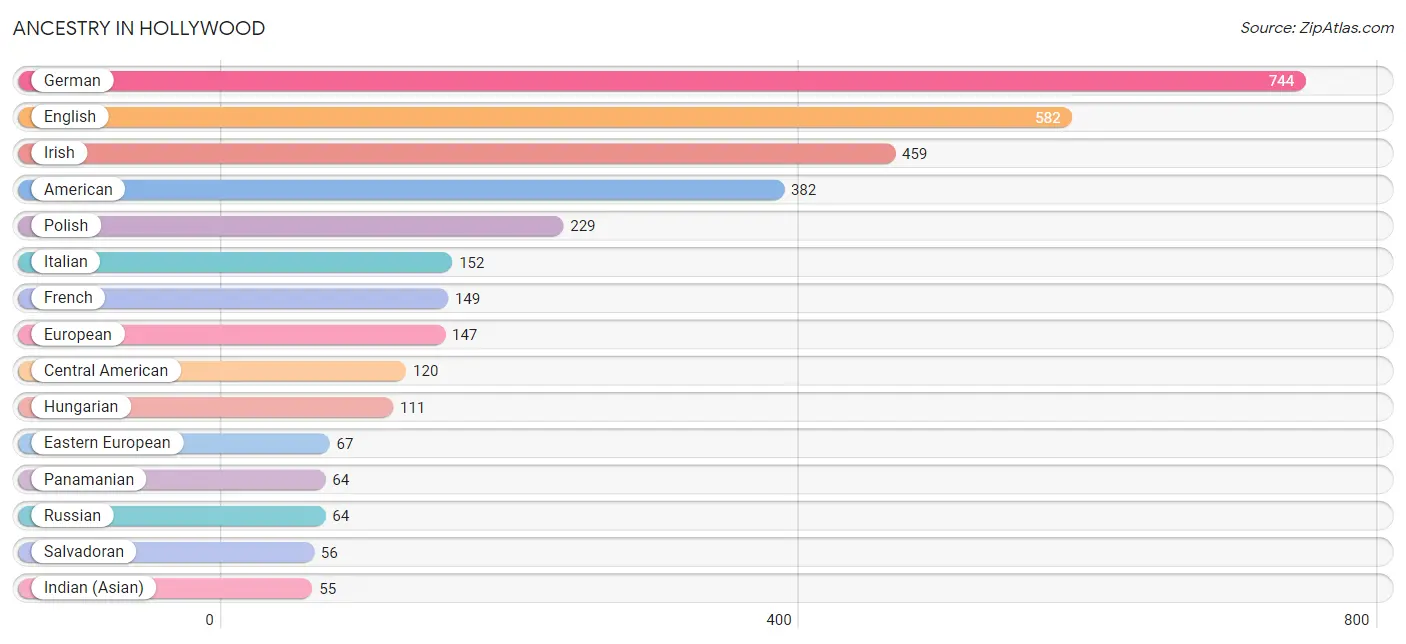
Ancestry in Hollywood
The most populous ancestries reported in Hollywood are German (744 | 13.8%), English (582 | 10.8%), Irish (459 | 8.5%), American (382 | 7.1%), and Polish (229 | 4.2%), together accounting for 44.4% of all Hollywood residents.
| Ancestry | # Population | % Population |
| African | 41 | 0.8% |
| American | 382 | 7.1% |
| Bhutanese | 40 | 0.7% |
| British | 48 | 0.9% |
| Central American | 120 | 2.2% |
| Czech | 12 | 0.2% |
| Eastern European | 67 | 1.2% |
| English | 582 | 10.8% |
| European | 147 | 2.7% |
| French | 149 | 2.8% |
| French Canadian | 29 | 0.5% |
| German | 744 | 13.8% |
| Guamanian / Chamorro | 17 | 0.3% |
| Hungarian | 111 | 2.1% |
| Indian (Asian) | 55 | 1.0% |
| Irish | 459 | 8.5% |
| Italian | 152 | 2.8% |
| Korean | 31 | 0.6% |
| Lithuanian | 6 | 0.1% |
| Native Hawaiian | 40 | 0.7% |
| Northern European | 28 | 0.5% |
| Norwegian | 41 | 0.8% |
| Panamanian | 64 | 1.2% |
| Polish | 229 | 4.2% |
| Russian | 64 | 1.2% |
| Salvadoran | 56 | 1.0% |
| Scotch-Irish | 20 | 0.4% |
| Scottish | 43 | 0.8% |
| Sioux | 8 | 0.2% |
| Slavic | 14 | 0.3% |
| Slovak | 36 | 0.7% |
| South American | 15 | 0.3% |
| Subsaharan African | 41 | 0.8% |
| Swedish | 27 | 0.5% |
| Venezuelan | 15 | 0.3% | View All 35 Rows |
Immigrants in Hollywood
The most numerous immigrant groups reported in Hollywood came from Latin America (89 | 1.7%), Asia (78 | 1.5%), Central America (56 | 1.0%), El Salvador (56 | 1.0%), and China (55 | 1.0%), together accounting for 6.2% of all Hollywood residents.
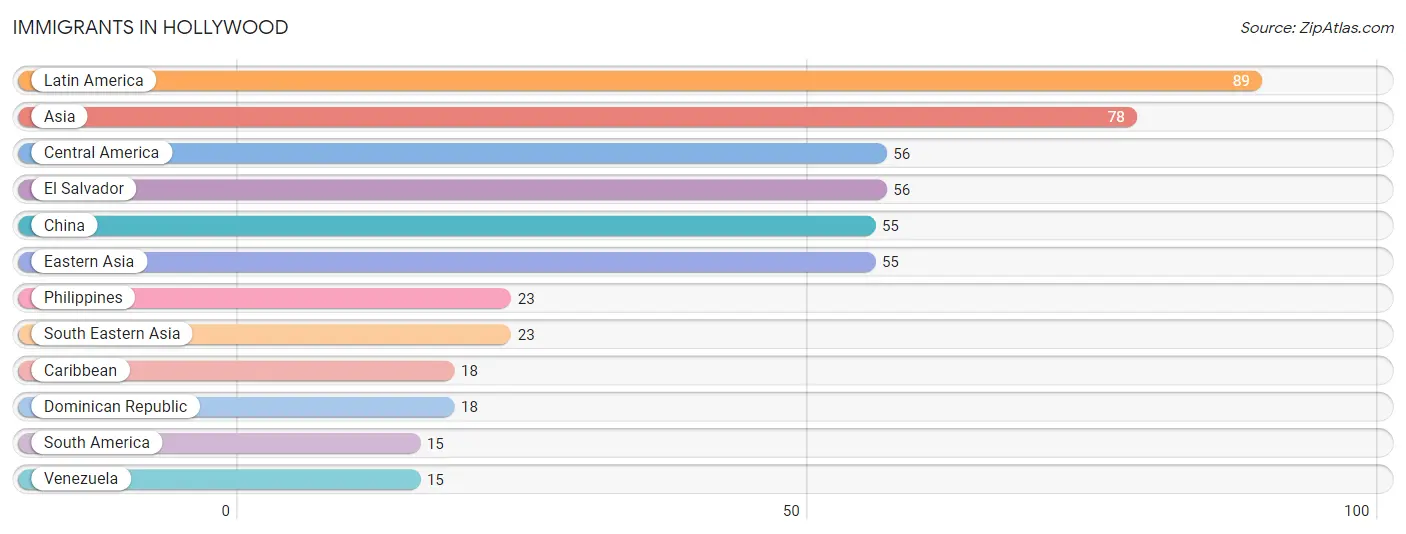
| Immigration Origin | # Population | % Population |
| Asia | 78 | 1.5% |
| Caribbean | 18 | 0.3% |
| Central America | 56 | 1.0% |
| China | 55 | 1.0% |
| Dominican Republic | 18 | 0.3% |
| Eastern Asia | 55 | 1.0% |
| El Salvador | 56 | 1.0% |
| Latin America | 89 | 1.7% |
| Philippines | 23 | 0.4% |
| South America | 15 | 0.3% |
| South Eastern Asia | 23 | 0.4% |
| Venezuela | 15 | 0.3% | View All 12 Rows |
Sex and Age in Hollywood
Sex and Age in Hollywood
The most populous age groups in Hollywood are 60 to 64 Years (316 | 11.9%) for men and 50 to 54 Years (317 | 11.6%) for women.
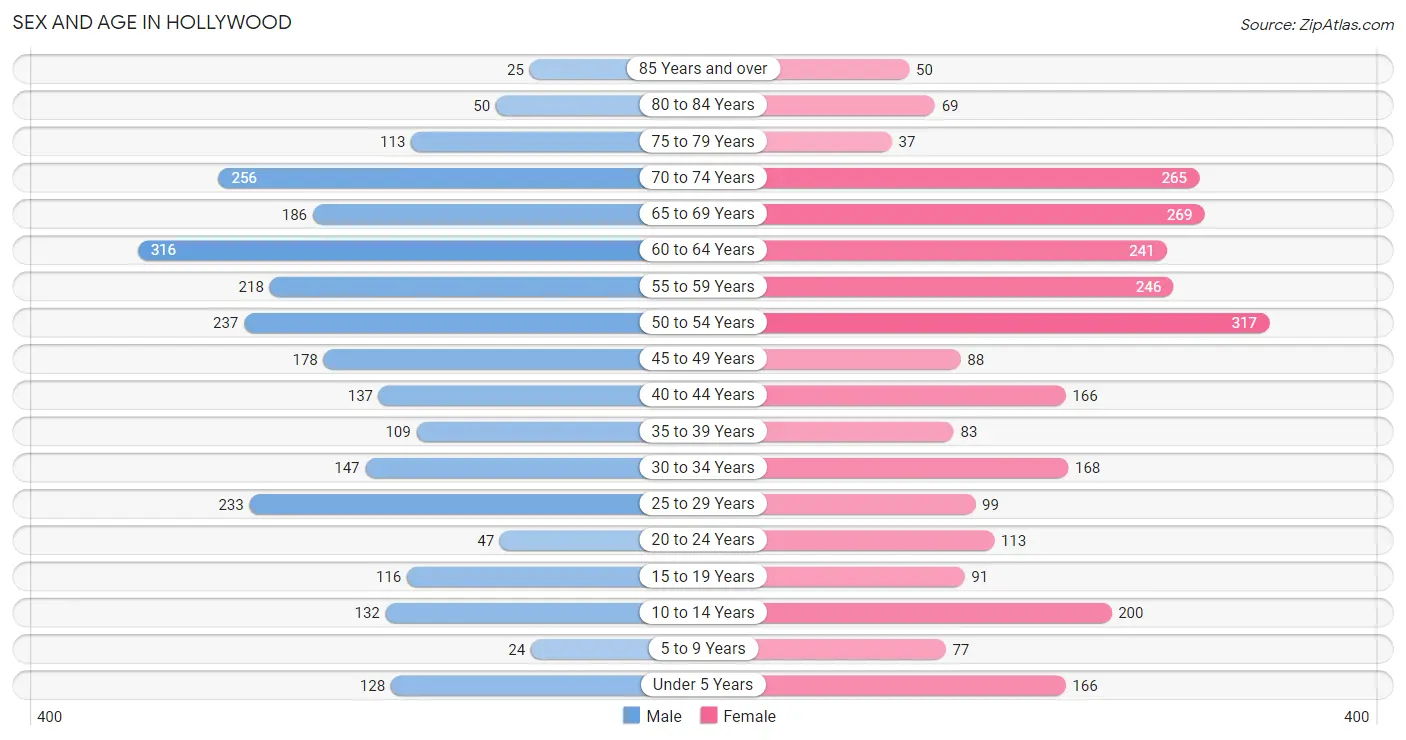
| Age Bracket | Male | Female |
| Under 5 Years | 128 (4.8%) | 166 (6.0%) |
| 5 to 9 Years | 24 (0.9%) | 77 (2.8%) |
| 10 to 14 Years | 132 (5.0%) | 200 (7.3%) |
| 15 to 19 Years | 116 (4.4%) | 91 (3.3%) |
| 20 to 24 Years | 47 (1.8%) | 113 (4.1%) |
| 25 to 29 Years | 233 (8.8%) | 99 (3.6%) |
| 30 to 34 Years | 147 (5.5%) | 168 (6.1%) |
| 35 to 39 Years | 109 (4.1%) | 83 (3.0%) |
| 40 to 44 Years | 137 (5.2%) | 166 (6.0%) |
| 45 to 49 Years | 178 (6.7%) | 88 (3.2%) |
| 50 to 54 Years | 237 (8.9%) | 317 (11.6%) |
| 55 to 59 Years | 218 (8.2%) | 246 (9.0%) |
| 60 to 64 Years | 316 (11.9%) | 241 (8.8%) |
| 65 to 69 Years | 186 (7.0%) | 269 (9.8%) |
| 70 to 74 Years | 256 (9.7%) | 265 (9.7%) |
| 75 to 79 Years | 113 (4.3%) | 37 (1.3%) |
| 80 to 84 Years | 50 (1.9%) | 69 (2.5%) |
| 85 Years and over | 25 (0.9%) | 50 (1.8%) |
| Total | 2,652 (100.0%) | 2,745 (100.0%) |
Families and Households in Hollywood
Median Family Size in Hollywood
The median family size in Hollywood is 3.20 persons per family, with single female/mother families (222 | 15.1%) accounting for the largest median family size of 4.27 persons per family. On the other hand, married-couple families (1,127 | 76.5%) represent the smallest median family size with 2.96 persons per family.
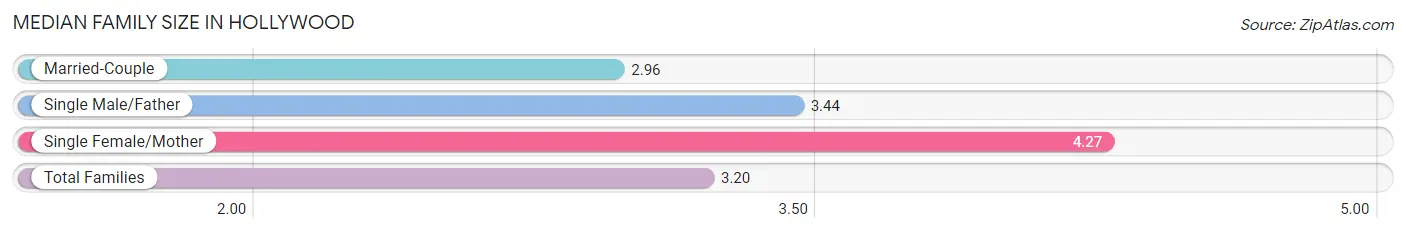
| Family Type | # Families | Family Size |
| Married-Couple | 1,127 (76.5%) | 2.96 |
| Single Male/Father | 124 (8.4%) | 3.44 |
| Single Female/Mother | 222 (15.1%) | 4.27 |
| Total Families | 1,473 (100.0%) | 3.20 |
Median Household Size in Hollywood
The median household size in Hollywood is 2.65 persons per household, with single female/mother households (222 | 11.0%) accounting for the largest median household size of 4.27 persons per household. non-family households (553 | 27.3%) represent the smallest median household size with 1.21 persons per household.
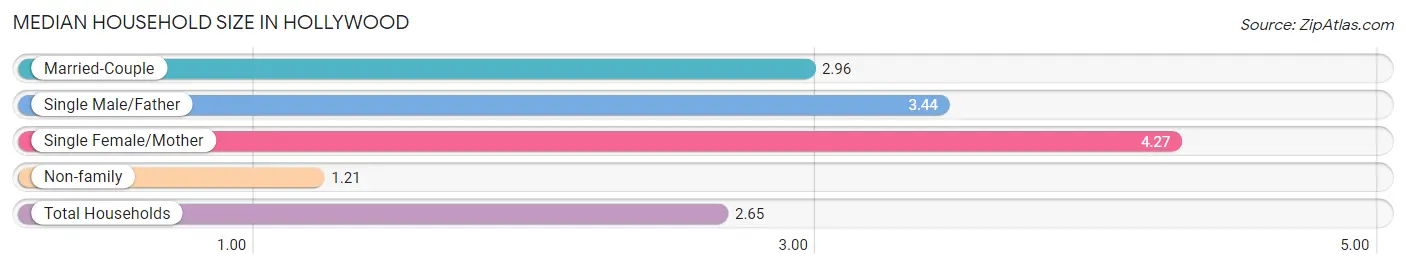
| Household Type | # Households | Household Size |
| Married-Couple | 1,127 (55.6%) | 2.96 |
| Single Male/Father | 124 (6.1%) | 3.44 |
| Single Female/Mother | 222 (11.0%) | 4.27 |
| Non-family | 553 (27.3%) | 1.21 |
| Total Households | 2,026 (100.0%) | 2.65 |
Household Size by Marriage Status in Hollywood
Out of a total of 2,026 households in Hollywood, 1,473 (72.7%) are family households, while 553 (27.3%) are nonfamily households. The most numerous type of family households are 2-person households, comprising 827, and the most common type of nonfamily households are 1-person households, comprising 460.
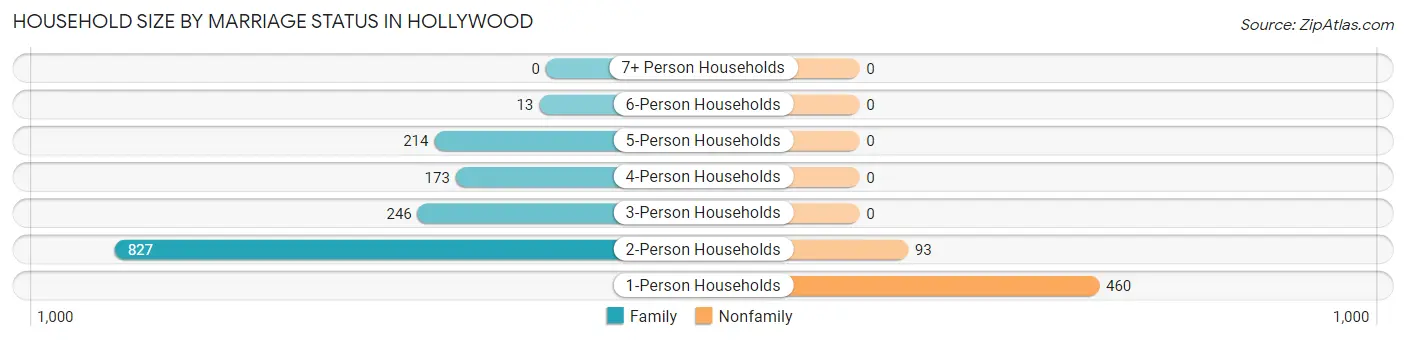
| Household Size | Family Households | Nonfamily Households |
| 1-Person Households | - | 460 (22.7%) |
| 2-Person Households | 827 (40.8%) | 93 (4.6%) |
| 3-Person Households | 246 (12.1%) | 0 (0.0%) |
| 4-Person Households | 173 (8.5%) | 0 (0.0%) |
| 5-Person Households | 214 (10.6%) | 0 (0.0%) |
| 6-Person Households | 13 (0.6%) | 0 (0.0%) |
| 7+ Person Households | 0 (0.0%) | 0 (0.0%) |
| Total | 1,473 (72.7%) | 553 (27.3%) |
Female Fertility in Hollywood
Fertility by Age in Hollywood
Average fertility rate in Hollywood is 75.0 births per 1,000 women. Women in the age bracket of 20 to 34 years have the highest fertility rate with 166.0 births per 1,000 women. Women in the age bracket of 20 to 34 years acount for 100.0% of all women with births.
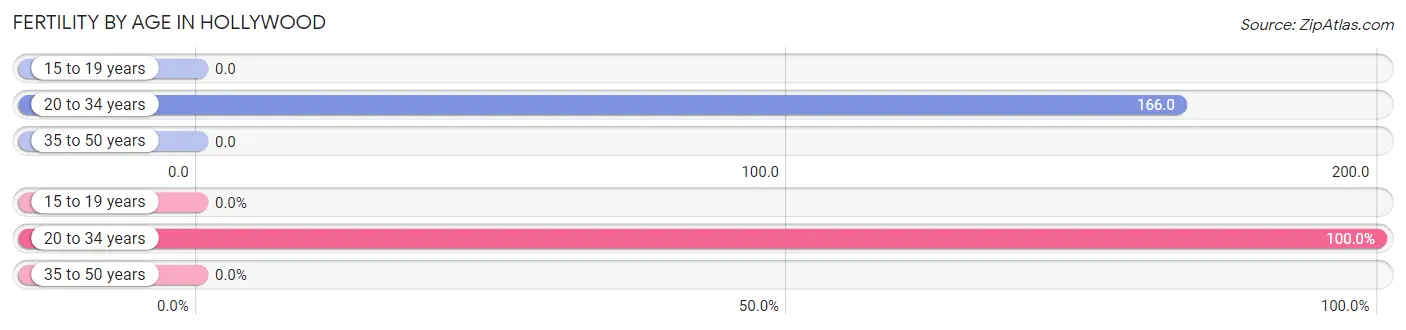
| Age Bracket | Women with Births | Births / 1,000 Women |
| 15 to 19 years | 0 (0.0%) | 0.0 |
| 20 to 34 years | 63 (100.0%) | 166.0 |
| 35 to 50 years | 0 (0.0%) | 0.0 |
| Total | 63 (100.0%) | 75.0 |
Fertility by Age by Marriage Status in Hollywood
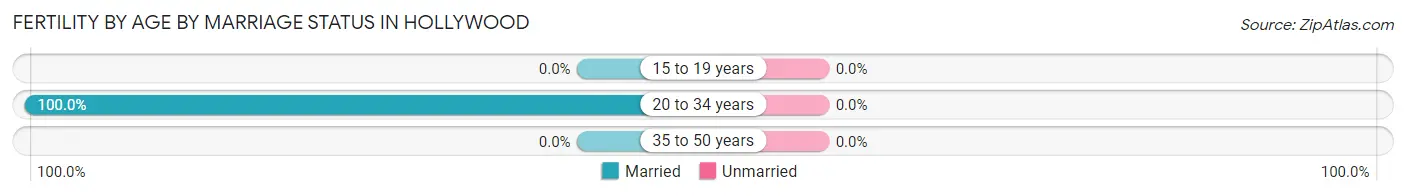
| Age Bracket | Married | Unmarried |
| 15 to 19 years | 0 (0.0%) | 0 (0.0%) |
| 20 to 34 years | 63 (100.0%) | 0 (0.0%) |
| 35 to 50 years | 0 (0.0%) | 0 (0.0%) |
| Total | 63 (100.0%) | 0 (0.0%) |
Fertility by Education in Hollywood
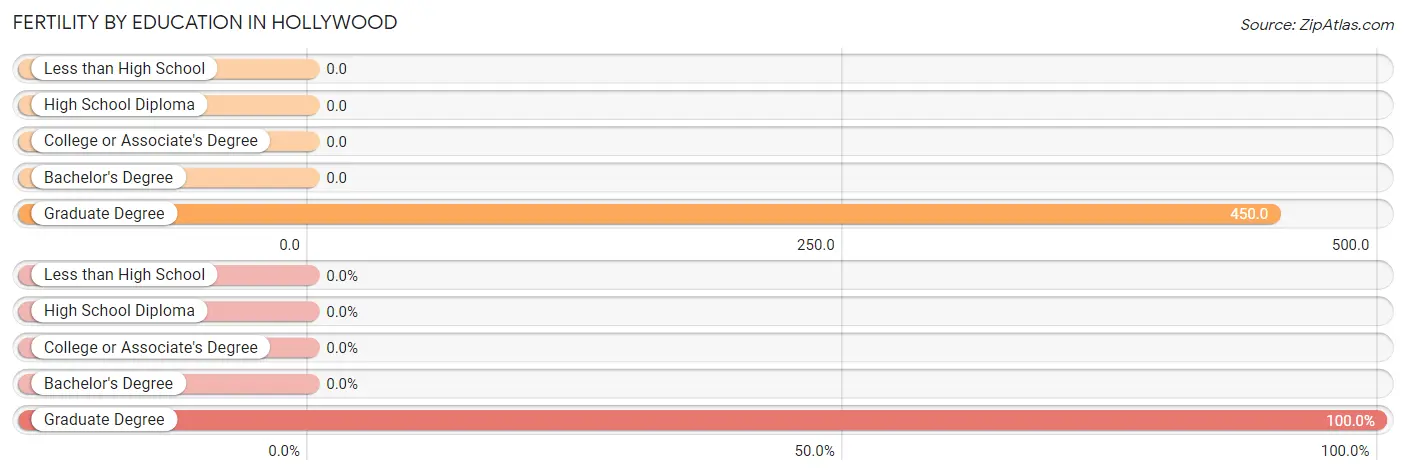
| Educational Attainment | Women with Births | Births / 1,000 Women |
| Less than High School | 0 (0.0%) | 0.0 |
| High School Diploma | 0 (0.0%) | 0.0 |
| College or Associate's Degree | 0 (0.0%) | 0.0 |
| Bachelor's Degree | 0 (0.0%) | 0.0 |
| Graduate Degree | 63 (100.0%) | 450.0 |
| Total | 63 (100.0%) | 75.0 |
Fertility by Education by Marriage Status in Hollywood
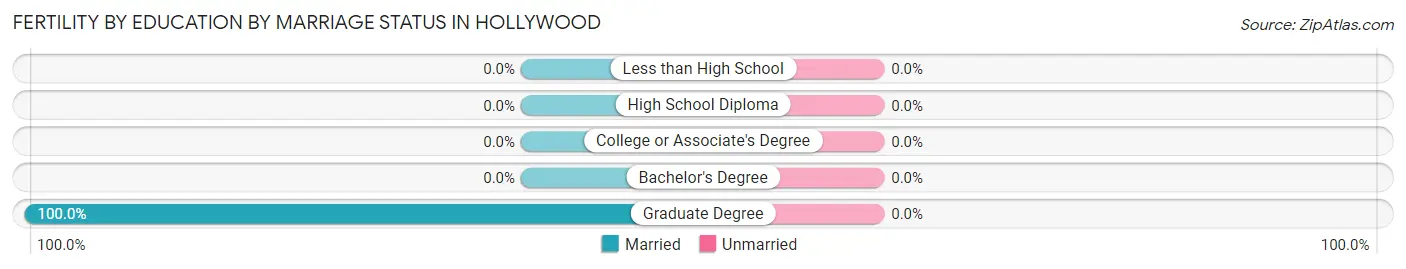
| Educational Attainment | Married | Unmarried |
| Less than High School | 0 (0.0%) | 0 (0.0%) |
| High School Diploma | 0 (0.0%) | 0 (0.0%) |
| College or Associate's Degree | 0 (0.0%) | 0 (0.0%) |
| Bachelor's Degree | 0 (0.0%) | 0 (0.0%) |
| Graduate Degree | 63 (100.0%) | 0 (0.0%) |
| Total | 63 (100.0%) | 0 (0.0%) |
Employment Characteristics in Hollywood
Employment by Class of Employer in Hollywood
Among the 2,300 employed individuals in Hollywood, private company employees (1,399 | 60.8%), self-employed (incorporated) (234 | 10.2%), and local government employees (229 | 10.0%) make up the most common classes of employment.
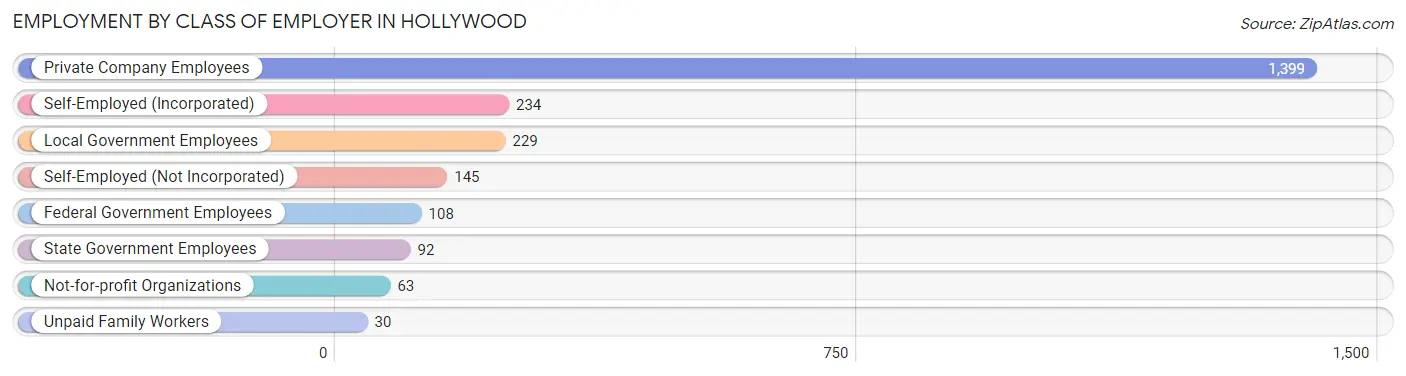
| Employer Class | # Employees | % Employees |
| Private Company Employees | 1,399 | 60.8% |
| Self-Employed (Incorporated) | 234 | 10.2% |
| Self-Employed (Not Incorporated) | 145 | 6.3% |
| Not-for-profit Organizations | 63 | 2.7% |
| Local Government Employees | 229 | 10.0% |
| State Government Employees | 92 | 4.0% |
| Federal Government Employees | 108 | 4.7% |
| Unpaid Family Workers | 30 | 1.3% |
| Total | 2,300 | 100.0% |
Employment Status by Age in Hollywood
According to the labor force statistics for Hollywood, out of the total population over 16 years of age (4,566), 55.7% or 2,543 individuals are in the labor force, with 4.8% or 122 of them unemployed. The age group with the highest labor force participation rate is 25 to 29 years, with 93.4% or 310 individuals in the labor force. Within the labor force, the 45 to 54 years age range has the highest percentage of unemployed individuals, with 14.2% or 96 of them being unemployed.
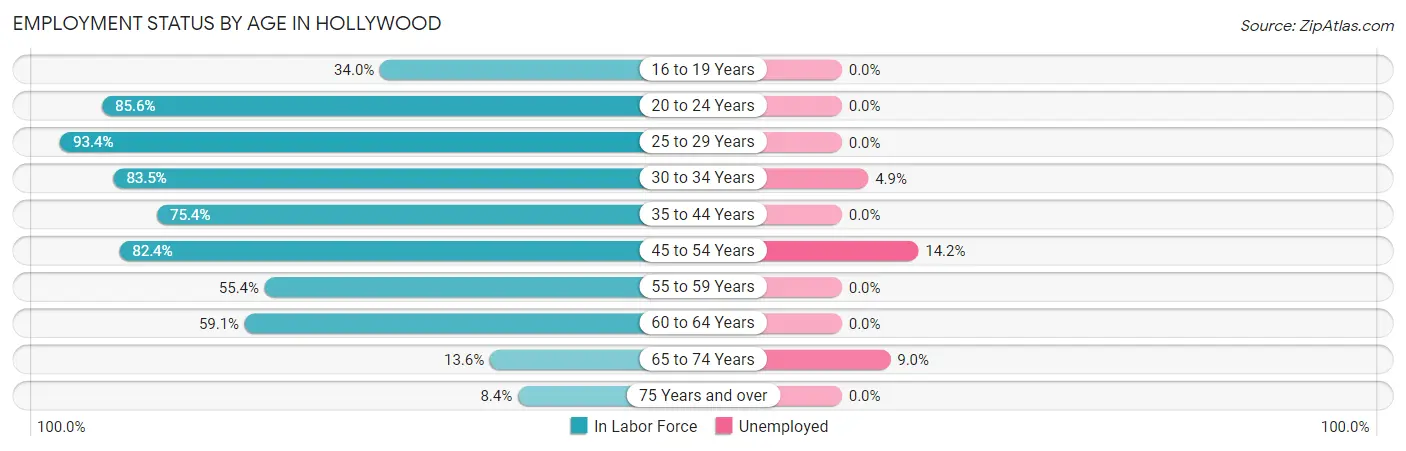
| Age Bracket | In Labor Force | Unemployed |
| 16 to 19 Years | 35 (34.0%) | 0 (0.0%) |
| 20 to 24 Years | 137 (85.6%) | 0 (0.0%) |
| 25 to 29 Years | 310 (93.4%) | 0 (0.0%) |
| 30 to 34 Years | 263 (83.5%) | 13 (4.9%) |
| 35 to 44 Years | 373 (75.4%) | 0 (0.0%) |
| 45 to 54 Years | 676 (82.4%) | 96 (14.2%) |
| 55 to 59 Years | 257 (55.4%) | 0 (0.0%) |
| 60 to 64 Years | 329 (59.1%) | 0 (0.0%) |
| 65 to 74 Years | 133 (13.6%) | 12 (9.0%) |
| 75 Years and over | 29 (8.4%) | 0 (0.0%) |
| Total | 2,543 (55.7%) | 122 (4.8%) |
Employment Status by Educational Attainment in Hollywood
According to labor force statistics for Hollywood, 74.0% of individuals (2,207) out of the total population between 25 and 64 years of age (2,983) are in the labor force, with 4.9% or 108 of them being unemployed. The group with the highest labor force participation rate are those with the educational attainment of bachelor's degree or higher, with 80.3% or 848 individuals in the labor force. Within the labor force, individuals with high school diploma education have the highest percentage of unemployment, with 18.6% or 109 of them being unemployed.
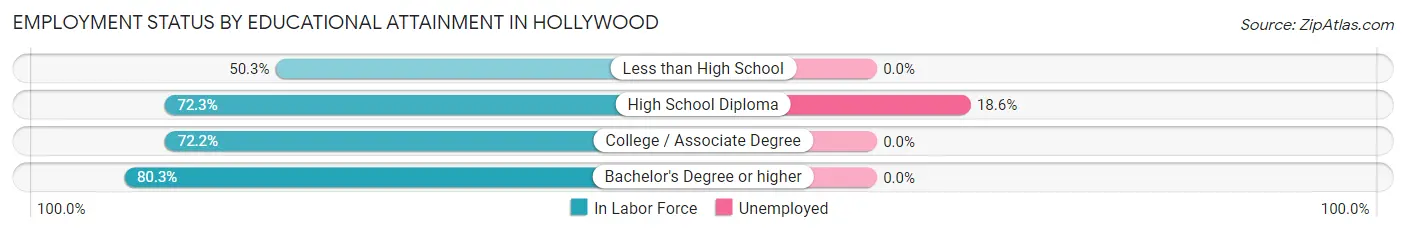
| Educational Attainment | In Labor Force | Unemployed |
| Less than High School | 74 (50.3%) | 0 (0.0%) |
| High School Diploma | 585 (72.3%) | 150 (18.6%) |
| College / Associate Degree | 701 (72.2%) | 0 (0.0%) |
| Bachelor's Degree or higher | 848 (80.3%) | 0 (0.0%) |
| Total | 2,207 (74.0%) | 146 (4.9%) |
Employment Occupations by Sex in Hollywood
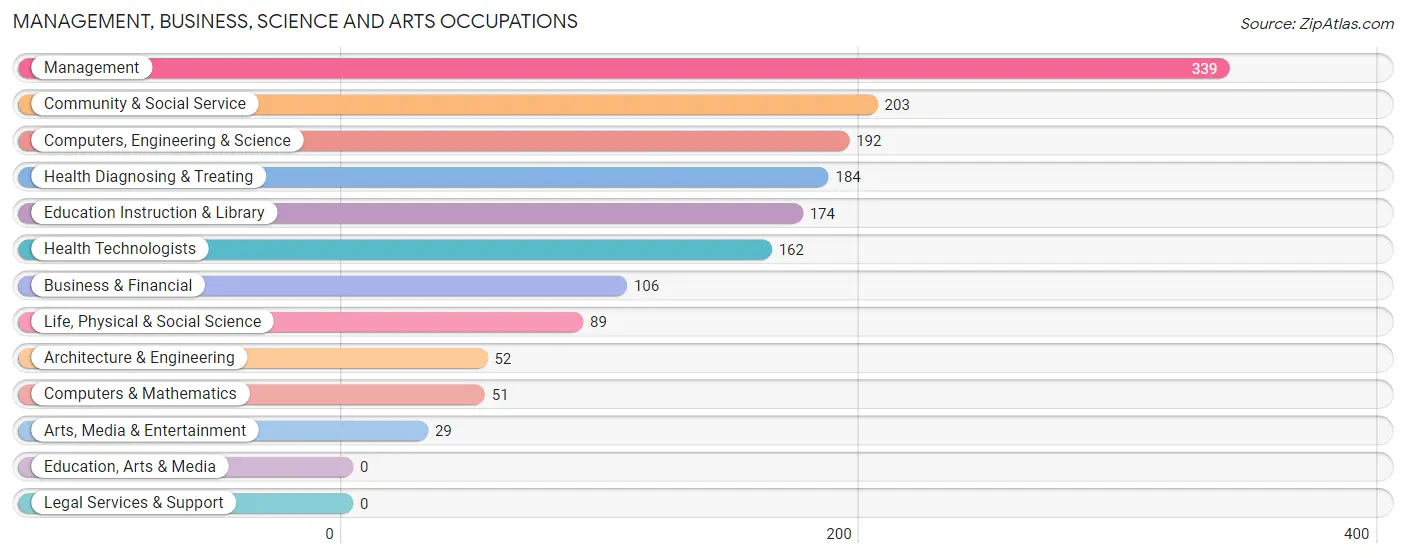
Management, Business, Science and Arts Occupations
The most common Management, Business, Science and Arts occupations in Hollywood are Management (339 | 14.0%), Community & Social Service (203 | 8.4%), Computers, Engineering & Science (192 | 7.9%), Health Diagnosing & Treating (184 | 7.6%), and Education Instruction & Library (174 | 7.2%).
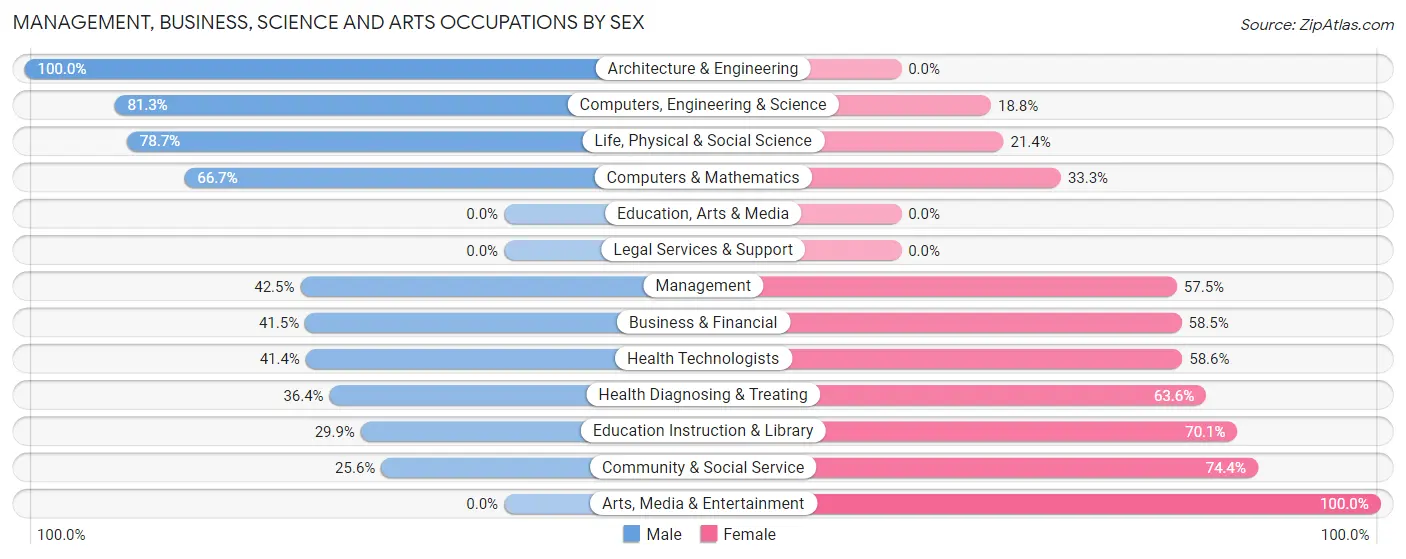
Management, Business, Science and Arts Occupations by Sex
Within the Management, Business, Science and Arts occupations in Hollywood, the most male-oriented occupations are Architecture & Engineering (100.0%), Computers, Engineering & Science (81.2%), and Life, Physical & Social Science (78.6%), while the most female-oriented occupations are Arts, Media & Entertainment (100.0%), Community & Social Service (74.4%), and Education Instruction & Library (70.1%).
| Occupation | Male | Female |
| Management | 144 (42.5%) | 195 (57.5%) |
| Business & Financial | 44 (41.5%) | 62 (58.5%) |
| Computers, Engineering & Science | 156 (81.2%) | 36 (18.8%) |
| Computers & Mathematics | 34 (66.7%) | 17 (33.3%) |
| Architecture & Engineering | 52 (100.0%) | 0 (0.0%) |
| Life, Physical & Social Science | 70 (78.6%) | 19 (21.3%) |
| Community & Social Service | 52 (25.6%) | 151 (74.4%) |
| Education, Arts & Media | 0 (0.0%) | 0 (0.0%) |
| Legal Services & Support | 0 (0.0%) | 0 (0.0%) |
| Education Instruction & Library | 52 (29.9%) | 122 (70.1%) |
| Arts, Media & Entertainment | 0 (0.0%) | 29 (100.0%) |
| Health Diagnosing & Treating | 67 (36.4%) | 117 (63.6%) |
| Health Technologists | 67 (41.4%) | 95 (58.6%) |
| Total (Category) | 463 (45.2%) | 561 (54.8%) |
| Total (Overall) | 1,280 (52.9%) | 1,141 (47.1%) |
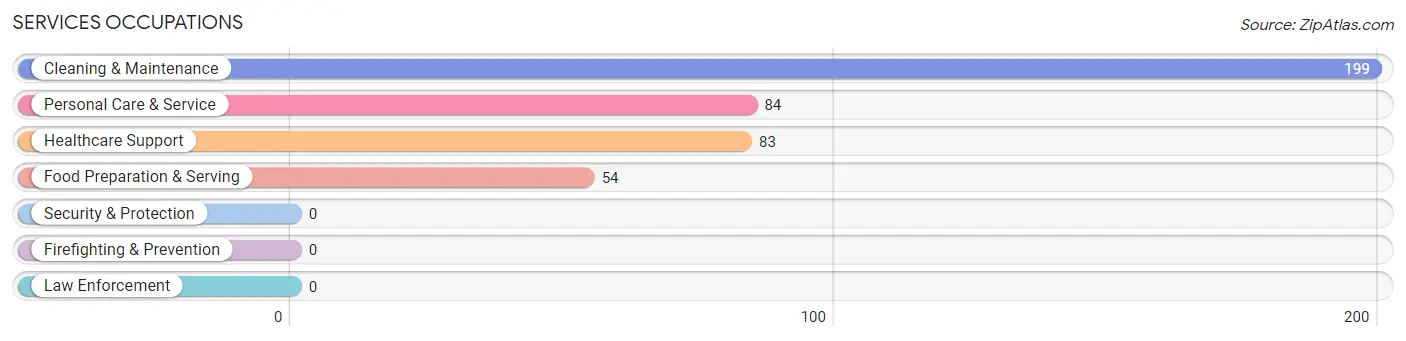
Services Occupations
The most common Services occupations in Hollywood are Cleaning & Maintenance (199 | 8.2%), Personal Care & Service (84 | 3.5%), Healthcare Support (83 | 3.4%), and Food Preparation & Serving (54 | 2.2%).
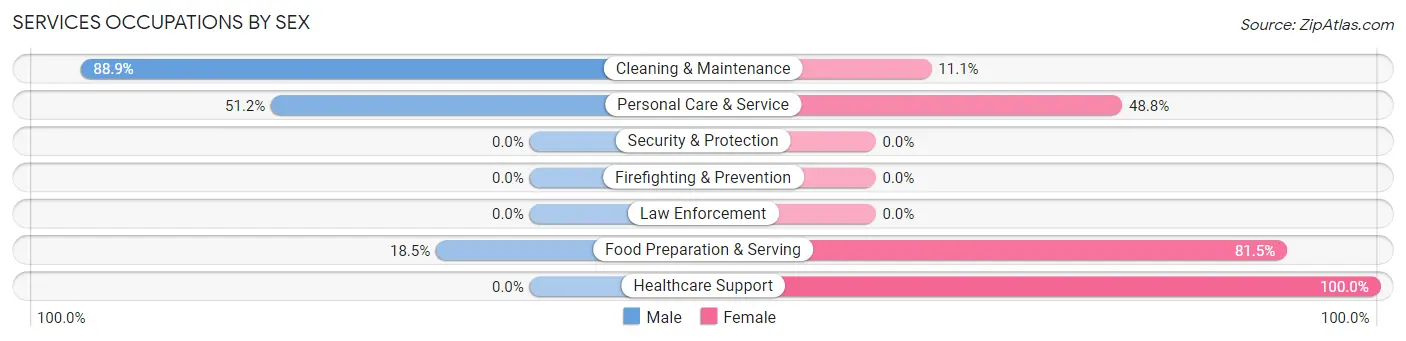
Services Occupations by Sex
Within the Services occupations in Hollywood, the most male-oriented occupations are Cleaning & Maintenance (88.9%), Personal Care & Service (51.2%), and Food Preparation & Serving (18.5%), while the most female-oriented occupations are Healthcare Support (100.0%), Food Preparation & Serving (81.5%), and Personal Care & Service (48.8%).
| Occupation | Male | Female |
| Healthcare Support | 0 (0.0%) | 83 (100.0%) |
| Security & Protection | 0 (0.0%) | 0 (0.0%) |
| Firefighting & Prevention | 0 (0.0%) | 0 (0.0%) |
| Law Enforcement | 0 (0.0%) | 0 (0.0%) |
| Food Preparation & Serving | 10 (18.5%) | 44 (81.5%) |
| Cleaning & Maintenance | 177 (88.9%) | 22 (11.1%) |
| Personal Care & Service | 43 (51.2%) | 41 (48.8%) |
| Total (Category) | 230 (54.8%) | 190 (45.2%) |
| Total (Overall) | 1,280 (52.9%) | 1,141 (47.1%) |
Sales and Office Occupations
The most common Sales and Office occupations in Hollywood are Office & Administration (323 | 13.3%), and Sales & Related (129 | 5.3%).

Sales and Office Occupations by Sex
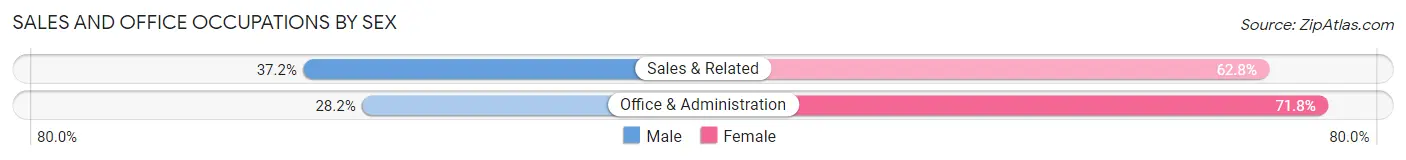
| Occupation | Male | Female |
| Sales & Related | 48 (37.2%) | 81 (62.8%) |
| Office & Administration | 91 (28.2%) | 232 (71.8%) |
| Total (Category) | 139 (30.7%) | 313 (69.3%) |
| Total (Overall) | 1,280 (52.9%) | 1,141 (47.1%) |
Natural Resources, Construction and Maintenance Occupations
The most common Natural Resources, Construction and Maintenance occupations in Hollywood are Construction & Extraction (188 | 7.8%), Installation, Maintenance & Repair (72 | 3.0%), and Farming, Fishing & Forestry (8 | 0.3%).
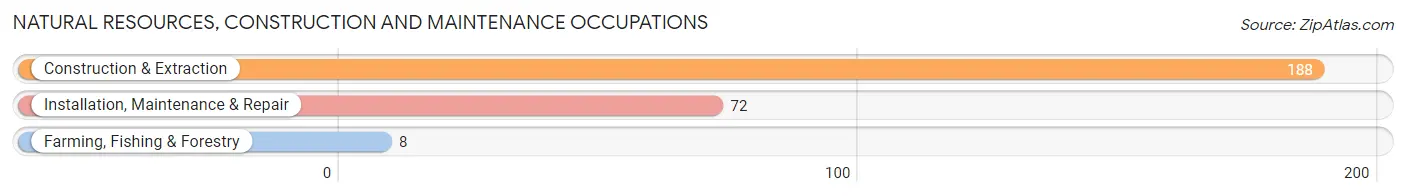
Natural Resources, Construction and Maintenance Occupations by Sex

| Occupation | Male | Female |
| Farming, Fishing & Forestry | 8 (100.0%) | 0 (0.0%) |
| Construction & Extraction | 149 (79.3%) | 39 (20.7%) |
| Installation, Maintenance & Repair | 72 (100.0%) | 0 (0.0%) |
| Total (Category) | 229 (85.5%) | 39 (14.5%) |
| Total (Overall) | 1,280 (52.9%) | 1,141 (47.1%) |
Production, Transportation and Moving Occupations
The most common Production, Transportation and Moving occupations in Hollywood are Production (131 | 5.4%), Transportation (63 | 2.6%), and Material Moving (63 | 2.6%).
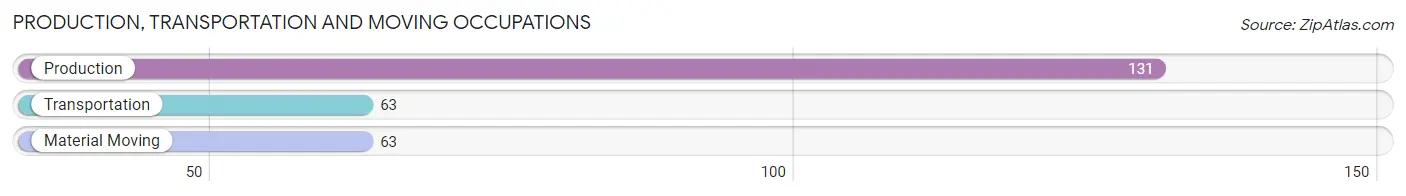
Production, Transportation and Moving Occupations by Sex
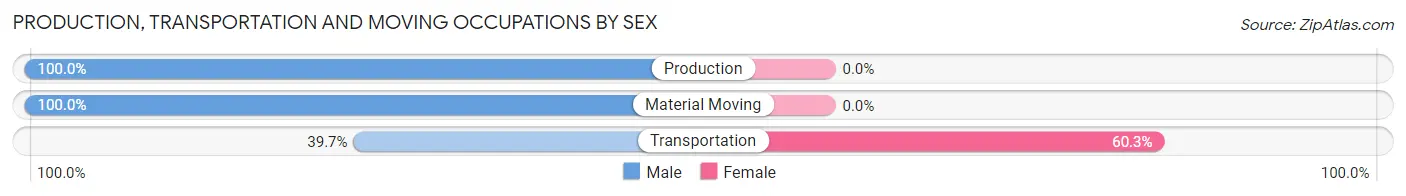
| Occupation | Male | Female |
| Production | 131 (100.0%) | 0 (0.0%) |
| Transportation | 25 (39.7%) | 38 (60.3%) |
| Material Moving | 63 (100.0%) | 0 (0.0%) |
| Total (Category) | 219 (85.2%) | 38 (14.8%) |
| Total (Overall) | 1,280 (52.9%) | 1,141 (47.1%) |
Employment Industries by Sex in Hollywood
Employment Industries in Hollywood
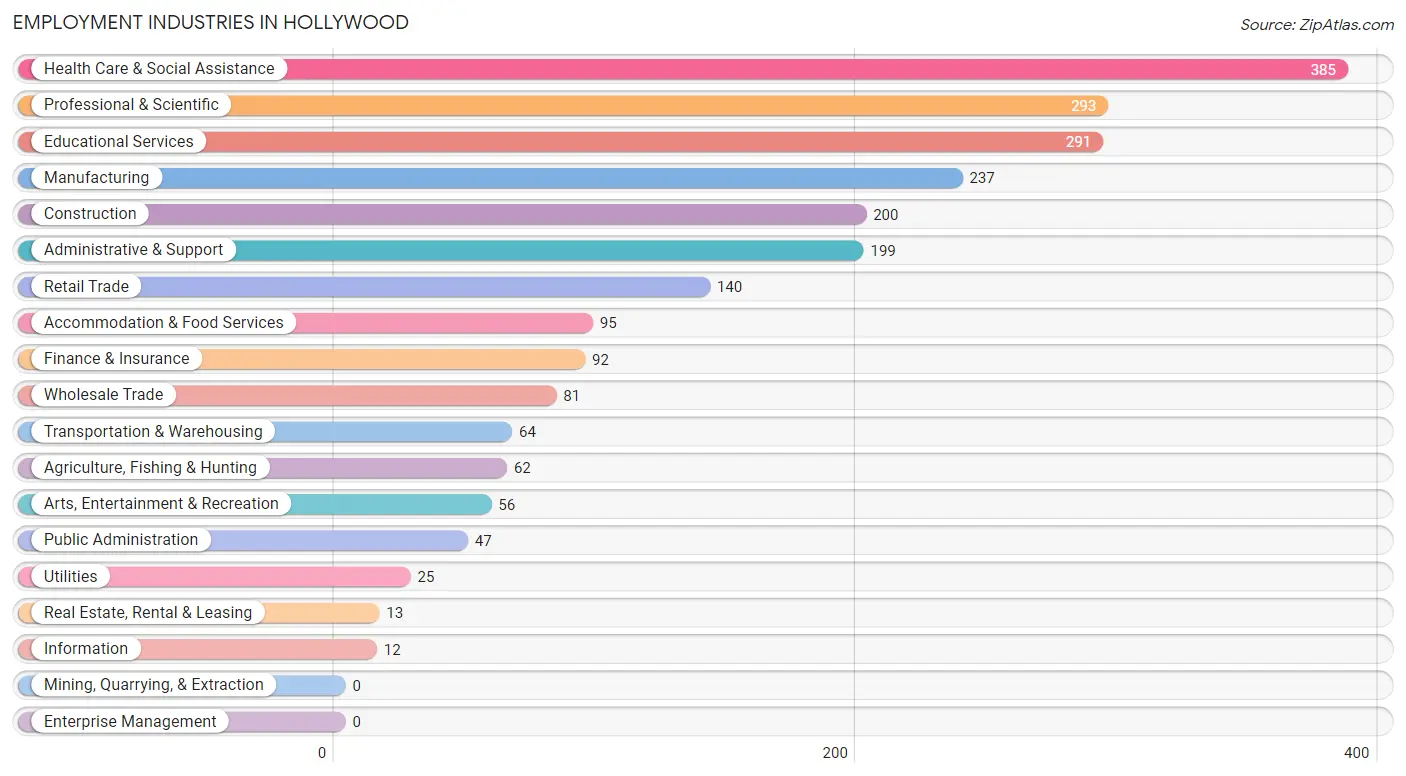
The major employment industries in Hollywood include Health Care & Social Assistance (385 | 15.9%), Professional & Scientific (293 | 12.1%), Educational Services (291 | 12.0%), Manufacturing (237 | 9.8%), and Construction (200 | 8.3%).
Employment Industries by Sex in Hollywood
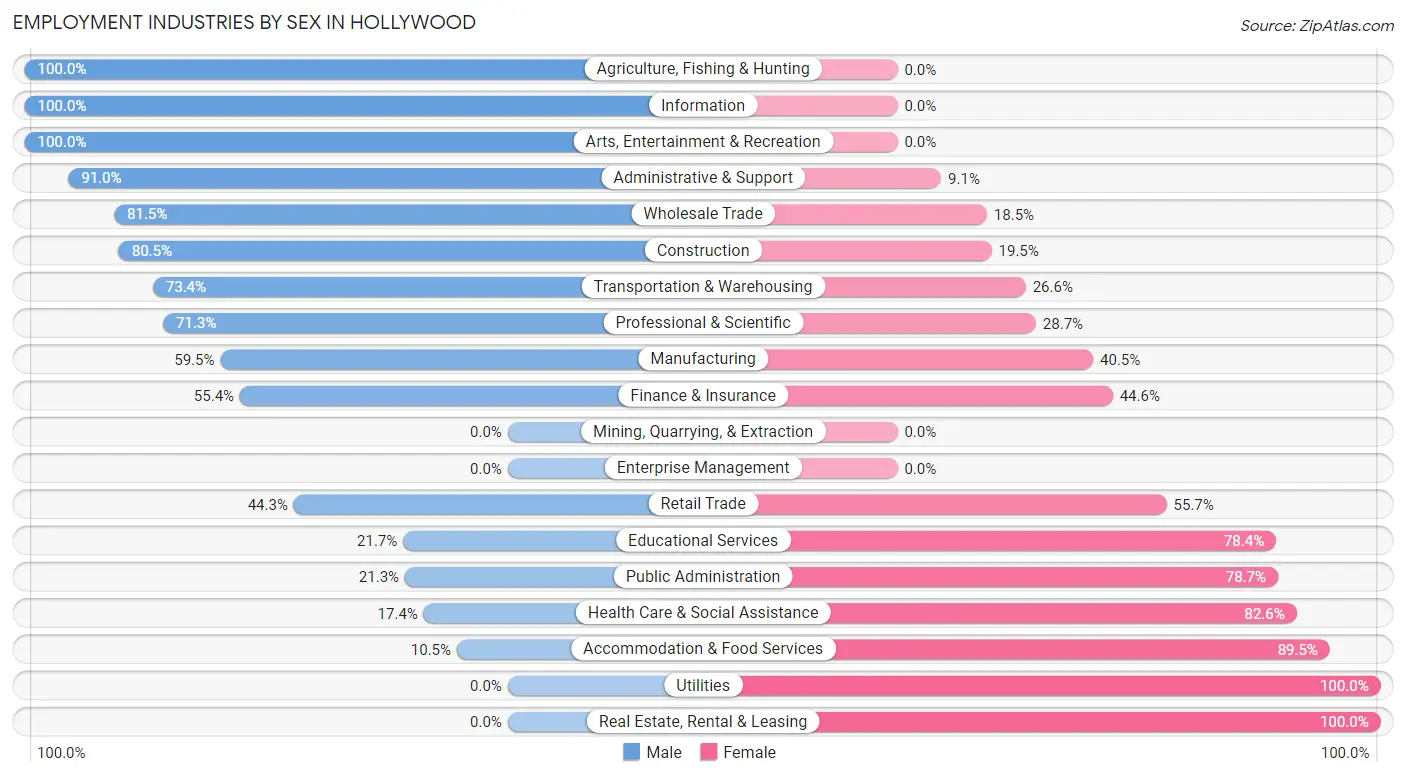
The Hollywood industries that see more men than women are Agriculture, Fishing & Hunting (100.0%), Information (100.0%), and Arts, Entertainment & Recreation (100.0%), whereas the industries that tend to have a higher number of women are Utilities (100.0%), Real Estate, Rental & Leasing (100.0%), and Accommodation & Food Services (89.5%).
| Industry | Male | Female |
| Agriculture, Fishing & Hunting | 62 (100.0%) | 0 (0.0%) |
| Mining, Quarrying, & Extraction | 0 (0.0%) | 0 (0.0%) |
| Construction | 161 (80.5%) | 39 (19.5%) |
| Manufacturing | 141 (59.5%) | 96 (40.5%) |
| Wholesale Trade | 66 (81.5%) | 15 (18.5%) |
| Retail Trade | 62 (44.3%) | 78 (55.7%) |
| Transportation & Warehousing | 47 (73.4%) | 17 (26.6%) |
| Utilities | 0 (0.0%) | 25 (100.0%) |
| Information | 12 (100.0%) | 0 (0.0%) |
| Finance & Insurance | 51 (55.4%) | 41 (44.6%) |
| Real Estate, Rental & Leasing | 0 (0.0%) | 13 (100.0%) |
| Professional & Scientific | 209 (71.3%) | 84 (28.7%) |
| Enterprise Management | 0 (0.0%) | 0 (0.0%) |
| Administrative & Support | 181 (90.9%) | 18 (9.0%) |
| Educational Services | 63 (21.6%) | 228 (78.3%) |
| Health Care & Social Assistance | 67 (17.4%) | 318 (82.6%) |
| Arts, Entertainment & Recreation | 56 (100.0%) | 0 (0.0%) |
| Accommodation & Food Services | 10 (10.5%) | 85 (89.5%) |
| Public Administration | 10 (21.3%) | 37 (78.7%) |
| Total | 1,280 (52.9%) | 1,141 (47.1%) |
Education in Hollywood
School Enrollment in Hollywood
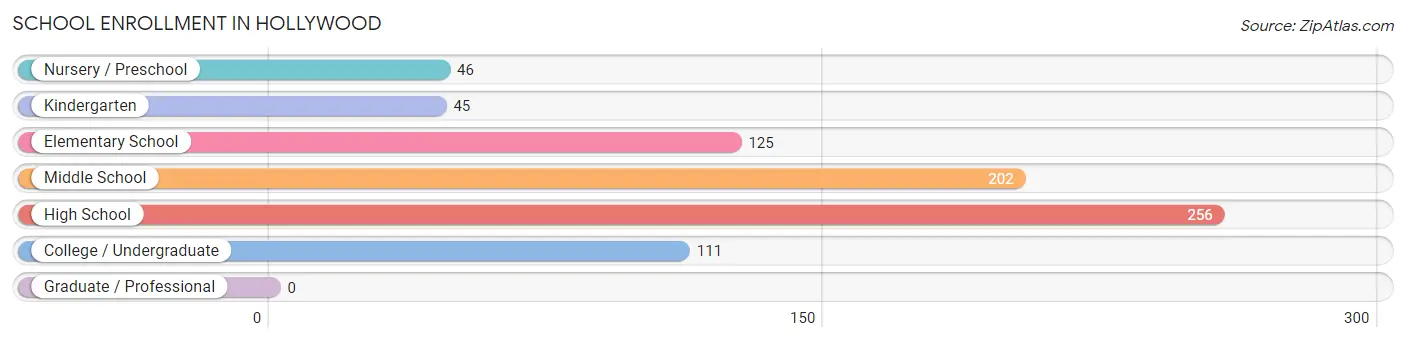
The most common levels of schooling among the 785 students in Hollywood are high school (256 | 32.6%), middle school (202 | 25.7%), and elementary school (125 | 15.9%).
| School Level | # Students | % Students |
| Nursery / Preschool | 46 | 5.9% |
| Kindergarten | 45 | 5.7% |
| Elementary School | 125 | 15.9% |
| Middle School | 202 | 25.7% |
| High School | 256 | 32.6% |
| College / Undergraduate | 111 | 14.1% |
| Graduate / Professional | 0 | 0.0% |
| Total | 785 | 100.0% |
School Enrollment by Age by Funding Source in Hollywood
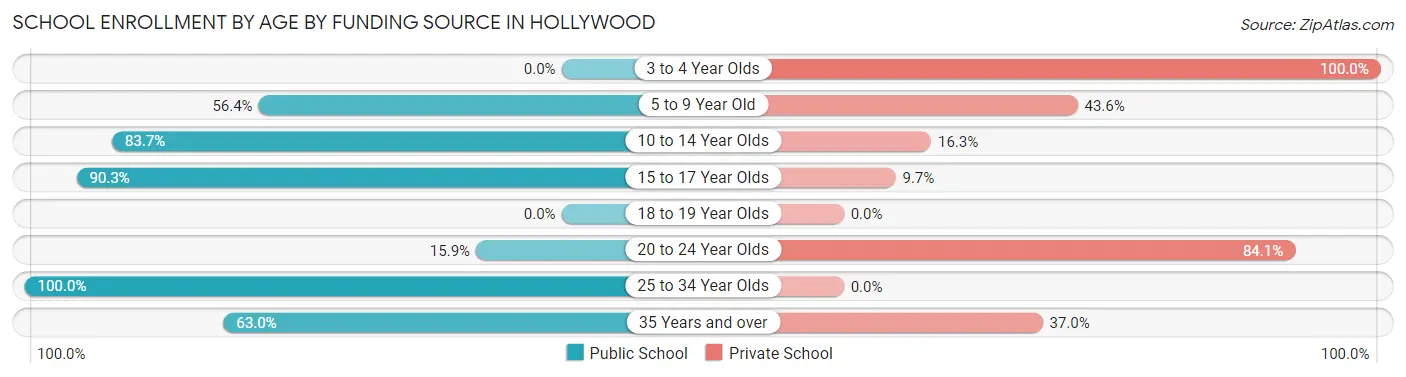
Out of a total of 785 students who are enrolled in schools in Hollywood, 220 (28.0%) attend a private institution, while the remaining 565 (72.0%) are enrolled in public schools. The age group of 3 to 4 year olds has the highest likelihood of being enrolled in private schools, with 34 (100.0% in the age bracket) enrolled. Conversely, the age group of 25 to 34 year olds has the lowest likelihood of being enrolled in a private school, with 15 (100.0% in the age bracket) attending a public institution.
| Age Bracket | Public School | Private School |
| 3 to 4 Year Olds | 0 (0.0%) | 34 (100.0%) |
| 5 to 9 Year Old | 57 (56.4%) | 44 (43.6%) |
| 10 to 14 Year Olds | 278 (83.7%) | 54 (16.3%) |
| 15 to 17 Year Olds | 187 (90.3%) | 20 (9.7%) |
| 18 to 19 Year Olds | 0 (0.0%) | 0 (0.0%) |
| 20 to 24 Year Olds | 11 (15.9%) | 58 (84.1%) |
| 25 to 34 Year Olds | 15 (100.0%) | 0 (0.0%) |
| 35 Years and over | 17 (63.0%) | 10 (37.0%) |
| Total | 565 (72.0%) | 220 (28.0%) |
Educational Attainment by Field of Study in Hollywood
Bio, nature & agricultural (359 | 21.9%), education (303 | 18.5%), business (300 | 18.3%), social sciences (136 | 8.3%), and science & technology (116 | 7.1%) are the most common fields of study among 1,636 individuals in Hollywood who have obtained a bachelor's degree or higher.
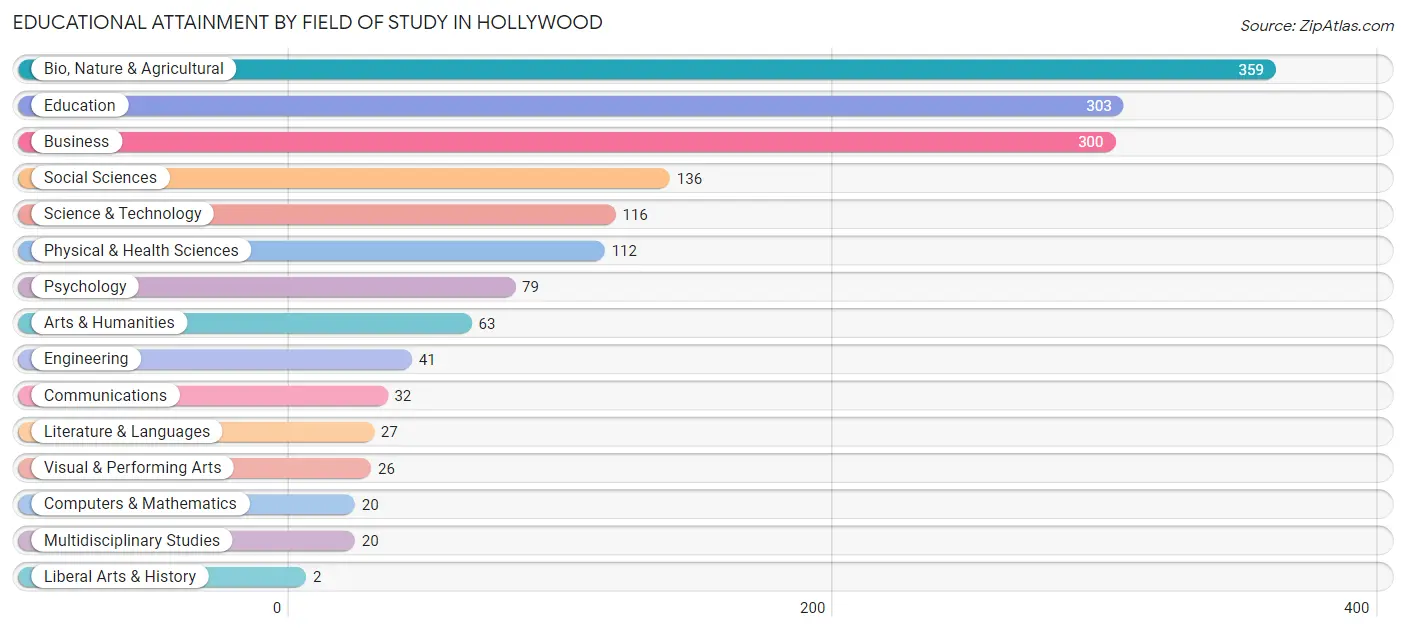
| Field of Study | # Graduates | % Graduates |
| Computers & Mathematics | 20 | 1.2% |
| Bio, Nature & Agricultural | 359 | 21.9% |
| Physical & Health Sciences | 112 | 6.9% |
| Psychology | 79 | 4.8% |
| Social Sciences | 136 | 8.3% |
| Engineering | 41 | 2.5% |
| Multidisciplinary Studies | 20 | 1.2% |
| Science & Technology | 116 | 7.1% |
| Business | 300 | 18.3% |
| Education | 303 | 18.5% |
| Literature & Languages | 27 | 1.7% |
| Liberal Arts & History | 2 | 0.1% |
| Visual & Performing Arts | 26 | 1.6% |
| Communications | 32 | 2.0% |
| Arts & Humanities | 63 | 3.8% |
| Total | 1,636 | 100.0% |
Transportation & Commute in Hollywood
Vehicle Availability by Sex in Hollywood
The most prevalent vehicle ownership categories in Hollywood are males with 2 vehicles (509, accounting for 41.2%) and females with 2 vehicles (546, making up 47.7%).
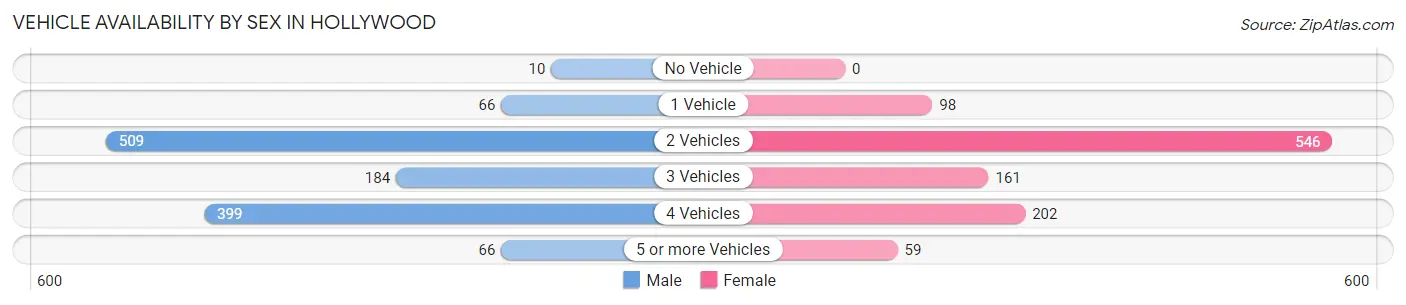
| Vehicles Available | Male | Female |
| No Vehicle | 10 (0.8%) | 0 (0.0%) |
| 1 Vehicle | 66 (5.3%) | 98 (9.2%) |
| 2 Vehicles | 509 (41.2%) | 546 (51.2%) |
| 3 Vehicles | 184 (14.9%) | 161 (15.1%) |
| 4 Vehicles | 399 (32.3%) | 202 (19.0%) |
| 5 or more Vehicles | 66 (5.3%) | 59 (5.5%) |
| Total | 1,234 (100.0%) | 1,066 (100.0%) |
Commute Time in Hollywood
The most frequently occuring commute durations in Hollywood are 45 to 59 minutes (517 commuters, 26.4%), 30 to 34 minutes (234 commuters, 11.9%), and 20 to 24 minutes (195 commuters, 9.9%).
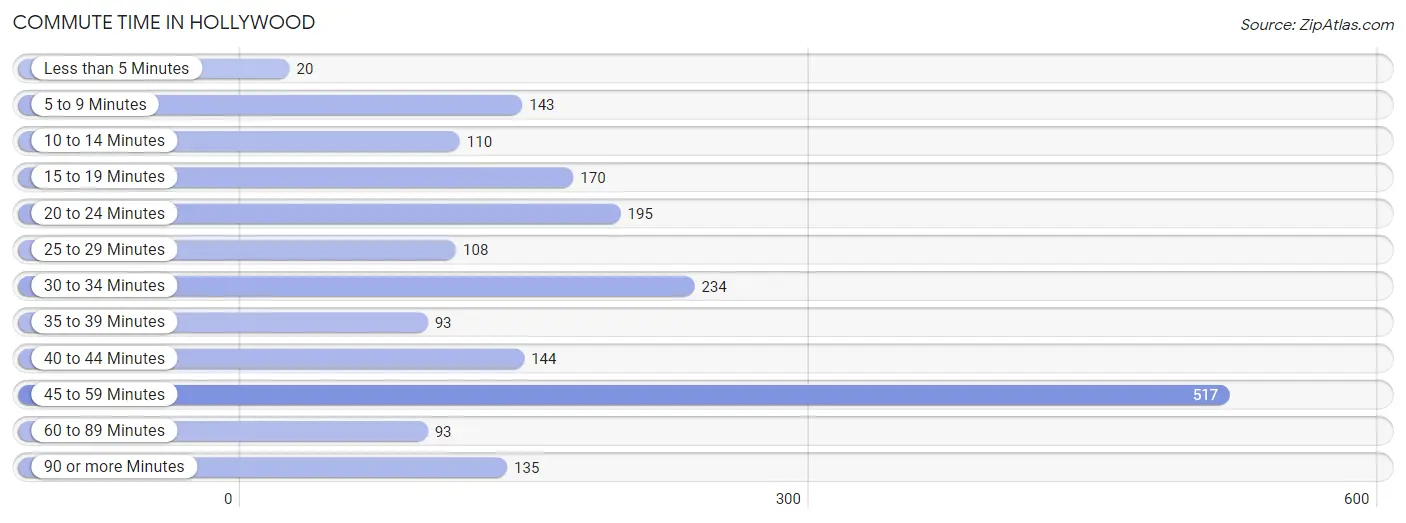
| Commute Time | # Commuters | % Commuters |
| Less than 5 Minutes | 20 | 1.0% |
| 5 to 9 Minutes | 143 | 7.3% |
| 10 to 14 Minutes | 110 | 5.6% |
| 15 to 19 Minutes | 170 | 8.7% |
| 20 to 24 Minutes | 195 | 9.9% |
| 25 to 29 Minutes | 108 | 5.5% |
| 30 to 34 Minutes | 234 | 11.9% |
| 35 to 39 Minutes | 93 | 4.7% |
| 40 to 44 Minutes | 144 | 7.3% |
| 45 to 59 Minutes | 517 | 26.4% |
| 60 to 89 Minutes | 93 | 4.7% |
| 90 or more Minutes | 135 | 6.9% |
Commute Time by Sex in Hollywood
The most common commute times in Hollywood are 45 to 59 minutes (322 commuters, 29.2%) for males and 45 to 59 minutes (195 commuters, 22.7%) for females.
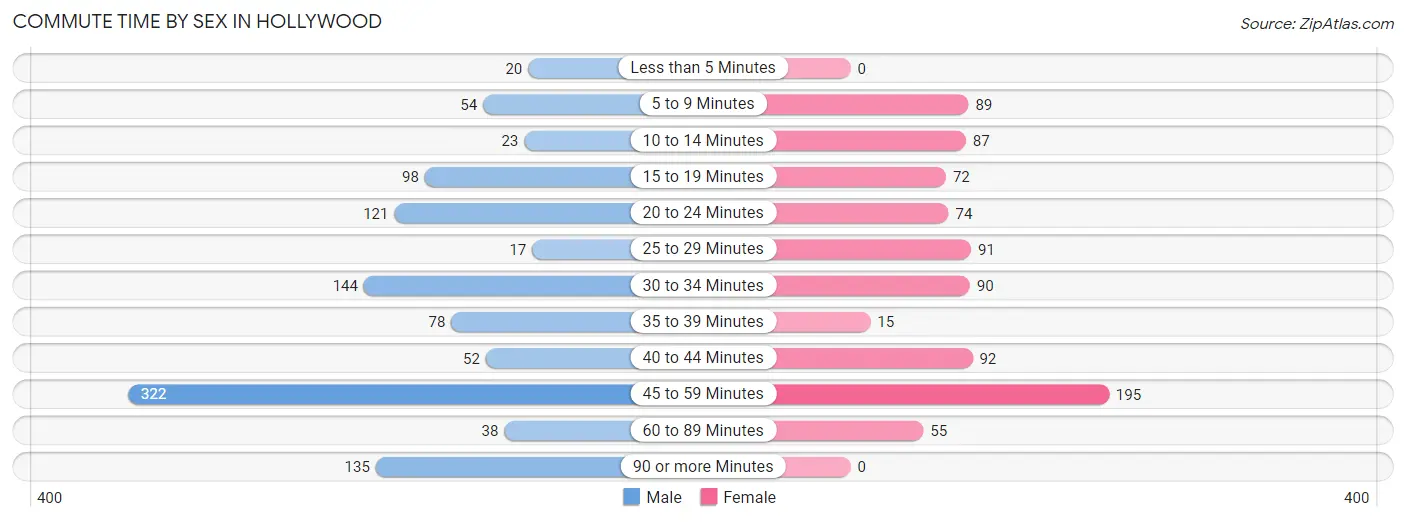
| Commute Time | Male | Female |
| Less than 5 Minutes | 20 (1.8%) | 0 (0.0%) |
| 5 to 9 Minutes | 54 (4.9%) | 89 (10.3%) |
| 10 to 14 Minutes | 23 (2.1%) | 87 (10.1%) |
| 15 to 19 Minutes | 98 (8.9%) | 72 (8.4%) |
| 20 to 24 Minutes | 121 (11.0%) | 74 (8.6%) |
| 25 to 29 Minutes | 17 (1.5%) | 91 (10.6%) |
| 30 to 34 Minutes | 144 (13.1%) | 90 (10.5%) |
| 35 to 39 Minutes | 78 (7.1%) | 15 (1.7%) |
| 40 to 44 Minutes | 52 (4.7%) | 92 (10.7%) |
| 45 to 59 Minutes | 322 (29.2%) | 195 (22.7%) |
| 60 to 89 Minutes | 38 (3.5%) | 55 (6.4%) |
| 90 or more Minutes | 135 (12.2%) | 0 (0.0%) |
Time of Departure to Work by Sex in Hollywood
The most frequent times of departure to work in Hollywood are 6:00 AM to 6:29 AM (205, 18.6%) for males and 7:00 AM to 7:29 AM (284, 33.0%) for females.
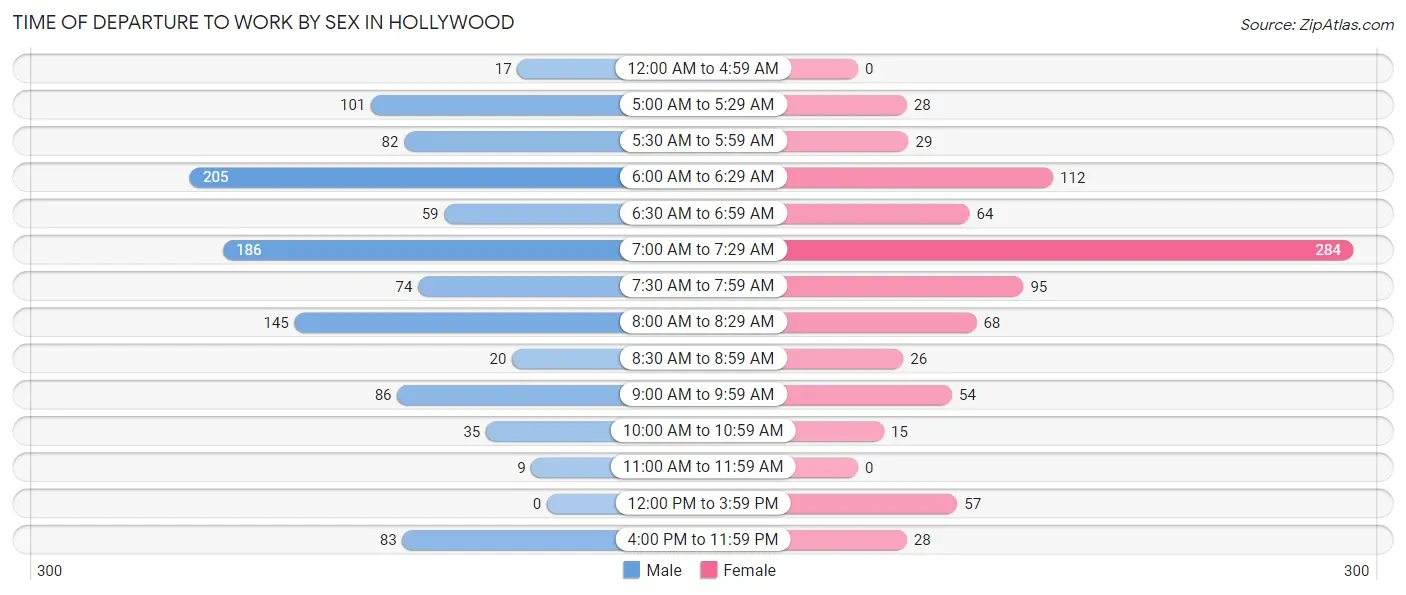
| Time of Departure | Male | Female |
| 12:00 AM to 4:59 AM | 17 (1.5%) | 0 (0.0%) |
| 5:00 AM to 5:29 AM | 101 (9.2%) | 28 (3.3%) |
| 5:30 AM to 5:59 AM | 82 (7.4%) | 29 (3.4%) |
| 6:00 AM to 6:29 AM | 205 (18.6%) | 112 (13.0%) |
| 6:30 AM to 6:59 AM | 59 (5.3%) | 64 (7.4%) |
| 7:00 AM to 7:29 AM | 186 (16.9%) | 284 (33.0%) |
| 7:30 AM to 7:59 AM | 74 (6.7%) | 95 (11.1%) |
| 8:00 AM to 8:29 AM | 145 (13.2%) | 68 (7.9%) |
| 8:30 AM to 8:59 AM | 20 (1.8%) | 26 (3.0%) |
| 9:00 AM to 9:59 AM | 86 (7.8%) | 54 (6.3%) |
| 10:00 AM to 10:59 AM | 35 (3.2%) | 15 (1.7%) |
| 11:00 AM to 11:59 AM | 9 (0.8%) | 0 (0.0%) |
| 12:00 PM to 3:59 PM | 0 (0.0%) | 57 (6.6%) |
| 4:00 PM to 11:59 PM | 83 (7.5%) | 28 (3.3%) |
| Total | 1,102 (100.0%) | 860 (100.0%) |
Housing Occupancy in Hollywood
Occupancy by Ownership in Hollywood
Of the total 2,026 dwellings in Hollywood, owner-occupied units account for 1,801 (88.9%), while renter-occupied units make up 225 (11.1%).
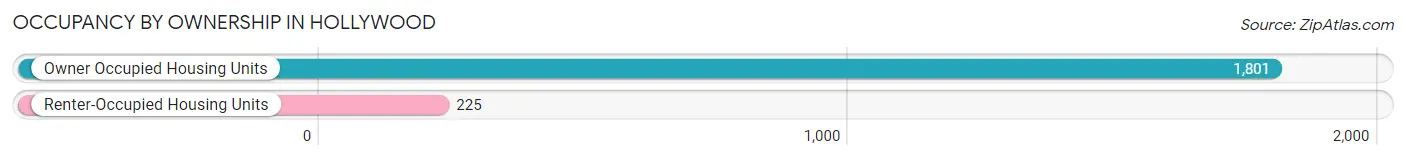
| Occupancy | # Housing Units | % Housing Units |
| Owner Occupied Housing Units | 1,801 | 88.9% |
| Renter-Occupied Housing Units | 225 | 11.1% |
| Total Occupied Housing Units | 2,026 | 100.0% |
Occupancy by Household Size in Hollywood
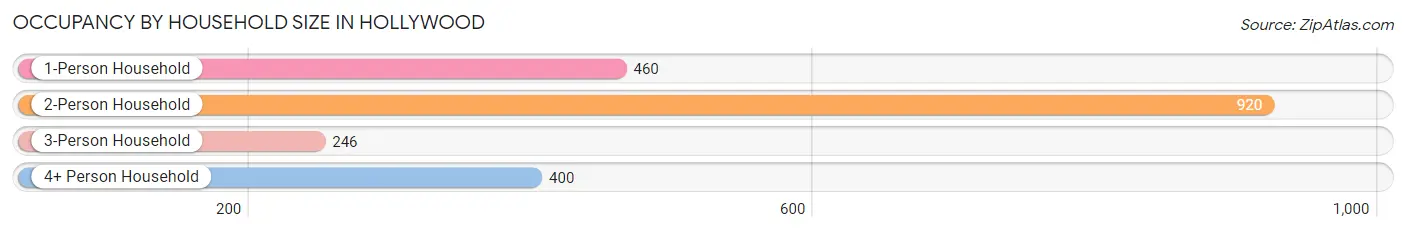
| Household Size | # Housing Units | % Housing Units |
| 1-Person Household | 460 | 22.7% |
| 2-Person Household | 920 | 45.4% |
| 3-Person Household | 246 | 12.1% |
| 4+ Person Household | 400 | 19.7% |
| Total Housing Units | 2,026 | 100.0% |
Occupancy by Ownership by Household Size in Hollywood
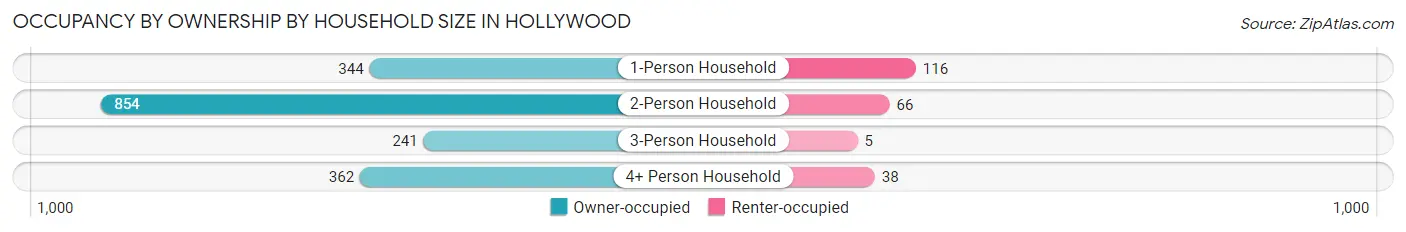
| Household Size | Owner-occupied | Renter-occupied |
| 1-Person Household | 344 (74.8%) | 116 (25.2%) |
| 2-Person Household | 854 (92.8%) | 66 (7.2%) |
| 3-Person Household | 241 (98.0%) | 5 (2.0%) |
| 4+ Person Household | 362 (90.5%) | 38 (9.5%) |
| Total Housing Units | 1,801 (88.9%) | 225 (11.1%) |
Occupancy by Educational Attainment in Hollywood
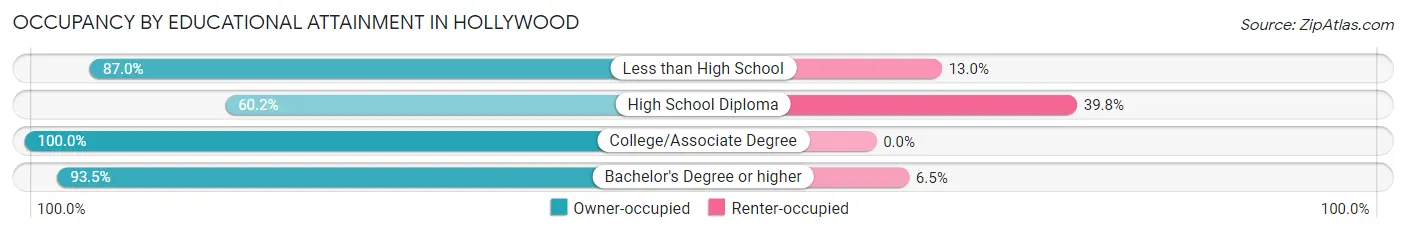
| Household Size | Owner-occupied | Renter-occupied |
| Less than High School | 241 (87.0%) | 36 (13.0%) |
| High School Diploma | 218 (60.2%) | 144 (39.8%) |
| College/Associate Degree | 694 (100.0%) | 0 (0.0%) |
| Bachelor's Degree or higher | 648 (93.5%) | 45 (6.5%) |
Occupancy by Age of Householder in Hollywood
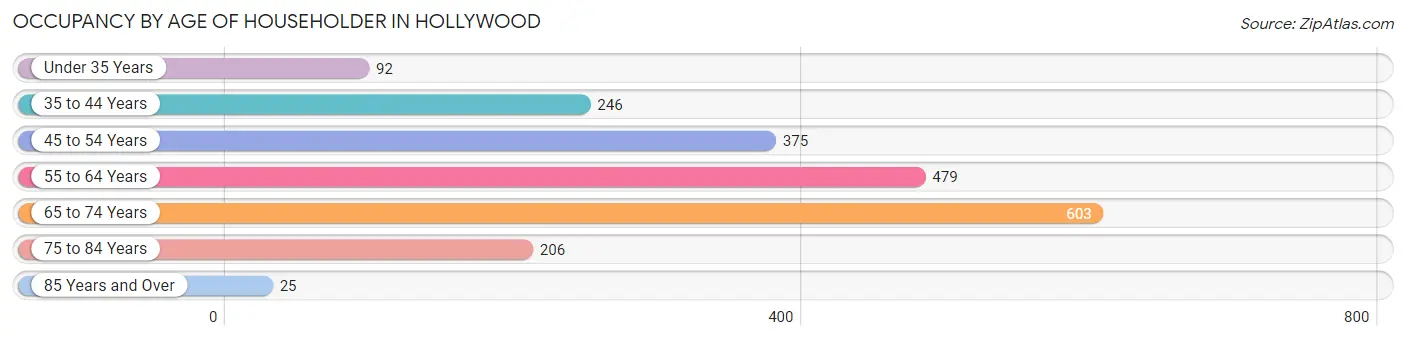
| Age Bracket | # Households | % Households |
| Under 35 Years | 92 | 4.5% |
| 35 to 44 Years | 246 | 12.1% |
| 45 to 54 Years | 375 | 18.5% |
| 55 to 64 Years | 479 | 23.6% |
| 65 to 74 Years | 603 | 29.8% |
| 75 to 84 Years | 206 | 10.2% |
| 85 Years and Over | 25 | 1.2% |
| Total | 2,026 | 100.0% |
Housing Finances in Hollywood
Median Income by Occupancy in Hollywood
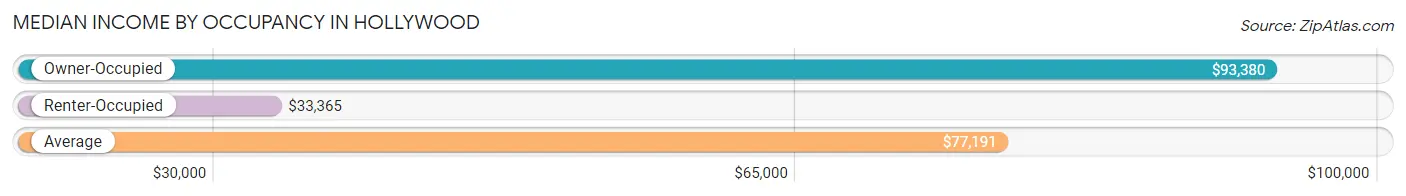
| Occupancy Type | # Households | Median Income |
| Owner-Occupied | 1,801 (88.9%) | $93,380 |
| Renter-Occupied | 225 (11.1%) | $33,365 |
| Average | 2,026 (100.0%) | $77,191 |
Occupancy by Householder Income Bracket in Hollywood
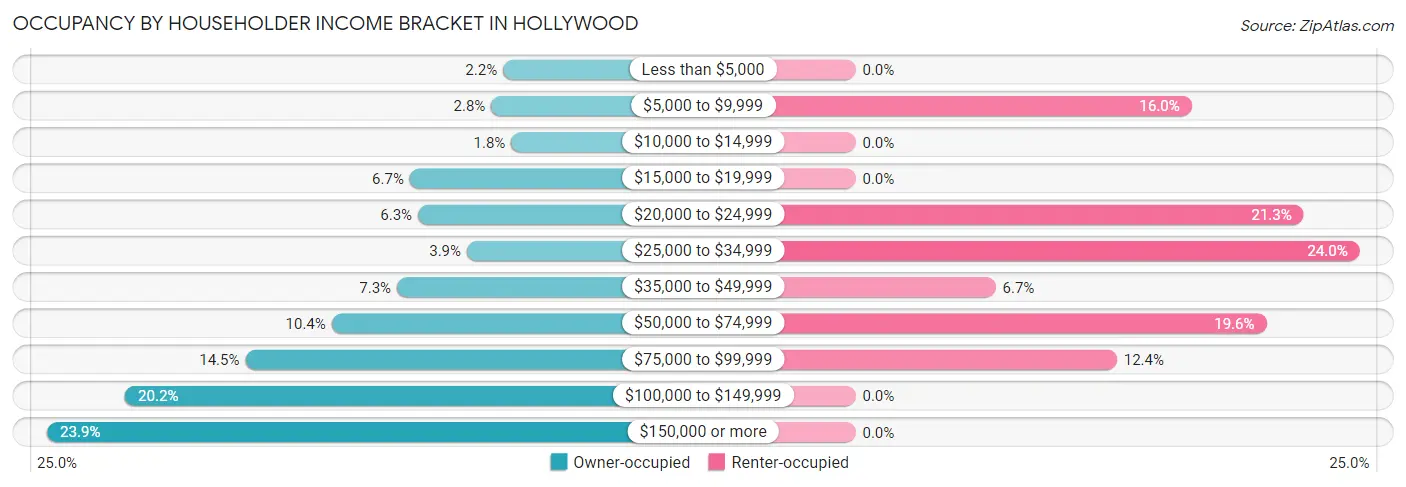
| Income Bracket | Owner-occupied | Renter-occupied |
| Less than $5,000 | 40 (2.2%) | 0 (0.0%) |
| $5,000 to $9,999 | 50 (2.8%) | 36 (16.0%) |
| $10,000 to $14,999 | 33 (1.8%) | 0 (0.0%) |
| $15,000 to $19,999 | 120 (6.7%) | 0 (0.0%) |
| $20,000 to $24,999 | 113 (6.3%) | 48 (21.3%) |
| $25,000 to $34,999 | 71 (3.9%) | 54 (24.0%) |
| $35,000 to $49,999 | 131 (7.3%) | 15 (6.7%) |
| $50,000 to $74,999 | 187 (10.4%) | 44 (19.6%) |
| $75,000 to $99,999 | 261 (14.5%) | 28 (12.4%) |
| $100,000 to $149,999 | 364 (20.2%) | 0 (0.0%) |
| $150,000 or more | 431 (23.9%) | 0 (0.0%) |
| Total | 1,801 (100.0%) | 225 (100.0%) |
Monthly Housing Cost Tiers in Hollywood
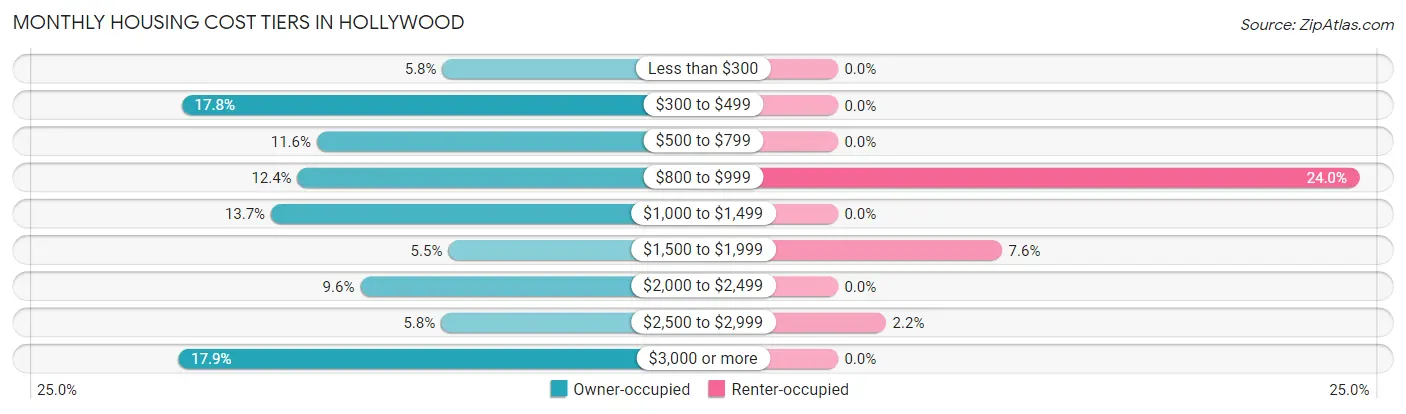
| Monthly Cost | Owner-occupied | Renter-occupied |
| Less than $300 | 104 (5.8%) | 0 (0.0%) |
| $300 to $499 | 320 (17.8%) | 0 (0.0%) |
| $500 to $799 | 208 (11.6%) | 0 (0.0%) |
| $800 to $999 | 224 (12.4%) | 54 (24.0%) |
| $1,000 to $1,499 | 246 (13.7%) | 0 (0.0%) |
| $1,500 to $1,999 | 99 (5.5%) | 17 (7.6%) |
| $2,000 to $2,499 | 172 (9.6%) | 0 (0.0%) |
| $2,500 to $2,999 | 105 (5.8%) | 5 (2.2%) |
| $3,000 or more | 323 (17.9%) | 0 (0.0%) |
| Total | 1,801 (100.0%) | 225 (100.0%) |
Physical Housing Characteristics in Hollywood
Housing Structures in Hollywood
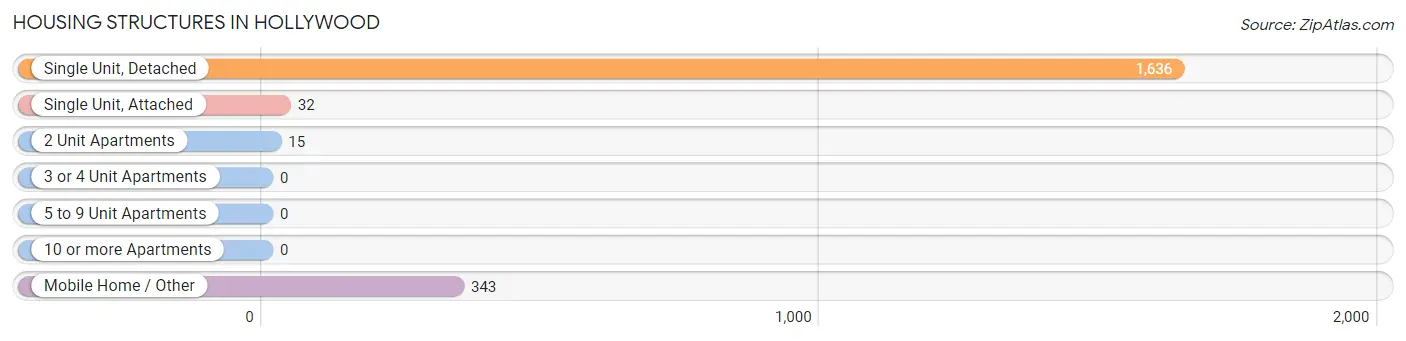
| Structure Type | # Housing Units | % Housing Units |
| Single Unit, Detached | 1,636 | 80.7% |
| Single Unit, Attached | 32 | 1.6% |
| 2 Unit Apartments | 15 | 0.7% |
| 3 or 4 Unit Apartments | 0 | 0.0% |
| 5 to 9 Unit Apartments | 0 | 0.0% |
| 10 or more Apartments | 0 | 0.0% |
| Mobile Home / Other | 343 | 16.9% |
| Total | 2,026 | 100.0% |
Housing Structures by Occupancy in Hollywood
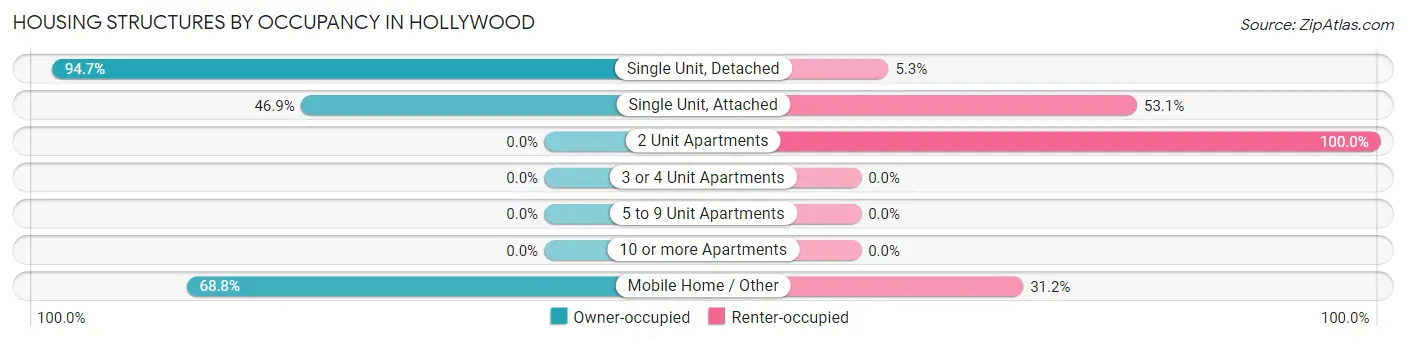
| Structure Type | Owner-occupied | Renter-occupied |
| Single Unit, Detached | 1,550 (94.7%) | 86 (5.3%) |
| Single Unit, Attached | 15 (46.9%) | 17 (53.1%) |
| 2 Unit Apartments | 0 (0.0%) | 15 (100.0%) |
| 3 or 4 Unit Apartments | 0 (0.0%) | 0 (0.0%) |
| 5 to 9 Unit Apartments | 0 (0.0%) | 0 (0.0%) |
| 10 or more Apartments | 0 (0.0%) | 0 (0.0%) |
| Mobile Home / Other | 236 (68.8%) | 107 (31.2%) |
| Total | 1,801 (88.9%) | 225 (11.1%) |
Housing Structures by Number of Rooms in Hollywood
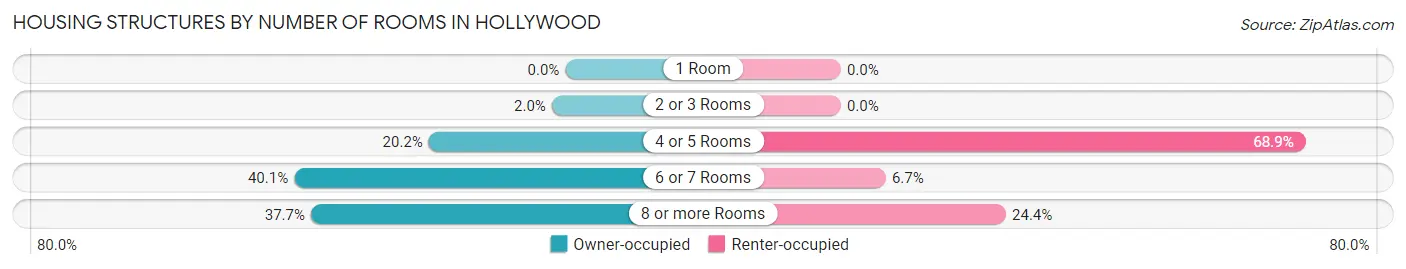
| Number of Rooms | Owner-occupied | Renter-occupied |
| 1 Room | 0 (0.0%) | 0 (0.0%) |
| 2 or 3 Rooms | 36 (2.0%) | 0 (0.0%) |
| 4 or 5 Rooms | 364 (20.2%) | 155 (68.9%) |
| 6 or 7 Rooms | 723 (40.1%) | 15 (6.7%) |
| 8 or more Rooms | 678 (37.7%) | 55 (24.4%) |
| Total | 1,801 (100.0%) | 225 (100.0%) |
Housing Structure by Heating Type in Hollywood
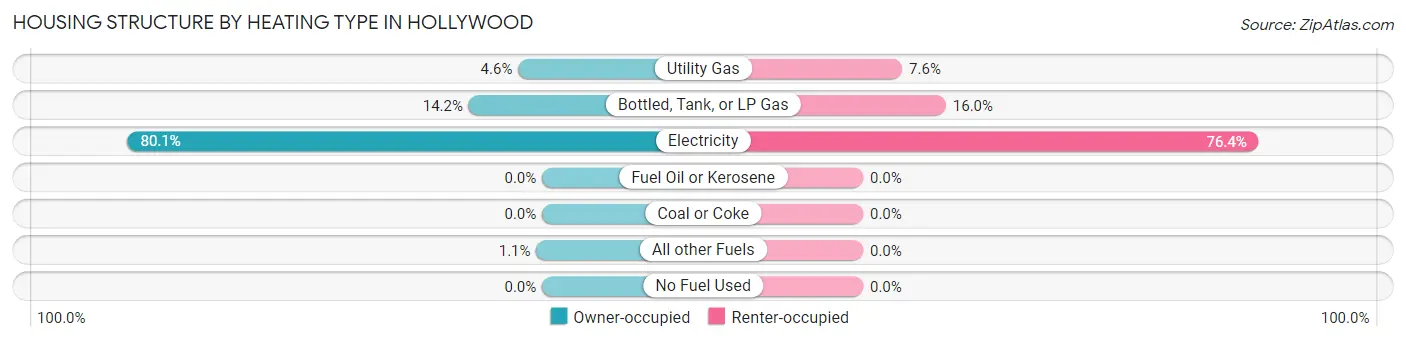
| Heating Type | Owner-occupied | Renter-occupied |
| Utility Gas | 83 (4.6%) | 17 (7.6%) |
| Bottled, Tank, or LP Gas | 255 (14.2%) | 36 (16.0%) |
| Electricity | 1,443 (80.1%) | 172 (76.4%) |
| Fuel Oil or Kerosene | 0 (0.0%) | 0 (0.0%) |
| Coal or Coke | 0 (0.0%) | 0 (0.0%) |
| All other Fuels | 20 (1.1%) | 0 (0.0%) |
| No Fuel Used | 0 (0.0%) | 0 (0.0%) |
| Total | 1,801 (100.0%) | 225 (100.0%) |
Household Vehicle Usage in Hollywood
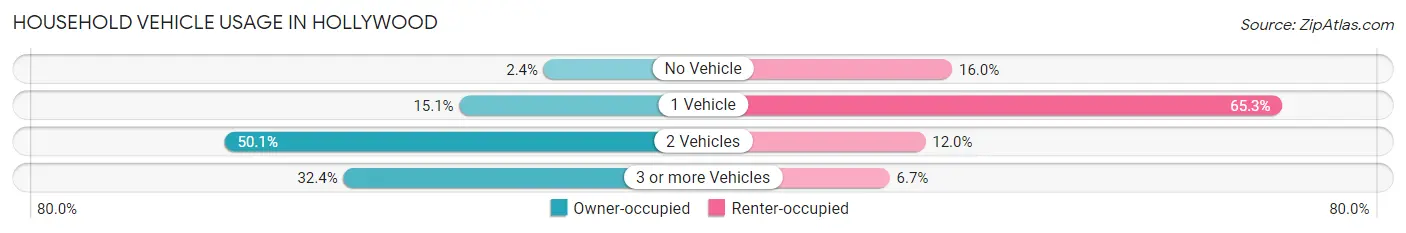
| Vehicles per Household | Owner-occupied | Renter-occupied |
| No Vehicle | 44 (2.4%) | 36 (16.0%) |
| 1 Vehicle | 271 (15.0%) | 147 (65.3%) |
| 2 Vehicles | 903 (50.1%) | 27 (12.0%) |
| 3 or more Vehicles | 583 (32.4%) | 15 (6.7%) |
| Total | 1,801 (100.0%) | 225 (100.0%) |
Real Estate & Mortgages in Hollywood
Real Estate and Mortgage Overview in Hollywood
| Characteristic | Without Mortgage | With Mortgage |
| Housing Units | 790 | 1,011 |
| Median Property Value | $256,700 | $489,400 |
| Median Household Income | $50,855 | $321 |
| Monthly Housing Costs | $492 | $323 |
| Real Estate Taxes | $826 | $8 |
Property Value by Mortgage Status in Hollywood
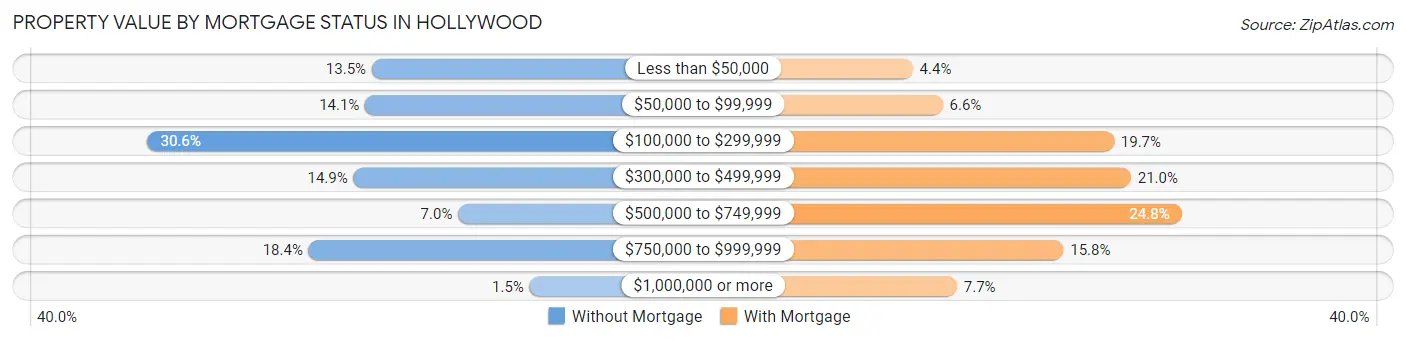
| Property Value | Without Mortgage | With Mortgage |
| Less than $50,000 | 107 (13.5%) | 44 (4.3%) |
| $50,000 to $99,999 | 111 (14.1%) | 67 (6.6%) |
| $100,000 to $299,999 | 242 (30.6%) | 199 (19.7%) |
| $300,000 to $499,999 | 118 (14.9%) | 212 (21.0%) |
| $500,000 to $749,999 | 55 (7.0%) | 251 (24.8%) |
| $750,000 to $999,999 | 145 (18.3%) | 160 (15.8%) |
| $1,000,000 or more | 12 (1.5%) | 78 (7.7%) |
| Total | 790 (100.0%) | 1,011 (100.0%) |
Household Income by Mortgage Status in Hollywood
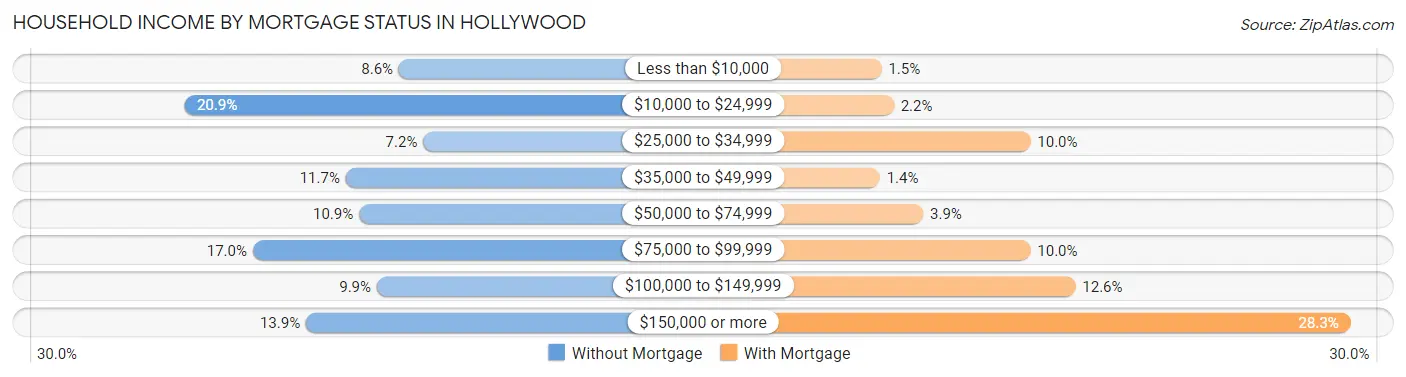
| Household Income | Without Mortgage | With Mortgage |
| Less than $10,000 | 68 (8.6%) | 15 (1.5%) |
| $10,000 to $24,999 | 165 (20.9%) | 22 (2.2%) |
| $25,000 to $34,999 | 57 (7.2%) | 101 (10.0%) |
| $35,000 to $49,999 | 92 (11.7%) | 14 (1.4%) |
| $50,000 to $74,999 | 86 (10.9%) | 39 (3.9%) |
| $75,000 to $99,999 | 134 (17.0%) | 101 (10.0%) |
| $100,000 to $149,999 | 78 (9.9%) | 127 (12.6%) |
| $150,000 or more | 110 (13.9%) | 286 (28.3%) |
| Total | 790 (100.0%) | 1,011 (100.0%) |
Property Value to Household Income Ratio in Hollywood
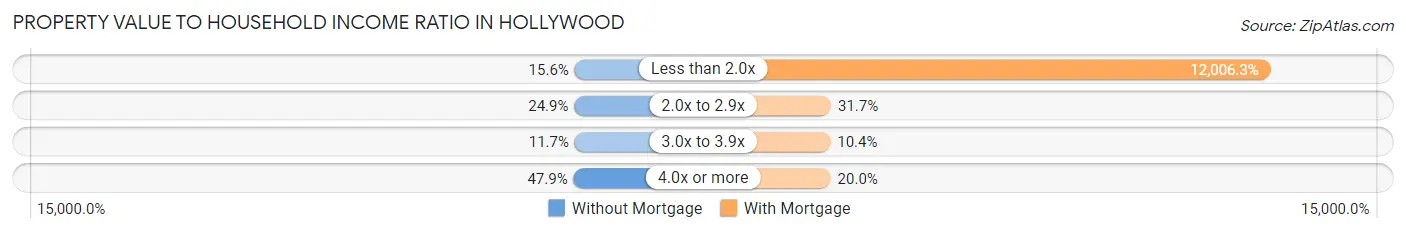
| Value-to-Income Ratio | Without Mortgage | With Mortgage |
| Less than 2.0x | 123 (15.6%) | 121,384 (12,006.3%) |
| 2.0x to 2.9x | 197 (24.9%) | 320 (31.7%) |
| 3.0x to 3.9x | 92 (11.7%) | 105 (10.4%) |
| 4.0x or more | 378 (47.8%) | 202 (20.0%) |
| Total | 790 (100.0%) | 1,011 (100.0%) |
Real Estate Taxes by Mortgage Status in Hollywood
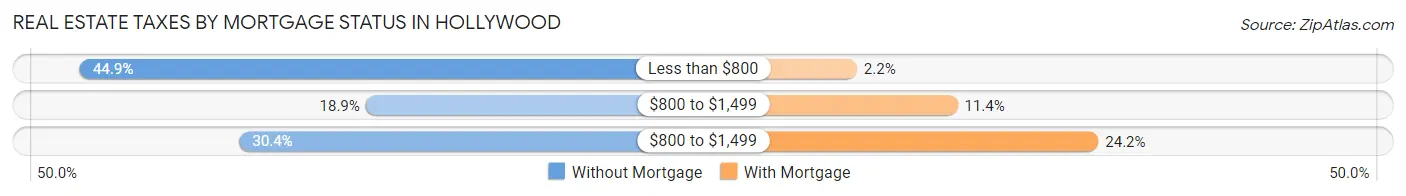
| Property Taxes | Without Mortgage | With Mortgage |
| Less than $800 | 355 (44.9%) | 22 (2.2%) |
| $800 to $1,499 | 149 (18.9%) | 115 (11.4%) |
| $800 to $1,499 | 240 (30.4%) | 245 (24.2%) |
| Total | 790 (100.0%) | 1,011 (100.0%) |
Health & Disability in Hollywood
Health Insurance Coverage by Age in Hollywood
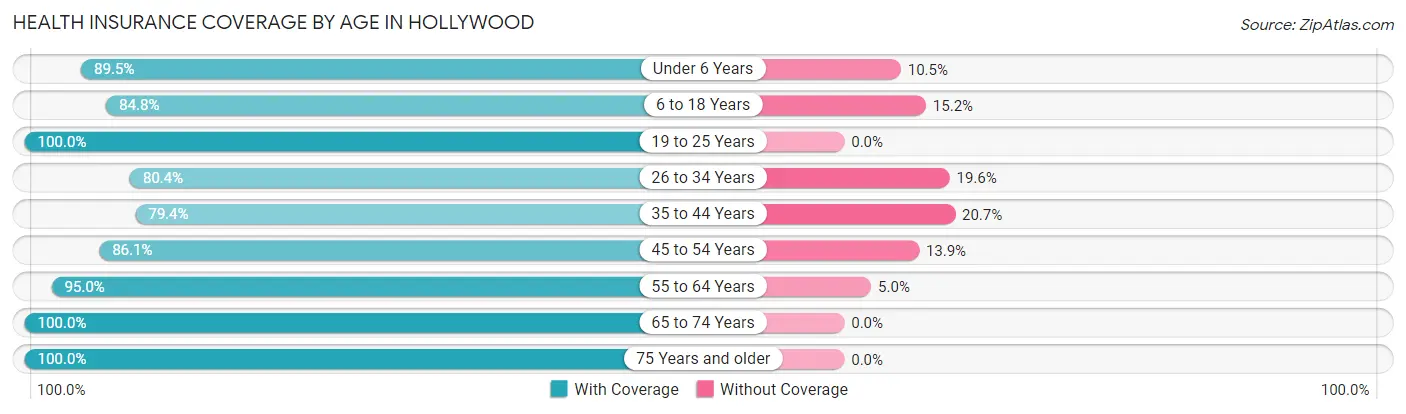
| Age Bracket | With Coverage | Without Coverage |
| Under 6 Years | 289 (89.5%) | 34 (10.5%) |
| 6 to 18 Years | 518 (84.8%) | 93 (15.2%) |
| 19 to 25 Years | 160 (100.0%) | 0 (0.0%) |
| 26 to 34 Years | 520 (80.4%) | 127 (19.6%) |
| 35 to 44 Years | 392 (79.3%) | 102 (20.6%) |
| 45 to 54 Years | 705 (86.1%) | 114 (13.9%) |
| 55 to 64 Years | 966 (95.0%) | 51 (5.0%) |
| 65 to 74 Years | 973 (100.0%) | 0 (0.0%) |
| 75 Years and older | 334 (100.0%) | 0 (0.0%) |
| Total | 4,857 (90.3%) | 521 (9.7%) |
Health Insurance Coverage by Citizenship Status in Hollywood
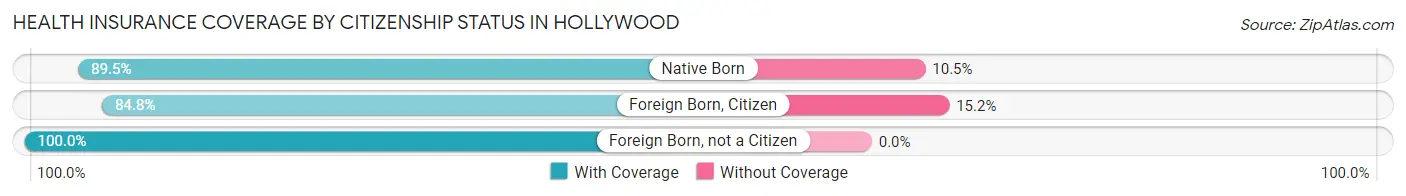
| Citizenship Status | With Coverage | Without Coverage |
| Native Born | 289 (89.5%) | 34 (10.5%) |
| Foreign Born, Citizen | 518 (84.8%) | 93 (15.2%) |
| Foreign Born, not a Citizen | 160 (100.0%) | 0 (0.0%) |
Health Insurance Coverage by Household Income in Hollywood
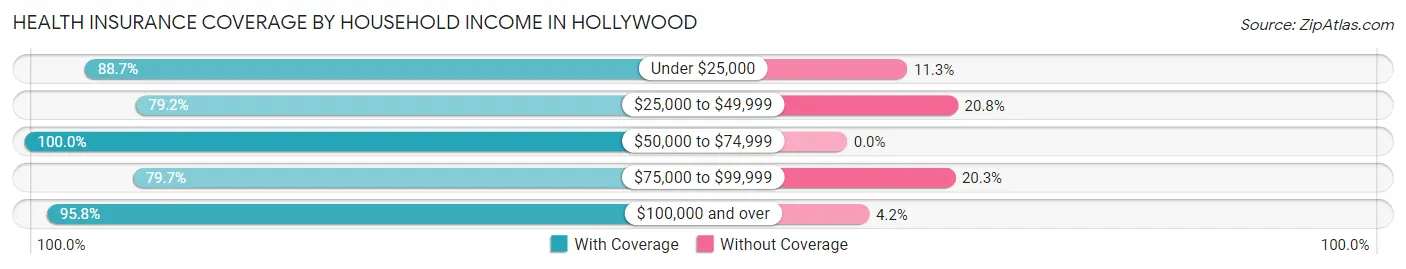
| Household Income | With Coverage | Without Coverage |
| Under $25,000 | 558 (88.7%) | 71 (11.3%) |
| $25,000 to $49,999 | 542 (79.2%) | 142 (20.8%) |
| $50,000 to $74,999 | 607 (100.0%) | 0 (0.0%) |
| $75,000 to $99,999 | 811 (79.7%) | 206 (20.3%) |
| $100,000 and over | 2,339 (95.8%) | 102 (4.2%) |
Public vs Private Health Insurance Coverage by Age in Hollywood
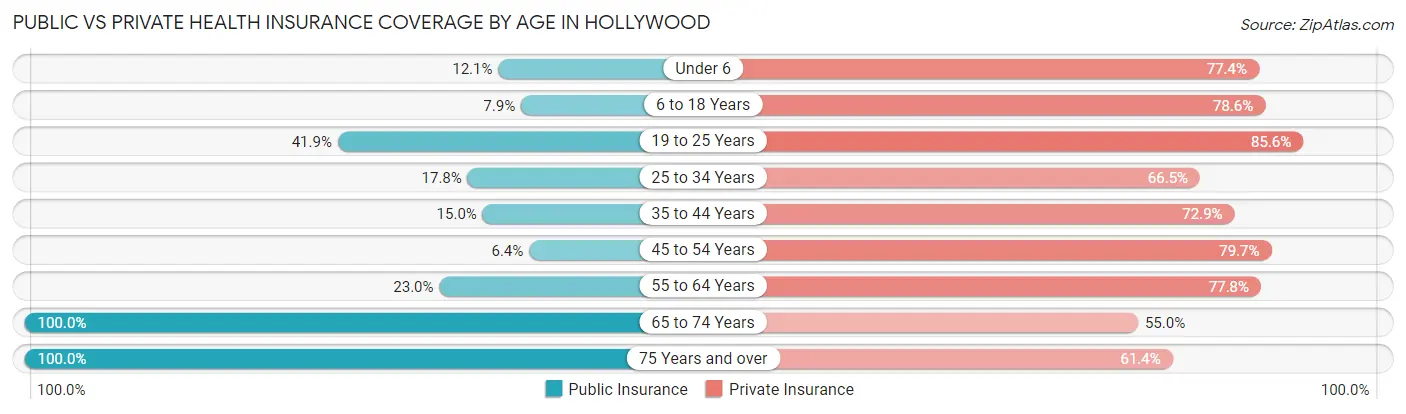
| Age Bracket | Public Insurance | Private Insurance |
| Under 6 | 39 (12.1%) | 250 (77.4%) |
| 6 to 18 Years | 48 (7.9%) | 480 (78.6%) |
| 19 to 25 Years | 67 (41.9%) | 137 (85.6%) |
| 25 to 34 Years | 115 (17.8%) | 430 (66.5%) |
| 35 to 44 Years | 74 (15.0%) | 360 (72.9%) |
| 45 to 54 Years | 52 (6.4%) | 653 (79.7%) |
| 55 to 64 Years | 234 (23.0%) | 791 (77.8%) |
| 65 to 74 Years | 973 (100.0%) | 535 (55.0%) |
| 75 Years and over | 334 (100.0%) | 205 (61.4%) |
| Total | 1,936 (36.0%) | 3,841 (71.4%) |
Disability Status by Sex by Age in Hollywood
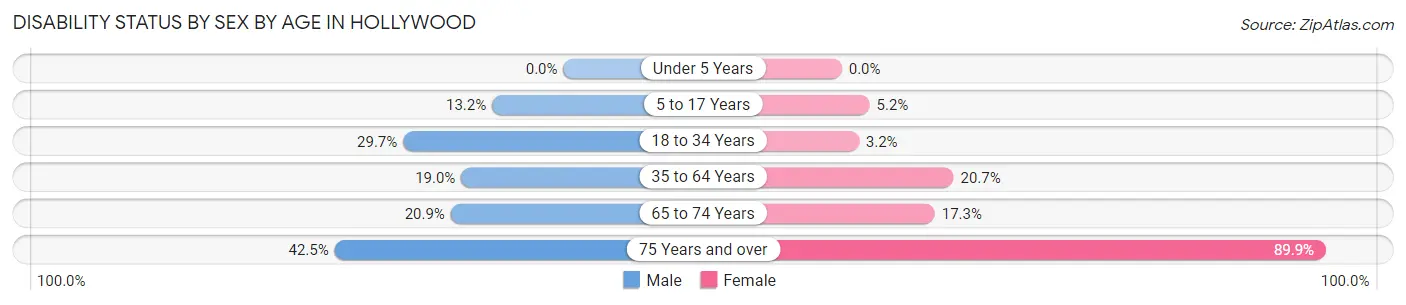
| Age Bracket | Male | Female |
| Under 5 Years | 0 (0.0%) | 0 (0.0%) |
| 5 to 17 Years | 36 (13.2%) | 19 (5.2%) |
| 18 to 34 Years | 127 (29.7%) | 12 (3.2%) |
| 35 to 64 Years | 226 (19.0%) | 236 (20.7%) |
| 65 to 74 Years | 92 (20.9%) | 92 (17.3%) |
| 75 Years and over | 79 (42.5%) | 133 (89.9%) |
Disability Class by Sex by Age in Hollywood
Disability Class: Hearing Difficulty
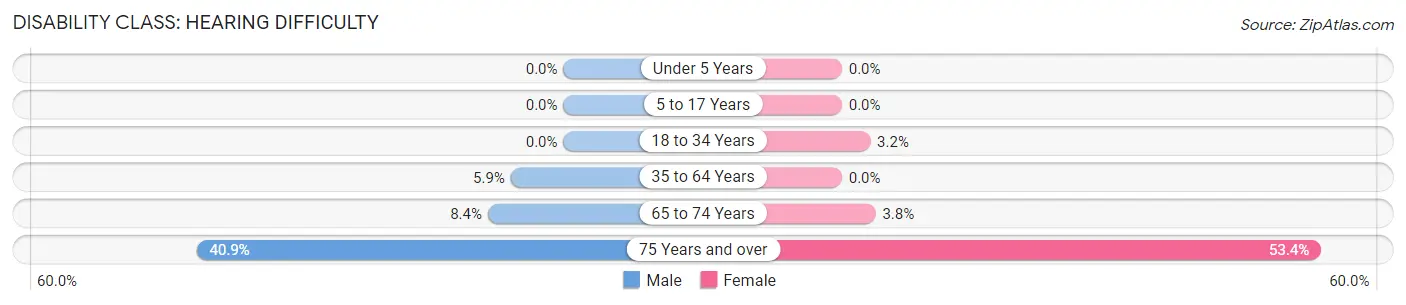
| Age Bracket | Male | Female |
| Under 5 Years | 0 (0.0%) | 0 (0.0%) |
| 5 to 17 Years | 0 (0.0%) | 0 (0.0%) |
| 18 to 34 Years | 0 (0.0%) | 12 (3.2%) |
| 35 to 64 Years | 70 (5.9%) | 0 (0.0%) |
| 65 to 74 Years | 37 (8.4%) | 20 (3.7%) |
| 75 Years and over | 76 (40.9%) | 79 (53.4%) |
Disability Class: Vision Difficulty
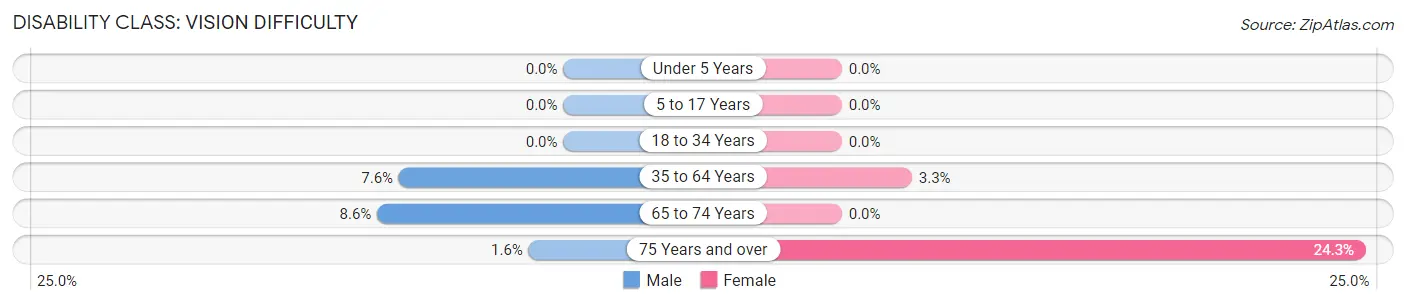
| Age Bracket | Male | Female |
| Under 5 Years | 0 (0.0%) | 0 (0.0%) |
| 5 to 17 Years | 0 (0.0%) | 0 (0.0%) |
| 18 to 34 Years | 0 (0.0%) | 0 (0.0%) |
| 35 to 64 Years | 91 (7.6%) | 37 (3.3%) |
| 65 to 74 Years | 38 (8.6%) | 0 (0.0%) |
| 75 Years and over | 3 (1.6%) | 36 (24.3%) |
Disability Class: Cognitive Difficulty
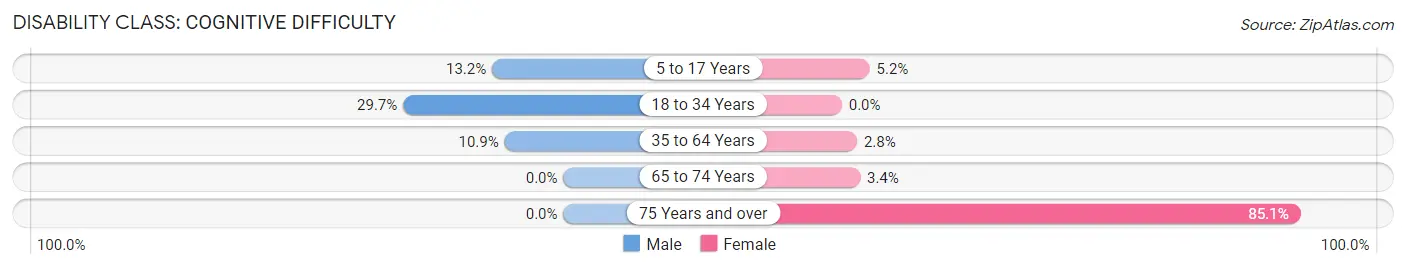
| Age Bracket | Male | Female |
| 5 to 17 Years | 36 (13.2%) | 19 (5.2%) |
| 18 to 34 Years | 127 (29.7%) | 0 (0.0%) |
| 35 to 64 Years | 130 (10.9%) | 32 (2.8%) |
| 65 to 74 Years | 0 (0.0%) | 18 (3.4%) |
| 75 Years and over | 0 (0.0%) | 126 (85.1%) |
Disability Class: Ambulatory Difficulty
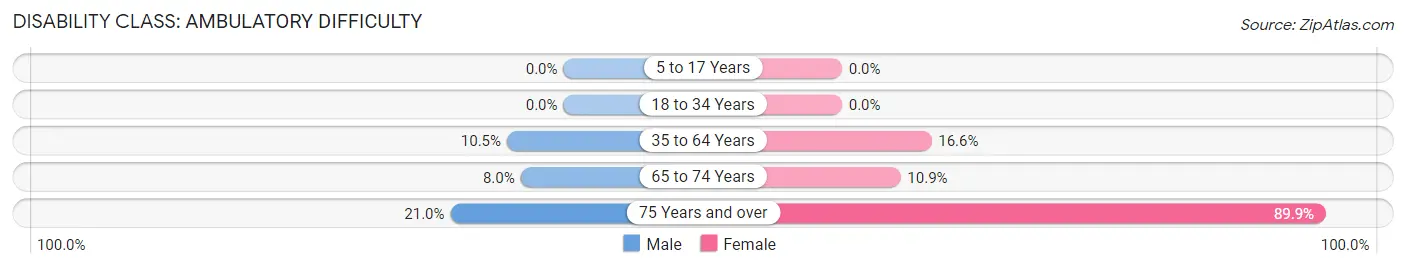
| Age Bracket | Male | Female |
| 5 to 17 Years | 0 (0.0%) | 0 (0.0%) |
| 18 to 34 Years | 0 (0.0%) | 0 (0.0%) |
| 35 to 64 Years | 125 (10.5%) | 189 (16.6%) |
| 65 to 74 Years | 35 (8.0%) | 58 (10.9%) |
| 75 Years and over | 39 (21.0%) | 133 (89.9%) |
Disability Class: Self-Care Difficulty
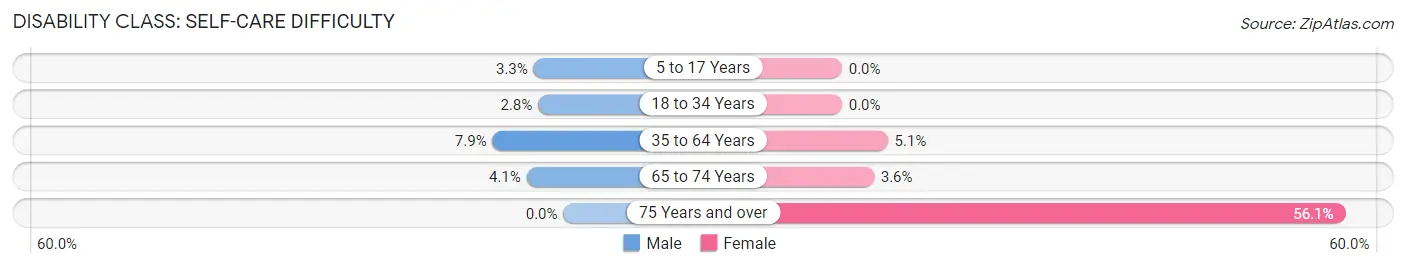
| Age Bracket | Male | Female |
| 5 to 17 Years | 9 (3.3%) | 0 (0.0%) |
| 18 to 34 Years | 12 (2.8%) | 0 (0.0%) |
| 35 to 64 Years | 94 (7.9%) | 58 (5.1%) |
| 65 to 74 Years | 18 (4.1%) | 19 (3.6%) |
| 75 Years and over | 0 (0.0%) | 83 (56.1%) |
Technology Access in Hollywood
Computing Device Access in Hollywood
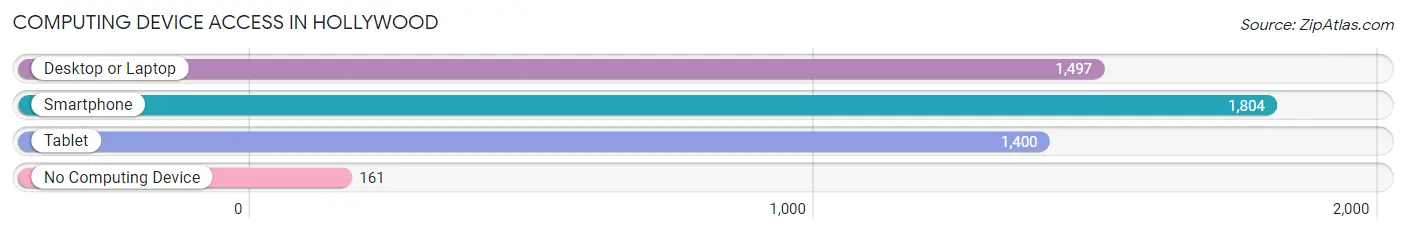
| Device Type | # Households | % Households |
| Desktop or Laptop | 1,497 | 73.9% |
| Smartphone | 1,804 | 89.0% |
| Tablet | 1,400 | 69.1% |
| No Computing Device | 161 | 8.0% |
| Total | 2,026 | 100.0% |
Internet Access in Hollywood
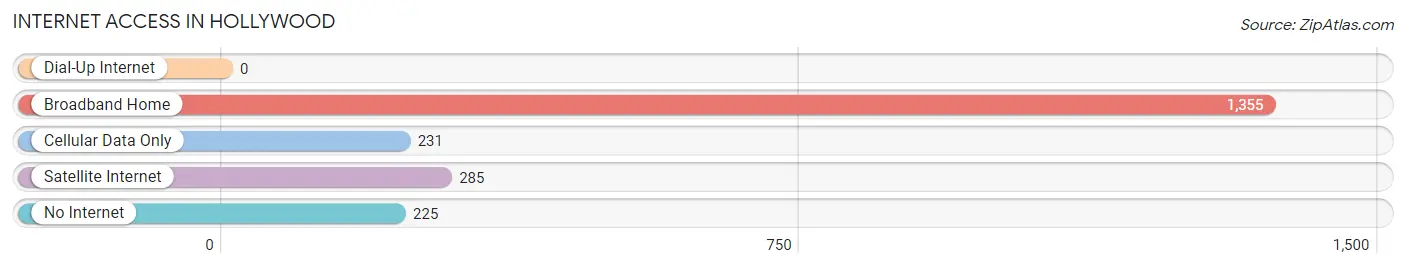
| Internet Type | # Households | % Households |
| Dial-Up Internet | 0 | 0.0% |
| Broadband Home | 1,355 | 66.9% |
| Cellular Data Only | 231 | 11.4% |
| Satellite Internet | 285 | 14.1% |
| No Internet | 225 | 11.1% |
| Total | 2,026 | 100.0% |
Hollywood Summary
Hollywood, South Carolina is a small town located in Charleston County, South Carolina. It is situated on the banks of the Ashley River, approximately 20 miles northwest of Charleston. Hollywood is a rural community with a population of approximately 1,500 people. The town is known for its historic sites, such as the Hollywood Cemetery, which dates back to the early 1800s.
Geography
Hollywood is located in the Lowcountry region of South Carolina, which is characterized by its flat terrain and coastal plains. The town is situated on the banks of the Ashley River, which is a major tributary of the Cooper River. The Ashley River is a popular destination for fishing, boating, and other recreational activities. The town is also located near the Francis Marion National Forest, which is a popular destination for hiking, camping, and other outdoor activities.
Economy
Hollywood’s economy is largely based on agriculture and tourism. The town is home to several farms, which produce a variety of crops, including corn, soybeans, and cotton. The town is also home to several tourist attractions, such as the Hollywood Cemetery, which is a popular destination for visitors. Additionally, the town is home to several restaurants, shops, and other businesses.
Demographics
As of the 2010 census, the population of Hollywood was 1,521. The racial makeup of the town was 79.2% White, 16.2% African American, 0.3% Native American, 0.7% Asian, 0.1% Pacific Islander, and 3.5% from other races. The median household income in Hollywood was $41,250, and the median family income was $50,000.
History
Hollywood was first settled in the early 1800s by a group of settlers from England. The town was originally known as “Hollywood Plantation” and was home to several large plantations. The town was officially incorporated in 1883 and was named after the Hollywood Cemetery, which was established in 1820. The town was a popular destination for tourists in the late 19th and early 20th centuries, and was home to several resorts and hotels. In the late 20th century, the town experienced a decline in population as many of its residents moved to larger cities. However, in recent years, the town has seen a resurgence in population and is now home to several businesses and attractions.
Common Questions
What is Per Capita Income in Hollywood?
Per Capita income in Hollywood is $44,857.
What is the Median Family Income in Hollywood?
Median Family Income in Hollywood is $101,453.
What is the Median Household income in Hollywood?
Median Household Income in Hollywood is $77,191.
What is Income or Wage Gap in Hollywood?
Income or Wage Gap in Hollywood is 7.2%.
Women in Hollywood earn 92.8 cents for every dollar earned by a man.
What is Inequality or Gini Index in Hollywood?
Inequality or Gini Index in Hollywood is 0.51.
What is the Total Population of Hollywood?
Total Population of Hollywood is 5,397.
What is the Total Male Population of Hollywood?
Total Male Population of Hollywood is 2,652.
What is the Total Female Population of Hollywood?
Total Female Population of Hollywood is 2,745.
What is the Ratio of Males per 100 Females in Hollywood?
There are 96.61 Males per 100 Females in Hollywood.
What is the Ratio of Females per 100 Males in Hollywood?
There are 103.51 Females per 100 Males in Hollywood.
What is the Median Population Age in Hollywood?
Median Population Age in Hollywood is 53.0 Years.
What is the Average Family Size in Hollywood
Average Family Size in Hollywood is 3.2 People.
What is the Average Household Size in Hollywood
Average Household Size in Hollywood is 2.6 People.
How Large is the Labor Force in Hollywood?
There are 2,543 People in the Labor Forcein in Hollywood.
What is the Percentage of People in the Labor Force in Hollywood?
55.7% of People are in the Labor Force in Hollywood.
What is the Unemployment Rate in Hollywood?
Unemployment Rate in Hollywood is 4.8%.