Beaufort, SC Map & Demographics
Beaufort Map
Beaufort Overview
$36,267
PER CAPITA INCOME
$82,122
AVG FAMILY INCOME
$60,366
AVG HOUSEHOLD INCOME
1.0%
WAGE / INCOME GAP [ % ]
99.0¢/ $1
WAGE / INCOME GAP [ $ ]
0.46
INEQUALITY / GINI INDEX
13,582
TOTAL POPULATION
6,447
MALE POPULATION
7,135
FEMALE POPULATION
90.36
MALES / 100 FEMALES
110.67
FEMALES / 100 MALES
33.1
MEDIAN AGE
2.9
AVG FAMILY SIZE
2.3
AVG HOUSEHOLD SIZE
7,300
LABOR FORCE [ PEOPLE ]
66.0%
PERCENT IN LABOR FORCE
4.0%
UNEMPLOYMENT RATE
Beaufort Area Codes
Income in Beaufort
Income Overview in Beaufort
Per Capita Income in Beaufort is $36,267, while median incomes of families and households are $82,122 and $60,366 respectively.
| Characteristic | Number | Measure |
| Per Capita Income | 13,582 | $36,267 |
| Median Family Income | 3,304 | $82,122 |
| Mean Family Income | 3,304 | $95,540 |
| Median Household Income | 5,121 | $60,366 |
| Mean Household Income | 5,121 | $84,797 |
| Income Deficit | 3,304 | $0 |
| Wage / Income Gap (%) | 13,582 | 0.98% |
| Wage / Income Gap ($) | 13,582 | 99.02¢ per $1 |
| Gini / Inequality Index | 13,582 | 0.46 |
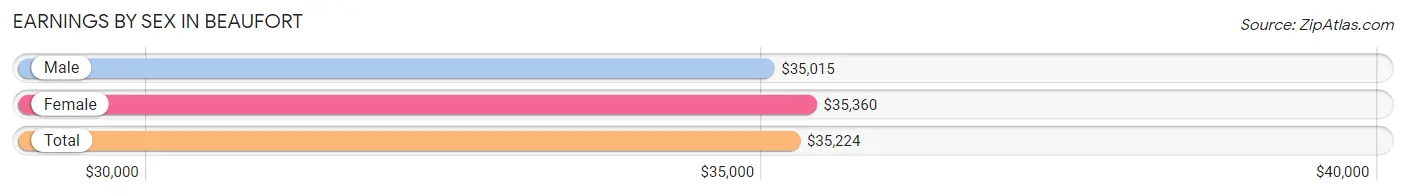
Earnings by Sex in Beaufort
Average Earnings in Beaufort are $35,224, $35,015 for men and $35,360 for women, a difference of 1.0%.
| Sex | Number | Average Earnings |
| Male | 4,309 (56.8%) | $35,015 |
| Female | 3,280 (43.2%) | $35,360 |
| Total | 7,589 (100.0%) | $35,224 |
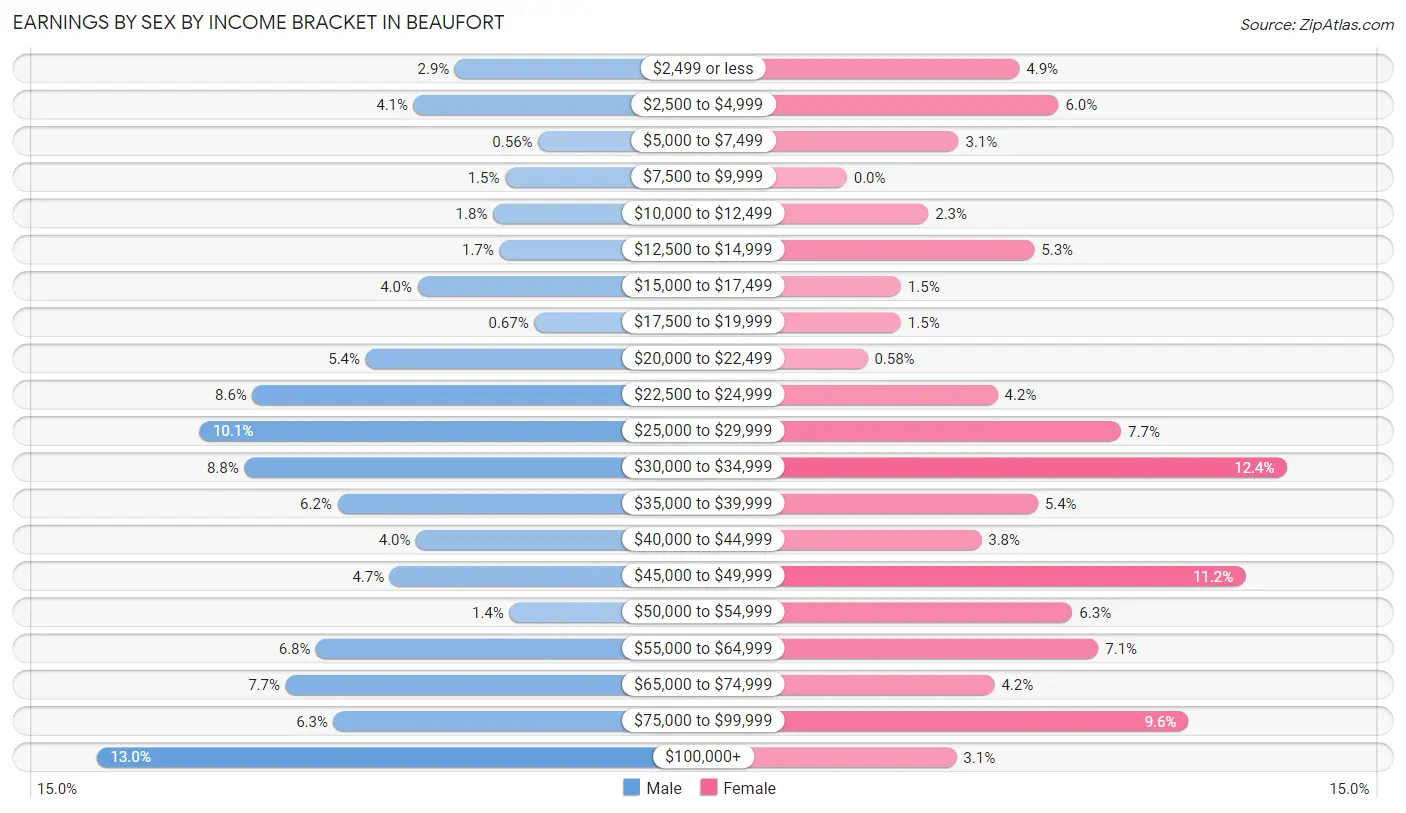
Earnings by Sex by Income Bracket in Beaufort
The most common earnings brackets in Beaufort are $100,000+ for men (558 | 13.0%) and $30,000 to $34,999 for women (405 | 12.3%).
| Income | Male | Female |
| $2,499 or less | 125 (2.9%) | 159 (4.9%) |
| $2,500 to $4,999 | 175 (4.1%) | 195 (5.9%) |
| $5,000 to $7,499 | 24 (0.6%) | 103 (3.1%) |
| $7,500 to $9,999 | 64 (1.5%) | 0 (0.0%) |
| $10,000 to $12,499 | 79 (1.8%) | 75 (2.3%) |
| $12,500 to $14,999 | 71 (1.7%) | 173 (5.3%) |
| $15,000 to $17,499 | 170 (4.0%) | 50 (1.5%) |
| $17,500 to $19,999 | 29 (0.7%) | 50 (1.5%) |
| $20,000 to $22,499 | 233 (5.4%) | 19 (0.6%) |
| $22,500 to $24,999 | 370 (8.6%) | 139 (4.2%) |
| $25,000 to $29,999 | 434 (10.1%) | 253 (7.7%) |
| $30,000 to $34,999 | 380 (8.8%) | 405 (12.3%) |
| $35,000 to $39,999 | 267 (6.2%) | 176 (5.4%) |
| $40,000 to $44,999 | 172 (4.0%) | 124 (3.8%) |
| $45,000 to $49,999 | 204 (4.7%) | 367 (11.2%) |
| $50,000 to $54,999 | 59 (1.4%) | 208 (6.3%) |
| $55,000 to $64,999 | 293 (6.8%) | 232 (7.1%) |
| $65,000 to $74,999 | 330 (7.7%) | 136 (4.2%) |
| $75,000 to $99,999 | 272 (6.3%) | 315 (9.6%) |
| $100,000+ | 558 (13.0%) | 101 (3.1%) |
| Total | 4,309 (100.0%) | 3,280 (100.0%) |
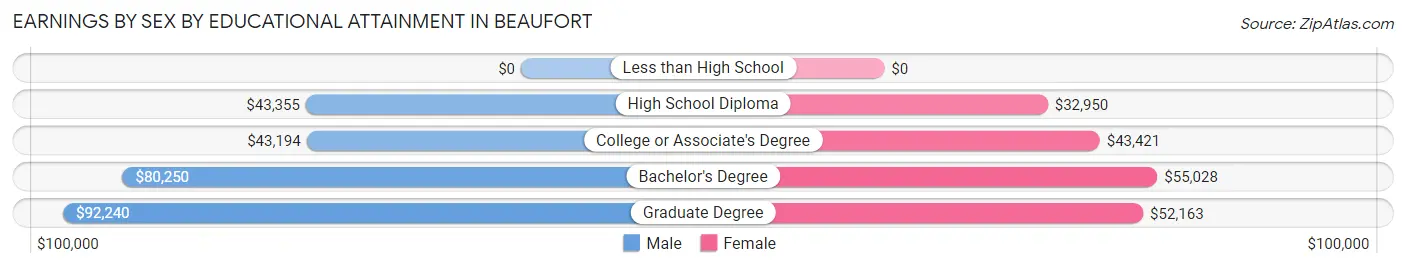
Earnings by Sex by Educational Attainment in Beaufort
Average earnings in Beaufort are $47,026 for men and $42,852 for women, a difference of 8.9%. Men with an educational attainment of graduate degree enjoy the highest average annual earnings of $92,240, while those with college or associate's degree education earn the least with $43,194. Women with an educational attainment of bachelor's degree earn the most with the average annual earnings of $55,028, while those with high school diploma education have the smallest earnings of $32,950.
| Educational Attainment | Male Income | Female Income |
| Less than High School | - | - |
| High School Diploma | $43,355 | $32,950 |
| College or Associate's Degree | $43,194 | $43,421 |
| Bachelor's Degree | $80,250 | $55,028 |
| Graduate Degree | $92,240 | $52,163 |
| Total | $47,026 | $42,852 |
Family Income in Beaufort
Family Income Brackets in Beaufort
According to the Beaufort family income data, there are 667 families falling into the $75,000 to $99,999 income range, which is the most common income bracket and makes up 20.2% of all families. Conversely, the $10,000 to $14,999 income bracket is the least frequent group with only 132 families (4.0%) belonging to this category.
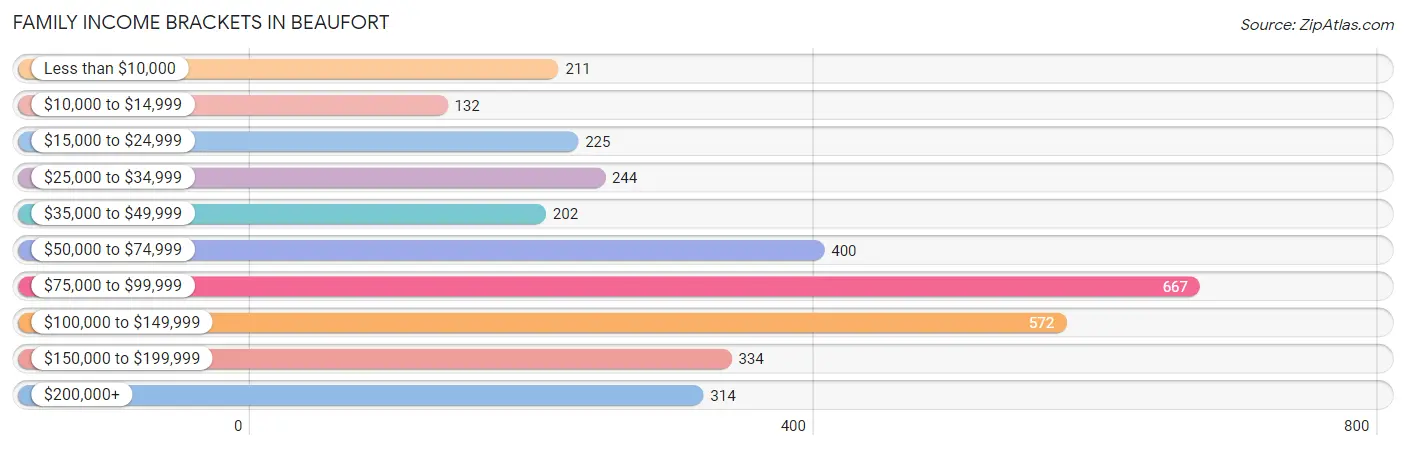
| Income Bracket | # Families | % Families |
| Less than $10,000 | 211 | 6.4% |
| $10,000 to $14,999 | 132 | 4.0% |
| $15,000 to $24,999 | 225 | 6.8% |
| $25,000 to $34,999 | 244 | 7.4% |
| $35,000 to $49,999 | 202 | 6.1% |
| $50,000 to $74,999 | 400 | 12.1% |
| $75,000 to $99,999 | 667 | 20.2% |
| $100,000 to $149,999 | 572 | 17.3% |
| $150,000 to $199,999 | 334 | 10.1% |
| $200,000+ | 314 | 9.5% |
Family Income by Famaliy Size in Beaufort
5-person families (69 | 2.1%) account for the highest median family income in Beaufort with $100,038 per family, while 2-person families (1,658 | 50.2%) have the highest median income of $45,128 per family member.
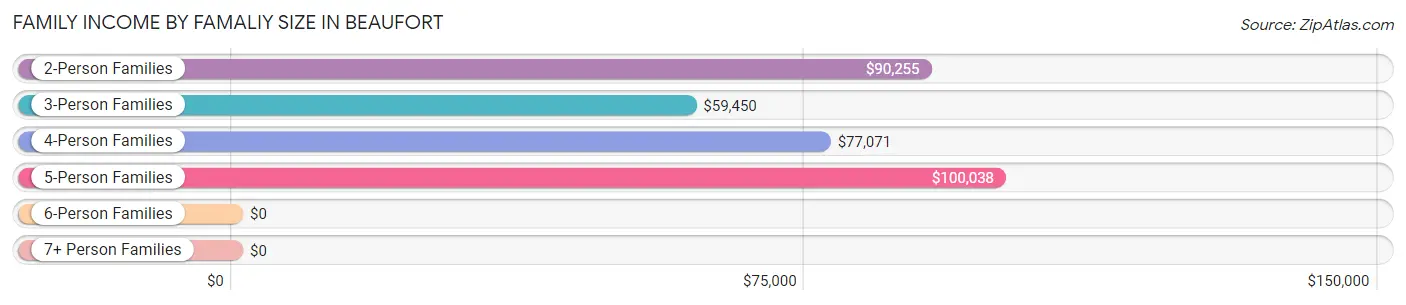
| Income Bracket | # Families | Median Income |
| 2-Person Families | 1,658 (50.2%) | $90,255 |
| 3-Person Families | 909 (27.5%) | $59,450 |
| 4-Person Families | 668 (20.2%) | $77,071 |
| 5-Person Families | 69 (2.1%) | $100,038 |
| 6-Person Families | 0 (0.0%) | $0 |
| 7+ Person Families | 0 (0.0%) | $0 |
| Total | 3,304 (100.0%) | $82,122 |
Family Income by Number of Earners in Beaufort
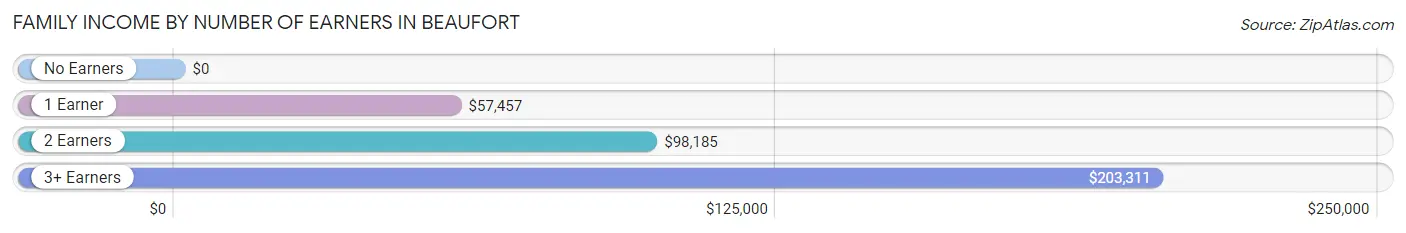
| Number of Earners | # Families | Median Income |
| No Earners | 650 (19.7%) | $0 |
| 1 Earner | 1,177 (35.6%) | $57,457 |
| 2 Earners | 1,401 (42.4%) | $98,185 |
| 3+ Earners | 76 (2.3%) | $203,311 |
| Total | 3,304 (100.0%) | $82,122 |
Household Income in Beaufort
Household Income Brackets in Beaufort
With 778 households falling in the category, the $75,000 to $99,999 income range is the most frequent in Beaufort, accounting for 15.2% of all households. In contrast, only 251 households (4.9%) fall into the $10,000 to $14,999 income bracket, making it the least populous group.
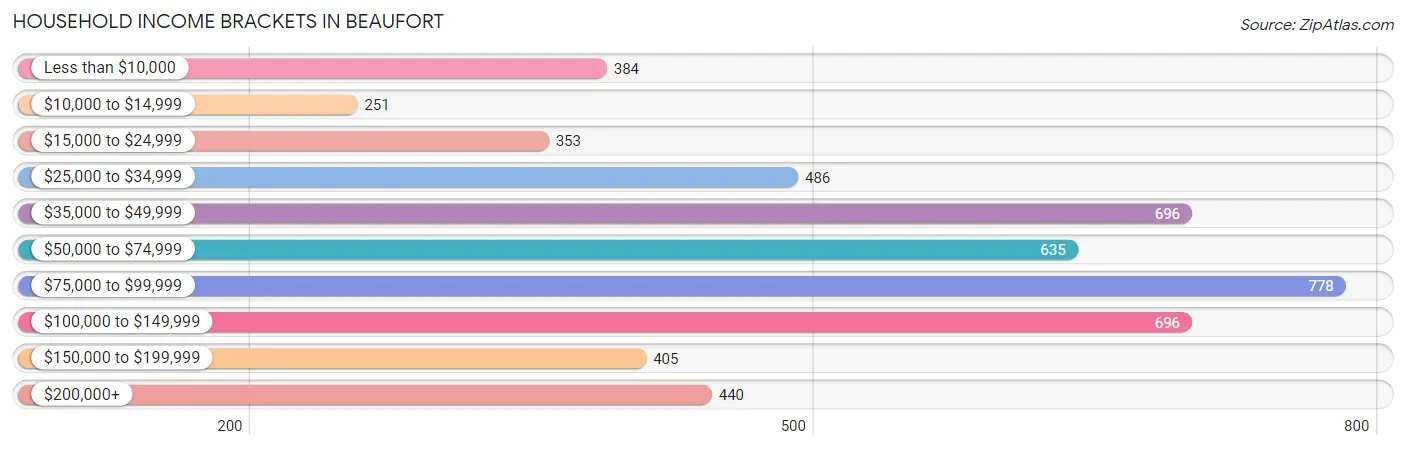
| Income Bracket | # Households | % Households |
| Less than $10,000 | 384 | 7.5% |
| $10,000 to $14,999 | 251 | 4.9% |
| $15,000 to $24,999 | 353 | 6.9% |
| $25,000 to $34,999 | 486 | 9.5% |
| $35,000 to $49,999 | 696 | 13.6% |
| $50,000 to $74,999 | 635 | 12.4% |
| $75,000 to $99,999 | 778 | 15.2% |
| $100,000 to $149,999 | 696 | 13.6% |
| $150,000 to $199,999 | 405 | 7.9% |
| $200,000+ | 440 | 8.6% |
Household Income by Householder Age in Beaufort
The median household income in Beaufort is $60,366, with the highest median household income of $85,320 found in the 65+ years age bracket for the primary householder. A total of 1,184 households (23.1%) fall into this category. Meanwhile, the 15 to 24 years age bracket for the primary householder has the lowest median household income of $27,557, with 152 households (3.0%) in this group.
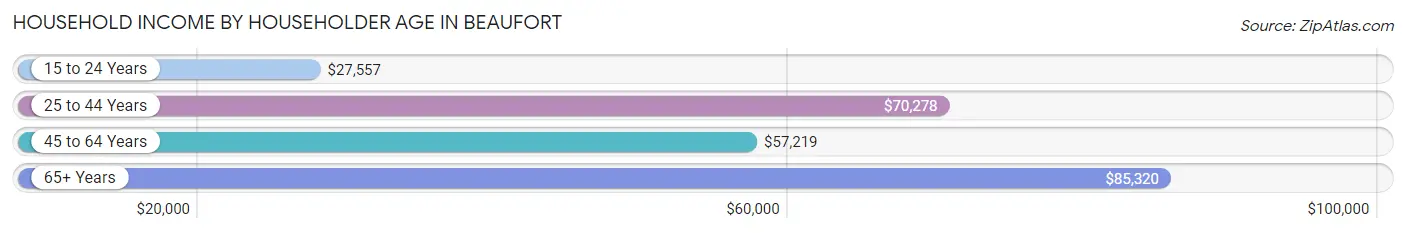
| Income Bracket | # Households | Median Income |
| 15 to 24 Years | 152 (3.0%) | $27,557 |
| 25 to 44 Years | 2,082 (40.7%) | $70,278 |
| 45 to 64 Years | 1,703 (33.3%) | $57,219 |
| 65+ Years | 1,184 (23.1%) | $85,320 |
| Total | 5,121 (100.0%) | $60,366 |
Poverty in Beaufort
Income Below Poverty by Sex and Age in Beaufort
With 15.5% poverty level for males and 22.8% for females among the residents of Beaufort, 15 year old males and 15 year old females are the most vulnerable to poverty, with 24 males (100.0%) and 24 females (52.2%) in their respective age groups living below the poverty level.
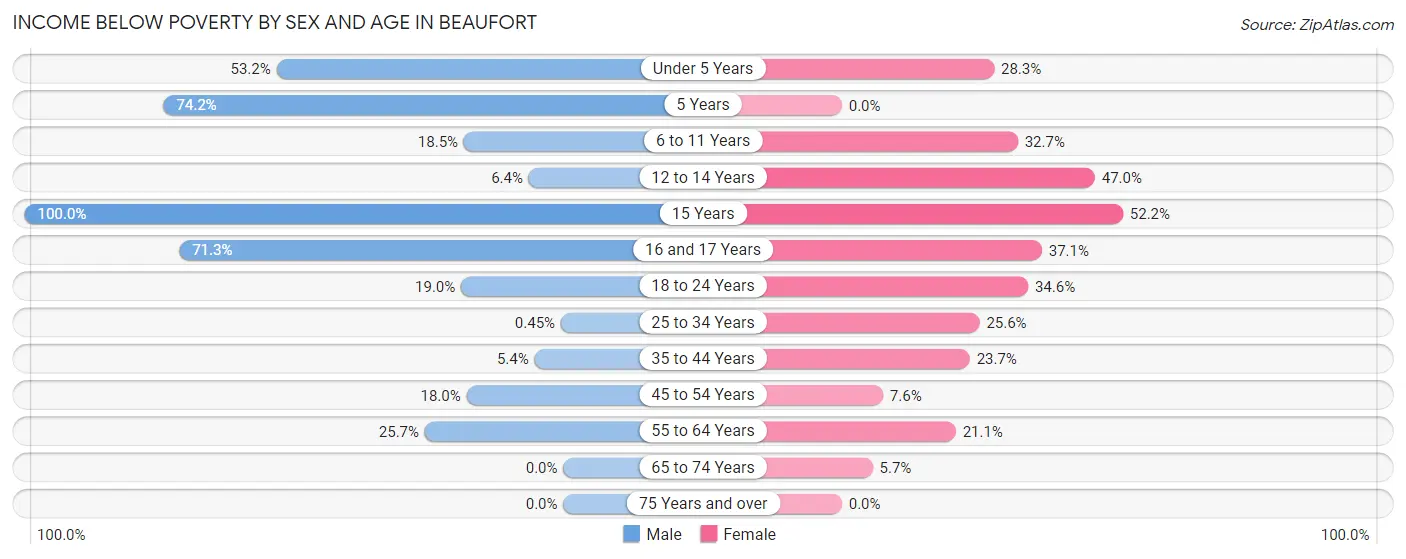
| Age Bracket | Male | Female |
| Under 5 Years | 214 (53.2%) | 182 (28.3%) |
| 5 Years | 72 (74.2%) | 0 (0.0%) |
| 6 to 11 Years | 72 (18.5%) | 162 (32.7%) |
| 12 to 14 Years | 5 (6.4%) | 162 (47.0%) |
| 15 Years | 24 (100.0%) | 24 (52.2%) |
| 16 and 17 Years | 77 (71.3%) | 75 (37.1%) |
| 18 to 24 Years | 41 (19.0%) | 160 (34.6%) |
| 25 to 34 Years | 6 (0.4%) | 335 (25.6%) |
| 35 to 44 Years | 28 (5.3%) | 151 (23.7%) |
| 45 to 54 Years | 92 (18.0%) | 39 (7.6%) |
| 55 to 64 Years | 153 (25.7%) | 267 (21.1%) |
| 65 to 74 Years | 0 (0.0%) | 37 (5.7%) |
| 75 Years and over | 0 (0.0%) | 0 (0.0%) |
| Total | 784 (15.5%) | 1,594 (22.8%) |
Income Above Poverty by Sex and Age in Beaufort
According to the poverty statistics in Beaufort, males aged 65 to 74 years and females aged 75 years and over are the age groups that are most secure financially, with 100.0% of males and 100.0% of females in these age groups living above the poverty line.
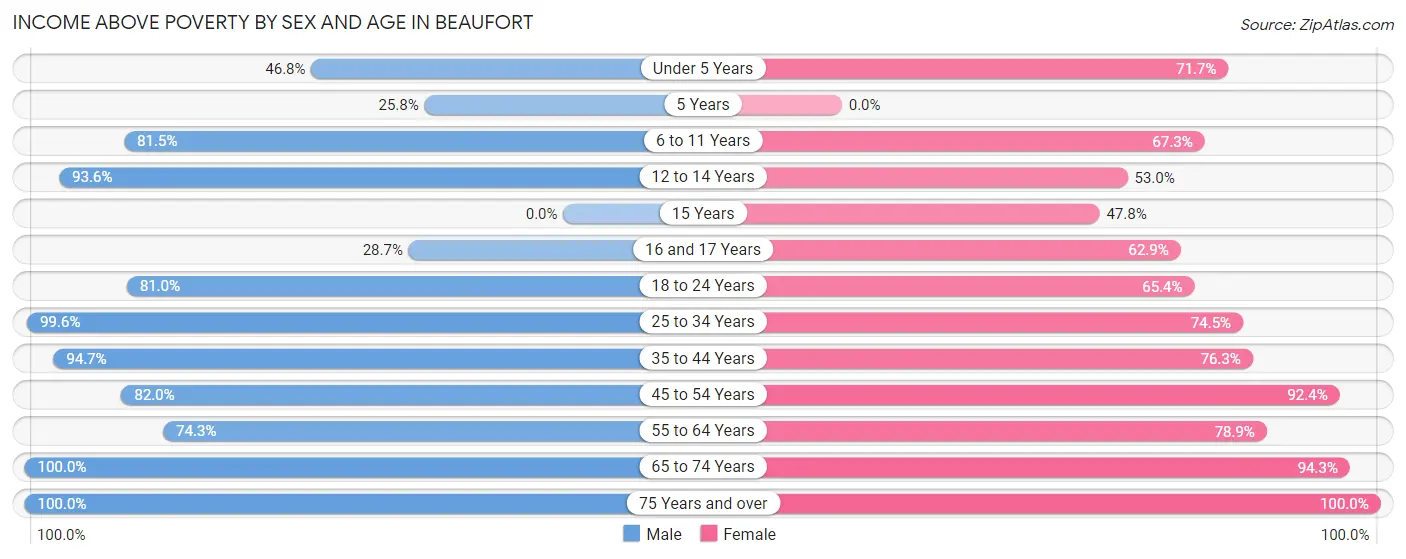
| Age Bracket | Male | Female |
| Under 5 Years | 188 (46.8%) | 462 (71.7%) |
| 5 Years | 25 (25.8%) | 0 (0.0%) |
| 6 to 11 Years | 318 (81.5%) | 334 (67.3%) |
| 12 to 14 Years | 73 (93.6%) | 183 (53.0%) |
| 15 Years | 0 (0.0%) | 22 (47.8%) |
| 16 and 17 Years | 31 (28.7%) | 127 (62.9%) |
| 18 to 24 Years | 175 (81.0%) | 303 (65.4%) |
| 25 to 34 Years | 1,342 (99.6%) | 976 (74.5%) |
| 35 to 44 Years | 495 (94.7%) | 485 (76.3%) |
| 45 to 54 Years | 420 (82.0%) | 472 (92.4%) |
| 55 to 64 Years | 442 (74.3%) | 996 (78.9%) |
| 65 to 74 Years | 428 (100.0%) | 611 (94.3%) |
| 75 Years and over | 351 (100.0%) | 440 (100.0%) |
| Total | 4,288 (84.5%) | 5,411 (77.2%) |
Income Below Poverty Among Married-Couple Families in Beaufort
The poverty statistics for married-couple families in Beaufort show that 5.9% or 124 of the total 2,085 families live below the poverty line. Families with 3 or 4 children have the highest poverty rate of 13.0%, comprising of 9 families. On the other hand, families with 1 or 2 children have the lowest poverty rate of 4.4%, which includes 33 families.
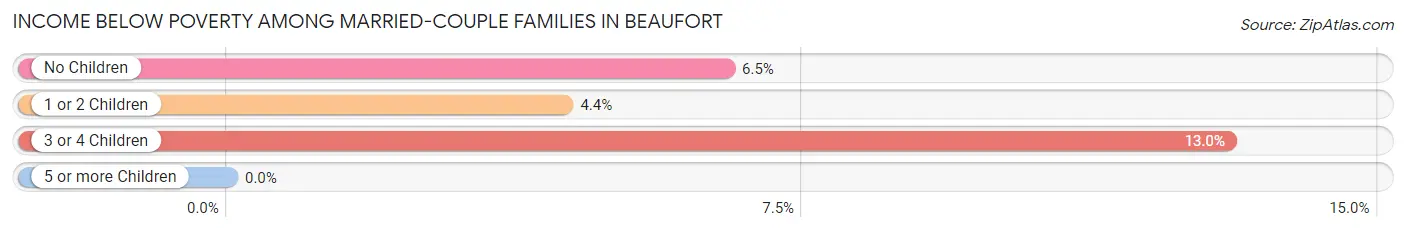
| Children | Above Poverty | Below Poverty |
| No Children | 1,181 (93.5%) | 82 (6.5%) |
| 1 or 2 Children | 720 (95.6%) | 33 (4.4%) |
| 3 or 4 Children | 60 (87.0%) | 9 (13.0%) |
| 5 or more Children | 0 (0.0%) | 0 (0.0%) |
| Total | 1,961 (94.1%) | 124 (5.9%) |
Income Below Poverty Among Single-Parent Households in Beaufort
According to the poverty data in Beaufort, 35.8% or 34 single-father households and 39.2% or 441 single-mother households are living below the poverty line. Among single-father households, those with no children have the highest poverty rate, with 34 households (60.7%) experiencing poverty. Likewise, among single-mother households, those with 3 or 4 children have the highest poverty rate, with 179 households (84.4%) falling below the poverty line.
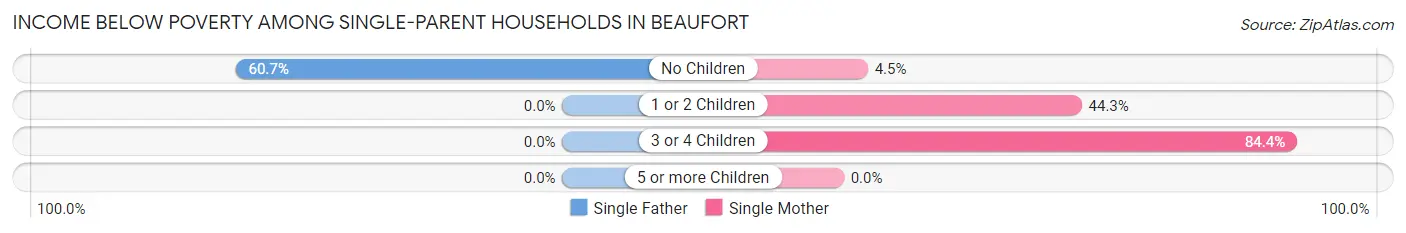
| Children | Single Father | Single Mother |
| No Children | 34 (60.7%) | 16 (4.5%) |
| 1 or 2 Children | 0 (0.0%) | 246 (44.3%) |
| 3 or 4 Children | 0 (0.0%) | 179 (84.4%) |
| 5 or more Children | 0 (0.0%) | 0 (0.0%) |
| Total | 34 (35.8%) | 441 (39.2%) |
Income Below Poverty Among Married-Couple vs Single-Parent Households in Beaufort
The poverty data for Beaufort shows that 124 of the married-couple family households (5.9%) and 475 of the single-parent households (39.0%) are living below the poverty level. Within the married-couple family households, those with 3 or 4 children have the highest poverty rate, with 9 households (13.0%) falling below the poverty line. Among the single-parent households, those with 3 or 4 children have the highest poverty rate, with 179 household (84.4%) living below poverty.
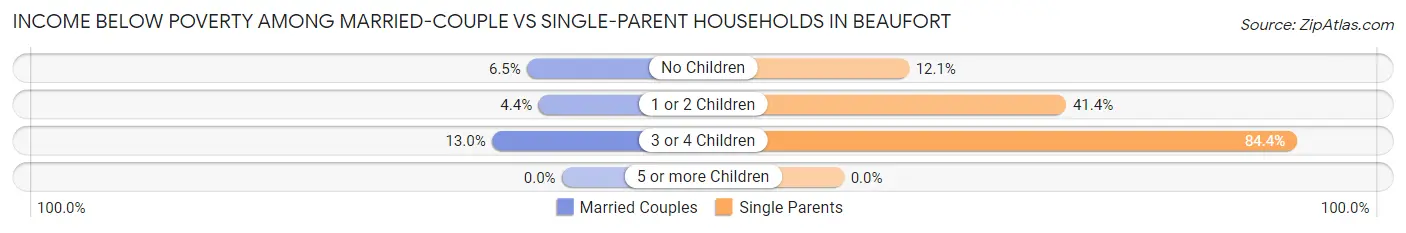
| Children | Married-Couple Families | Single-Parent Households |
| No Children | 82 (6.5%) | 50 (12.1%) |
| 1 or 2 Children | 33 (4.4%) | 246 (41.4%) |
| 3 or 4 Children | 9 (13.0%) | 179 (84.4%) |
| 5 or more Children | 0 (0.0%) | 0 (0.0%) |
| Total | 124 (5.9%) | 475 (39.0%) |
Race in Beaufort
The most populous races in Beaufort are White / Caucasian (8,644 | 63.6%), Black / African American (3,858 | 28.4%), and Hispanic or Latino (774 | 5.7%).
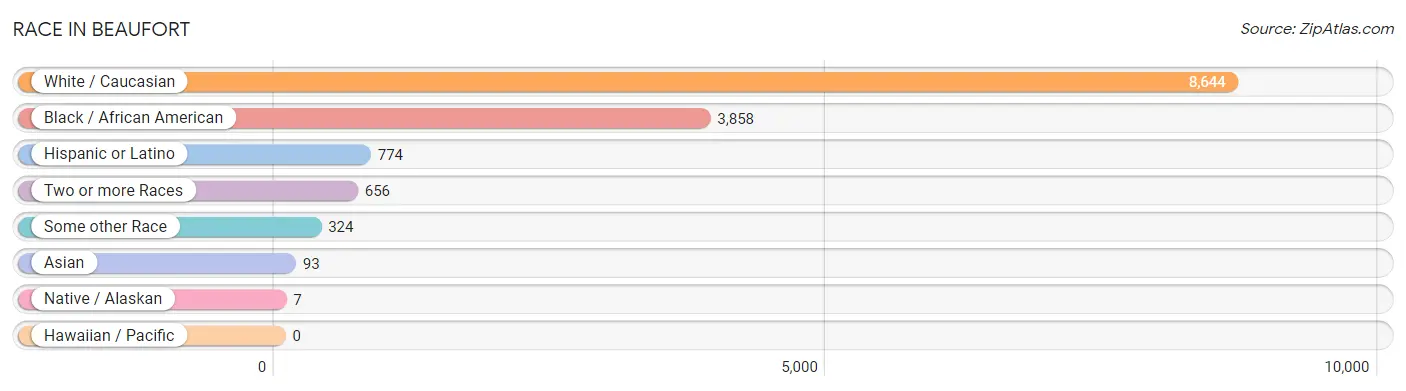
| Race | # Population | % Population |
| Asian | 93 | 0.7% |
| Black / African American | 3,858 | 28.4% |
| Hawaiian / Pacific | 0 | 0.0% |
| Hispanic or Latino | 774 | 5.7% |
| Native / Alaskan | 7 | 0.1% |
| White / Caucasian | 8,644 | 63.6% |
| Two or more Races | 656 | 4.8% |
| Some other Race | 324 | 2.4% |
| Total | 13,582 | 100.0% |
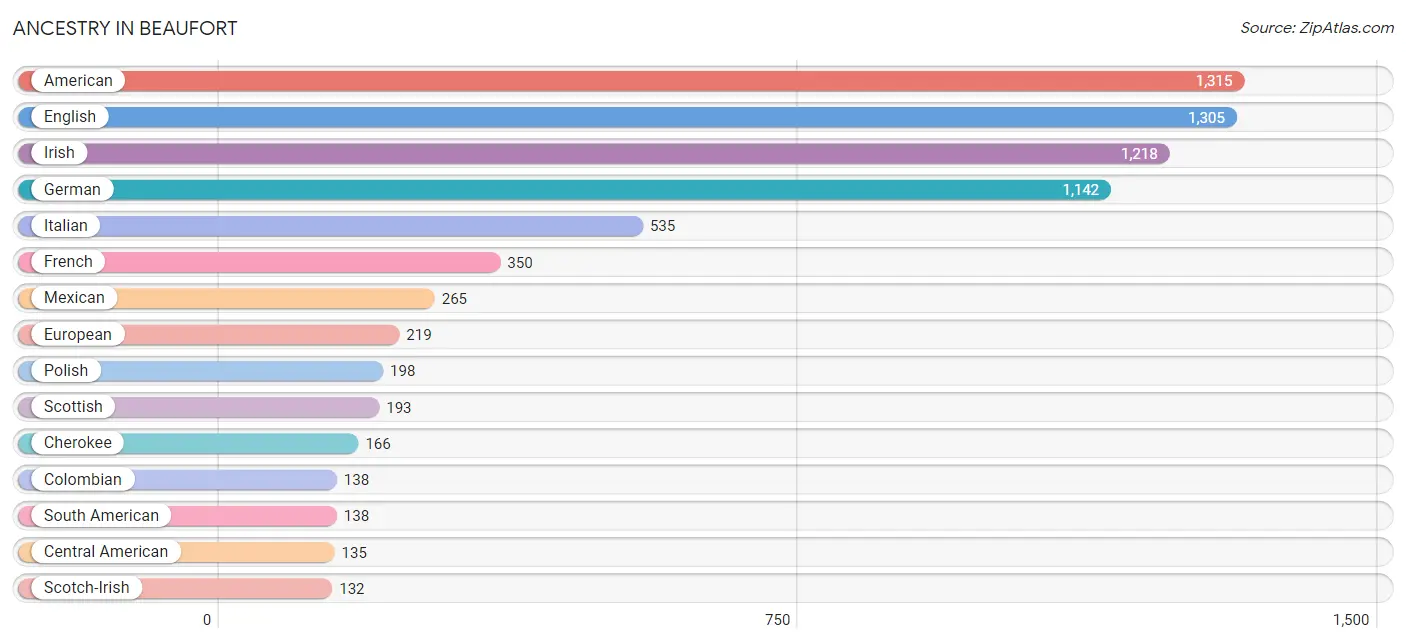
Ancestry in Beaufort
The most populous ancestries reported in Beaufort are American (1,315 | 9.7%), English (1,305 | 9.6%), Irish (1,218 | 9.0%), German (1,142 | 8.4%), and Italian (535 | 3.9%), together accounting for 40.6% of all Beaufort residents.
| Ancestry | # Population | % Population |
| African | 5 | 0.0% |
| American | 1,315 | 9.7% |
| Arab | 6 | 0.0% |
| Armenian | 11 | 0.1% |
| Australian | 14 | 0.1% |
| Bahamian | 11 | 0.1% |
| Bangladeshi | 39 | 0.3% |
| Belgian | 5 | 0.0% |
| Bermudan | 16 | 0.1% |
| Bhutanese | 31 | 0.2% |
| British | 65 | 0.5% |
| Bulgarian | 20 | 0.2% |
| Burmese | 14 | 0.1% |
| Central American | 135 | 1.0% |
| Cherokee | 166 | 1.2% |
| Colombian | 138 | 1.0% |
| Costa Rican | 3 | 0.0% |
| Cuban | 89 | 0.7% |
| Dominican | 18 | 0.1% |
| Dutch | 71 | 0.5% |
| English | 1,305 | 9.6% |
| European | 219 | 1.6% |
| Finnish | 9 | 0.1% |
| French | 350 | 2.6% |
| French Canadian | 107 | 0.8% |
| German | 1,142 | 8.4% |
| Greek | 72 | 0.5% |
| Guatemalan | 7 | 0.1% |
| Haitian | 11 | 0.1% |
| Honduran | 6 | 0.0% |
| Indian (Asian) | 8 | 0.1% |
| Iranian | 16 | 0.1% |
| Irish | 1,218 | 9.0% |
| Israeli | 5 | 0.0% |
| Italian | 535 | 3.9% |
| Jamaican | 16 | 0.1% |
| Korean | 75 | 0.5% |
| Lebanese | 6 | 0.0% |
| Lithuanian | 28 | 0.2% |
| Lumbee | 5 | 0.0% |
| Maltese | 23 | 0.2% |
| Mexican | 265 | 1.9% |
| Native Hawaiian | 49 | 0.4% |
| Nicaraguan | 48 | 0.4% |
| Northern European | 10 | 0.1% |
| Norwegian | 37 | 0.3% |
| Polish | 198 | 1.5% |
| Portuguese | 43 | 0.3% |
| Puerto Rican | 111 | 0.8% |
| Romanian | 54 | 0.4% |
| Russian | 9 | 0.1% |
| Salvadoran | 71 | 0.5% |
| Scandinavian | 126 | 0.9% |
| Scotch-Irish | 132 | 1.0% |
| Scottish | 193 | 1.4% |
| Slovak | 8 | 0.1% |
| South American | 138 | 1.0% |
| Sri Lankan | 3 | 0.0% |
| Subsaharan African | 39 | 0.3% |
| Sudanese | 34 | 0.3% |
| Swedish | 35 | 0.3% |
| Thai | 5 | 0.0% |
| Welsh | 28 | 0.2% |
| West Indian | 62 | 0.5% | View All 64 Rows |
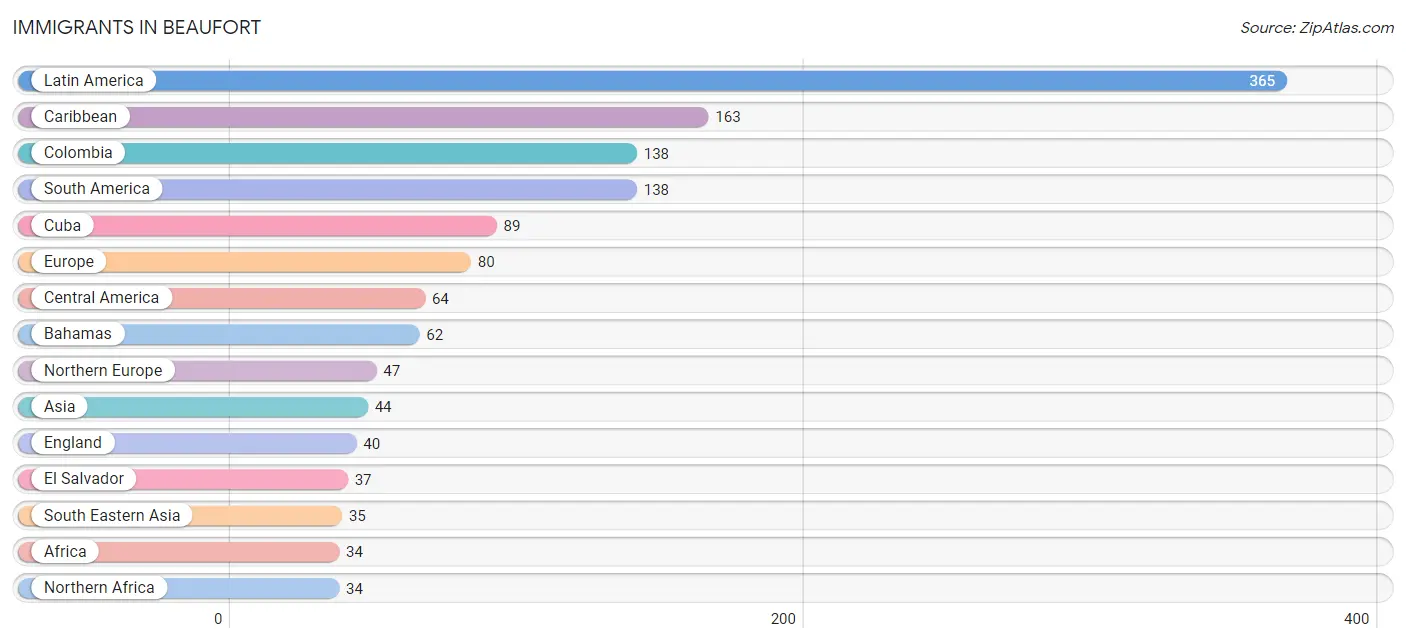
Immigrants in Beaufort
The most numerous immigrant groups reported in Beaufort came from Latin America (365 | 2.7%), Caribbean (163 | 1.2%), Colombia (138 | 1.0%), South America (138 | 1.0%), and Cuba (89 | 0.7%), together accounting for 6.6% of all Beaufort residents.
| Immigration Origin | # Population | % Population |
| Africa | 34 | 0.3% |
| Asia | 44 | 0.3% |
| Australia | 22 | 0.2% |
| Bahamas | 62 | 0.5% |
| Caribbean | 163 | 1.2% |
| Central America | 64 | 0.5% |
| Colombia | 138 | 1.0% |
| Cuba | 89 | 0.7% |
| Eastern Asia | 9 | 0.1% |
| Eastern Europe | 26 | 0.2% |
| El Salvador | 37 | 0.3% |
| England | 40 | 0.3% |
| Europe | 80 | 0.6% |
| France | 7 | 0.1% |
| Guatemala | 3 | 0.0% |
| Jamaica | 7 | 0.1% |
| Korea | 9 | 0.1% |
| Latin America | 365 | 2.7% |
| Mexico | 10 | 0.1% |
| Nicaragua | 14 | 0.1% |
| Northern Africa | 34 | 0.3% |
| Northern Europe | 47 | 0.4% |
| Oceania | 22 | 0.2% |
| Philippines | 32 | 0.2% |
| Romania | 26 | 0.2% |
| South America | 138 | 1.0% |
| South Eastern Asia | 35 | 0.3% |
| Sudan | 34 | 0.3% |
| Trinidad and Tobago | 5 | 0.0% |
| Vietnam | 3 | 0.0% |
| Western Europe | 7 | 0.1% | View All 31 Rows |
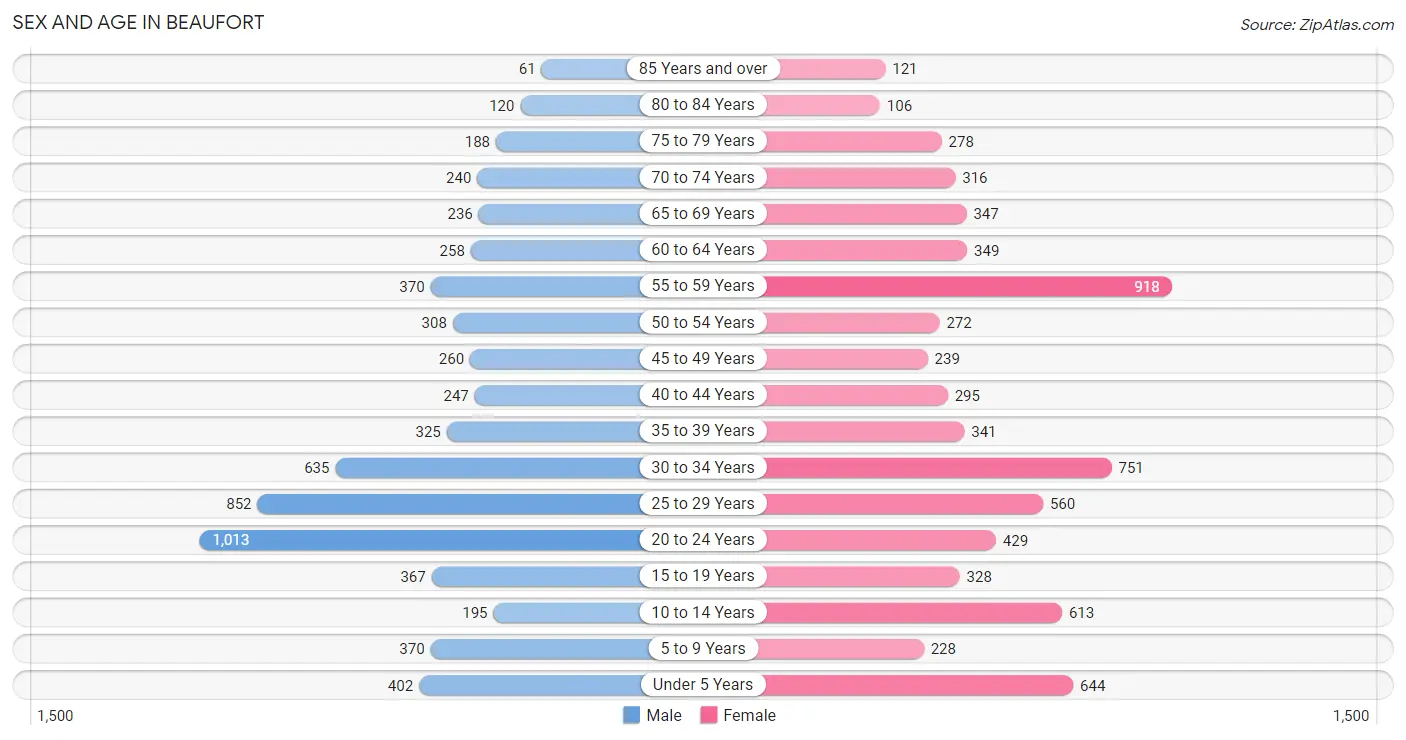
Sex and Age in Beaufort
Sex and Age in Beaufort
The most populous age groups in Beaufort are 20 to 24 Years (1,013 | 15.7%) for men and 55 to 59 Years (918 | 12.9%) for women.
| Age Bracket | Male | Female |
| Under 5 Years | 402 (6.2%) | 644 (9.0%) |
| 5 to 9 Years | 370 (5.7%) | 228 (3.2%) |
| 10 to 14 Years | 195 (3.0%) | 613 (8.6%) |
| 15 to 19 Years | 367 (5.7%) | 328 (4.6%) |
| 20 to 24 Years | 1,013 (15.7%) | 429 (6.0%) |
| 25 to 29 Years | 852 (13.2%) | 560 (7.9%) |
| 30 to 34 Years | 635 (9.9%) | 751 (10.5%) |
| 35 to 39 Years | 325 (5.0%) | 341 (4.8%) |
| 40 to 44 Years | 247 (3.8%) | 295 (4.1%) |
| 45 to 49 Years | 260 (4.0%) | 239 (3.4%) |
| 50 to 54 Years | 308 (4.8%) | 272 (3.8%) |
| 55 to 59 Years | 370 (5.7%) | 918 (12.9%) |
| 60 to 64 Years | 258 (4.0%) | 349 (4.9%) |
| 65 to 69 Years | 236 (3.7%) | 347 (4.9%) |
| 70 to 74 Years | 240 (3.7%) | 316 (4.4%) |
| 75 to 79 Years | 188 (2.9%) | 278 (3.9%) |
| 80 to 84 Years | 120 (1.9%) | 106 (1.5%) |
| 85 Years and over | 61 (0.9%) | 121 (1.7%) |
| Total | 6,447 (100.0%) | 7,135 (100.0%) |
Families and Households in Beaufort
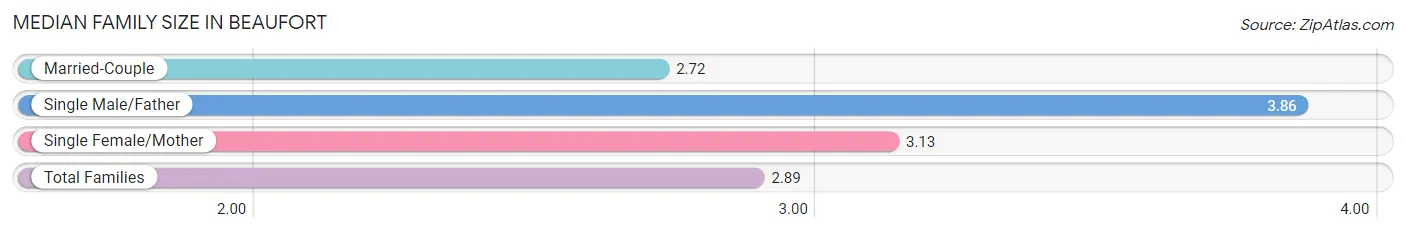
Median Family Size in Beaufort
The median family size in Beaufort is 2.89 persons per family, with single male/father families (95 | 2.9%) accounting for the largest median family size of 3.86 persons per family. On the other hand, married-couple families (2,085 | 63.1%) represent the smallest median family size with 2.72 persons per family.
| Family Type | # Families | Family Size |
| Married-Couple | 2,085 (63.1%) | 2.72 |
| Single Male/Father | 95 (2.9%) | 3.86 |
| Single Female/Mother | 1,124 (34.0%) | 3.13 |
| Total Families | 3,304 (100.0%) | 2.89 |
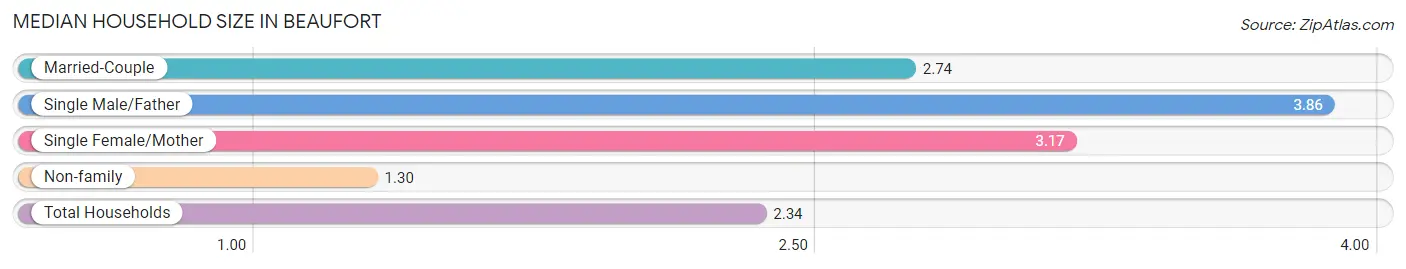
Median Household Size in Beaufort
The median household size in Beaufort is 2.34 persons per household, with single male/father households (95 | 1.9%) accounting for the largest median household size of 3.86 persons per household. non-family households (1,817 | 35.5%) represent the smallest median household size with 1.30 persons per household.
| Household Type | # Households | Household Size |
| Married-Couple | 2,085 (40.7%) | 2.74 |
| Single Male/Father | 95 (1.9%) | 3.86 |
| Single Female/Mother | 1,124 (22.0%) | 3.17 |
| Non-family | 1,817 (35.5%) | 1.30 |
| Total Households | 5,121 (100.0%) | 2.34 |
Household Size by Marriage Status in Beaufort
Out of a total of 5,121 households in Beaufort, 3,304 (64.5%) are family households, while 1,817 (35.5%) are nonfamily households. The most numerous type of family households are 2-person households, comprising 1,617, and the most common type of nonfamily households are 1-person households, comprising 1,475.
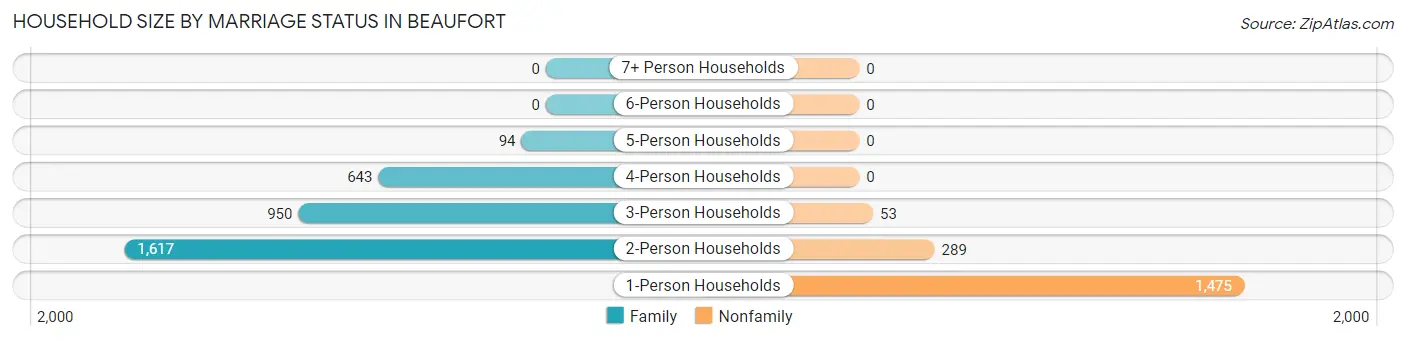
| Household Size | Family Households | Nonfamily Households |
| 1-Person Households | - | 1,475 (28.8%) |
| 2-Person Households | 1,617 (31.6%) | 289 (5.6%) |
| 3-Person Households | 950 (18.5%) | 53 (1.0%) |
| 4-Person Households | 643 (12.6%) | 0 (0.0%) |
| 5-Person Households | 94 (1.8%) | 0 (0.0%) |
| 6-Person Households | 0 (0.0%) | 0 (0.0%) |
| 7+ Person Households | 0 (0.0%) | 0 (0.0%) |
| Total | 3,304 (64.5%) | 1,817 (35.5%) |
Female Fertility in Beaufort
Fertility by Age in Beaufort
Average fertility rate in Beaufort is 48.0 births per 1,000 women. Women in the age bracket of 20 to 34 years have the highest fertility rate with 59.0 births per 1,000 women. Women in the age bracket of 20 to 34 years acount for 70.3% of all women with births.
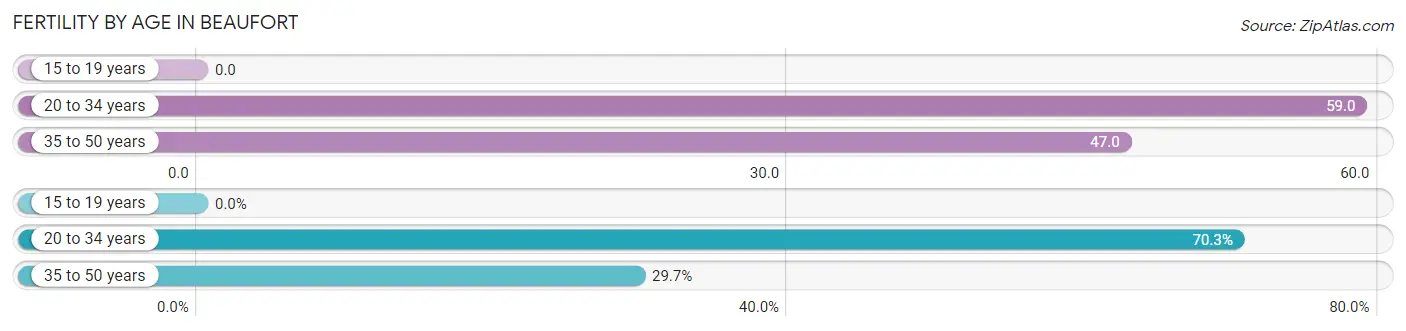
| Age Bracket | Women with Births | Births / 1,000 Women |
| 15 to 19 years | 0 (0.0%) | 0.0 |
| 20 to 34 years | 102 (70.3%) | 59.0 |
| 35 to 50 years | 43 (29.7%) | 47.0 |
| Total | 145 (100.0%) | 48.0 |
Fertility by Age by Marriage Status in Beaufort
42.1% of women with births (145) in Beaufort are married. The highest percentage of unmarried women with births falls into 20 to 34 years age bracket with 82.4% of them unmarried at the time of birth, while the lowest percentage of unmarried women with births belong to 35 to 50 years age bracket with 0.0% of them unmarried.
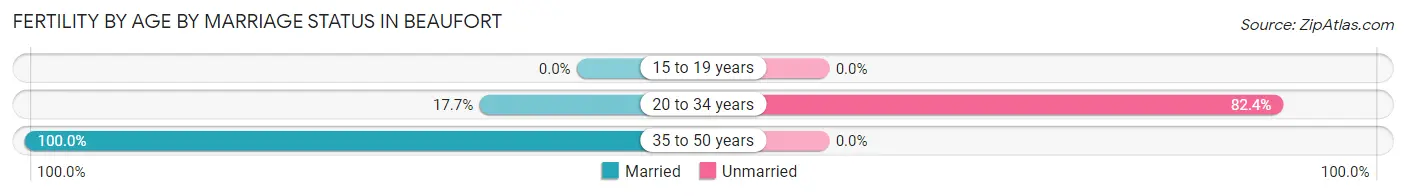
| Age Bracket | Married | Unmarried |
| 15 to 19 years | 0 (0.0%) | 0 (0.0%) |
| 20 to 34 years | 18 (17.6%) | 84 (82.4%) |
| 35 to 50 years | 43 (100.0%) | 0 (0.0%) |
| Total | 61 (42.1%) | 84 (57.9%) |
Fertility by Education in Beaufort
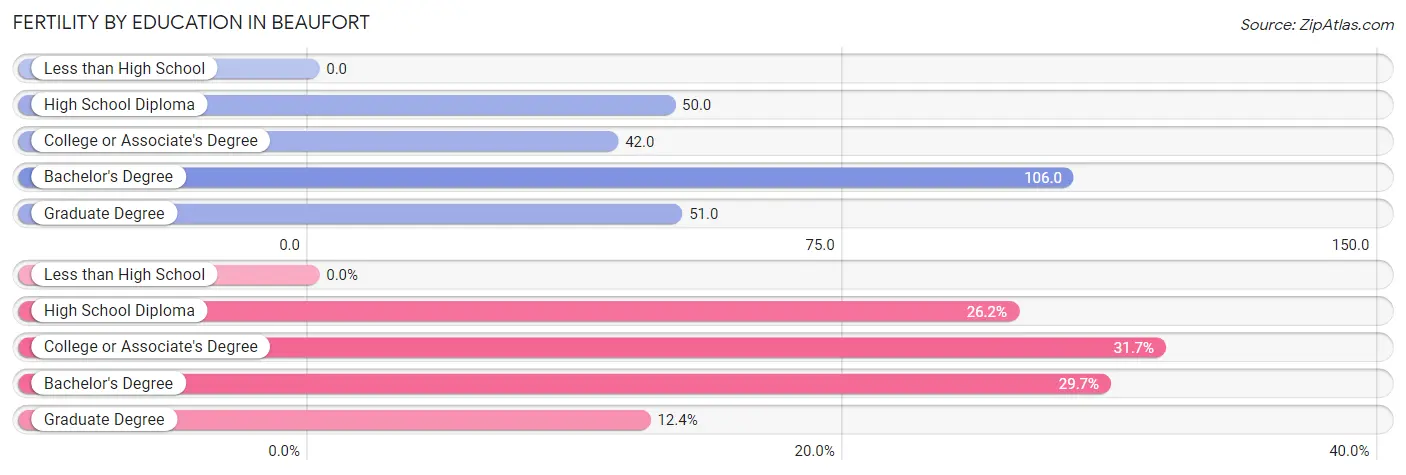
| Educational Attainment | Women with Births | Births / 1,000 Women |
| Less than High School | 0 (0.0%) | 0.0 |
| High School Diploma | 38 (26.2%) | 50.0 |
| College or Associate's Degree | 46 (31.7%) | 42.0 |
| Bachelor's Degree | 43 (29.7%) | 106.0 |
| Graduate Degree | 18 (12.4%) | 51.0 |
| Total | 145 (100.0%) | 48.0 |
Fertility by Education by Marriage Status in Beaufort
57.9% of women with births in Beaufort are unmarried. Women with the educational attainment of bachelor's degree are most likely to be married with 100.0% of them married at childbirth, while women with the educational attainment of high school diploma are least likely to be married with 100.0% of them unmarried at childbirth.
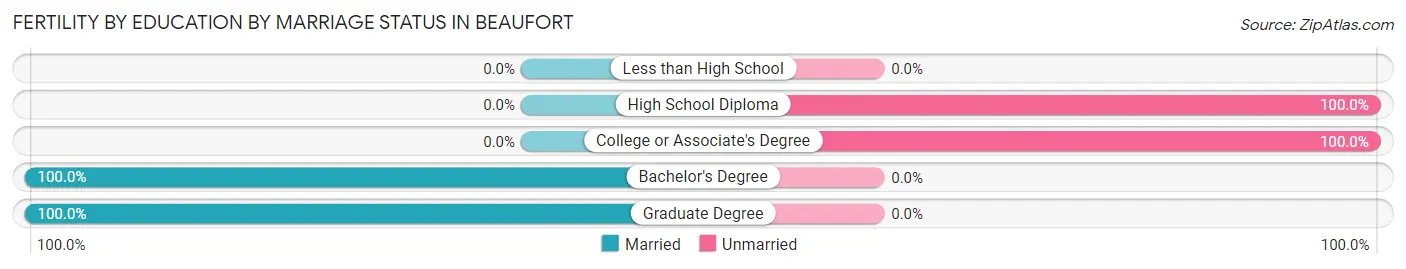
| Educational Attainment | Married | Unmarried |
| Less than High School | 0 (0.0%) | 0 (0.0%) |
| High School Diploma | 0 (0.0%) | 38 (100.0%) |
| College or Associate's Degree | 0 (0.0%) | 46 (100.0%) |
| Bachelor's Degree | 43 (100.0%) | 0 (0.0%) |
| Graduate Degree | 18 (100.0%) | 0 (0.0%) |
| Total | 61 (42.1%) | 84 (57.9%) |
Employment Characteristics in Beaufort
Employment by Class of Employer in Beaufort
Among the 6,934 employed individuals in Beaufort, private company employees (3,361 | 48.5%), federal government employees (1,553 | 22.4%), and self-employed (not incorporated) (728 | 10.5%) make up the most common classes of employment.
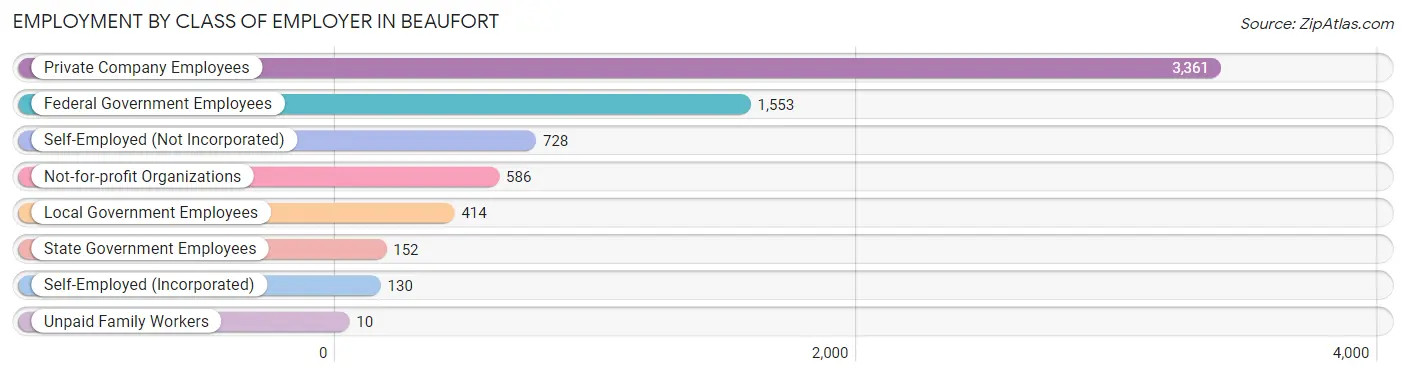
| Employer Class | # Employees | % Employees |
| Private Company Employees | 3,361 | 48.5% |
| Self-Employed (Incorporated) | 130 | 1.9% |
| Self-Employed (Not Incorporated) | 728 | 10.5% |
| Not-for-profit Organizations | 586 | 8.5% |
| Local Government Employees | 414 | 6.0% |
| State Government Employees | 152 | 2.2% |
| Federal Government Employees | 1,553 | 22.4% |
| Unpaid Family Workers | 10 | 0.1% |
| Total | 6,934 | 100.0% |
Employment Status by Age in Beaufort
According to the labor force statistics for Beaufort, out of the total population over 16 years of age (11,060), 66.0% or 7,300 individuals are in the labor force, with 4.0% or 292 of them unemployed. The age group with the highest labor force participation rate is 25 to 29 years, with 96.6% or 1,364 individuals in the labor force. Within the labor force, the 20 to 24 years age range has the highest percentage of unemployed individuals, with 9.8% or 120 of them being unemployed.
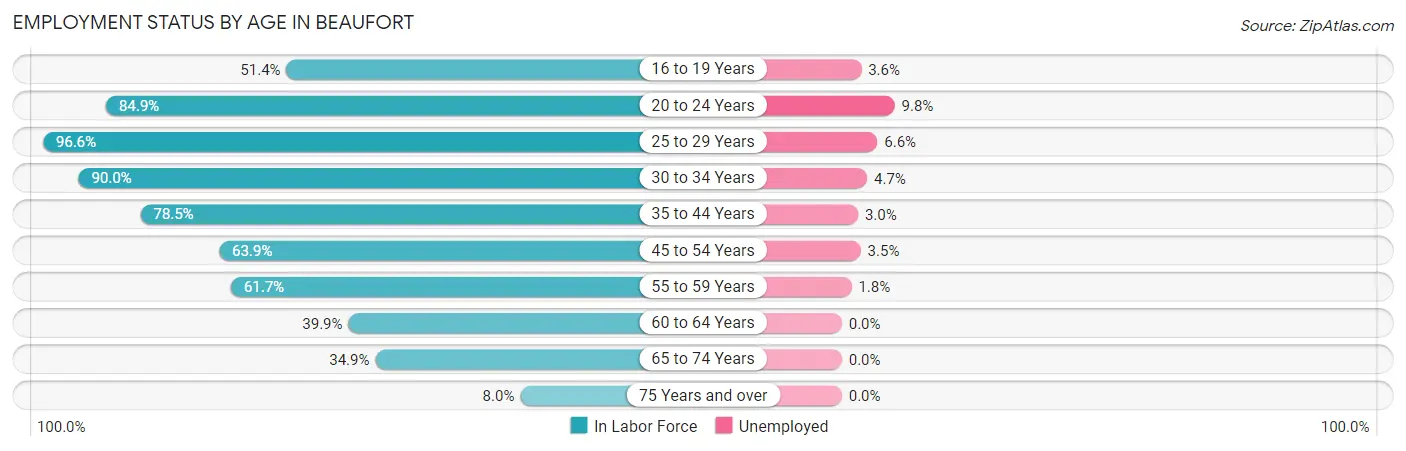
| Age Bracket | In Labor Force | Unemployed |
| 16 to 19 Years | 321 (51.4%) | 12 (3.6%) |
| 20 to 24 Years | 1,224 (84.9%) | 120 (9.8%) |
| 25 to 29 Years | 1,364 (96.6%) | 90 (6.6%) |
| 30 to 34 Years | 1,247 (90.0%) | 59 (4.7%) |
| 35 to 44 Years | 948 (78.5%) | 28 (3.0%) |
| 45 to 54 Years | 689 (63.9%) | 24 (3.5%) |
| 55 to 59 Years | 795 (61.7%) | 14 (1.8%) |
| 60 to 64 Years | 242 (39.9%) | 0 (0.0%) |
| 65 to 74 Years | 398 (34.9%) | 0 (0.0%) |
| 75 Years and over | 70 (8.0%) | 0 (0.0%) |
| Total | 7,300 (66.0%) | 292 (4.0%) |
Employment Status by Educational Attainment in Beaufort
According to labor force statistics for Beaufort, 75.7% of individuals (5,284) out of the total population between 25 and 64 years of age (6,980) are in the labor force, with 4.0% or 211 of them being unemployed. The group with the highest labor force participation rate are those with the educational attainment of college / associate degree, with 81.0% or 2,118 individuals in the labor force. Within the labor force, individuals with bachelor's degree or higher education have the highest percentage of unemployment, with 6.6% or 121 of them being unemployed.
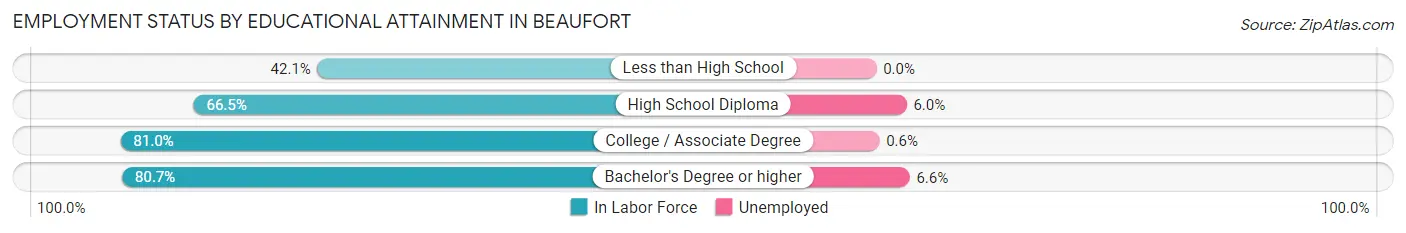
| Educational Attainment | In Labor Force | Unemployed |
| Less than High School | 101 (42.1%) | 0 (0.0%) |
| High School Diploma | 1,236 (66.5%) | 112 (6.0%) |
| College / Associate Degree | 2,118 (81.0%) | 16 (0.6%) |
| Bachelor's Degree or higher | 1,829 (80.7%) | 150 (6.6%) |
| Total | 5,284 (75.7%) | 279 (4.0%) |
Employment Occupations by Sex in Beaufort
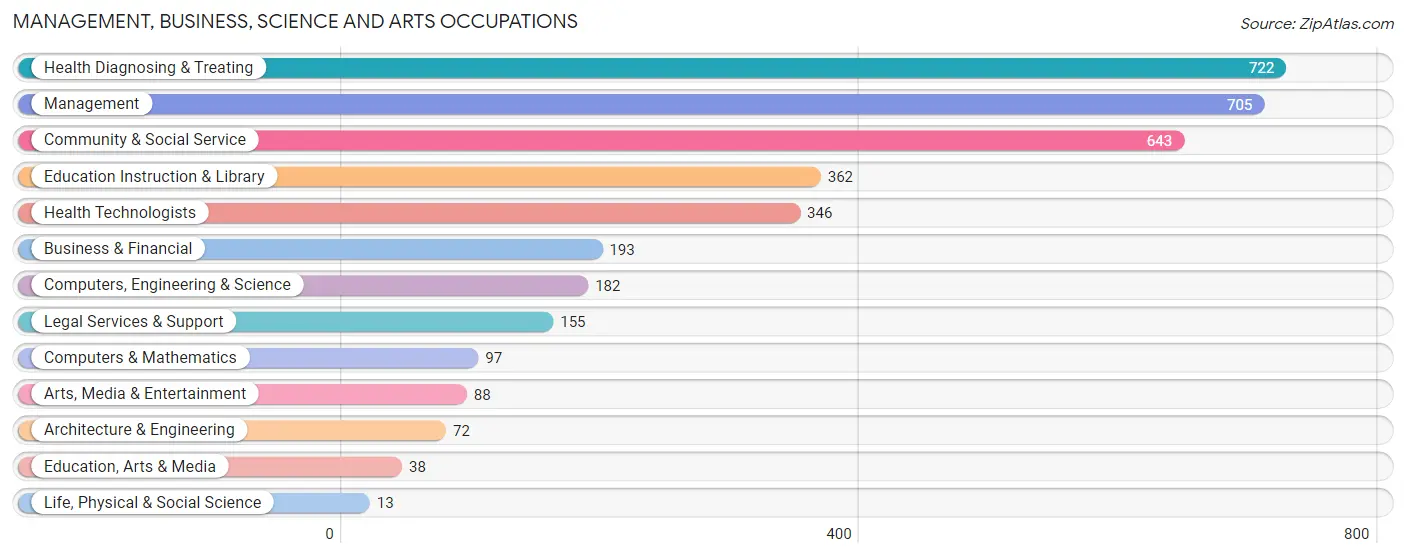
Management, Business, Science and Arts Occupations
The most common Management, Business, Science and Arts occupations in Beaufort are Health Diagnosing & Treating (722 | 12.7%), Management (705 | 12.4%), Community & Social Service (643 | 11.3%), Education Instruction & Library (362 | 6.4%), and Health Technologists (346 | 6.1%).
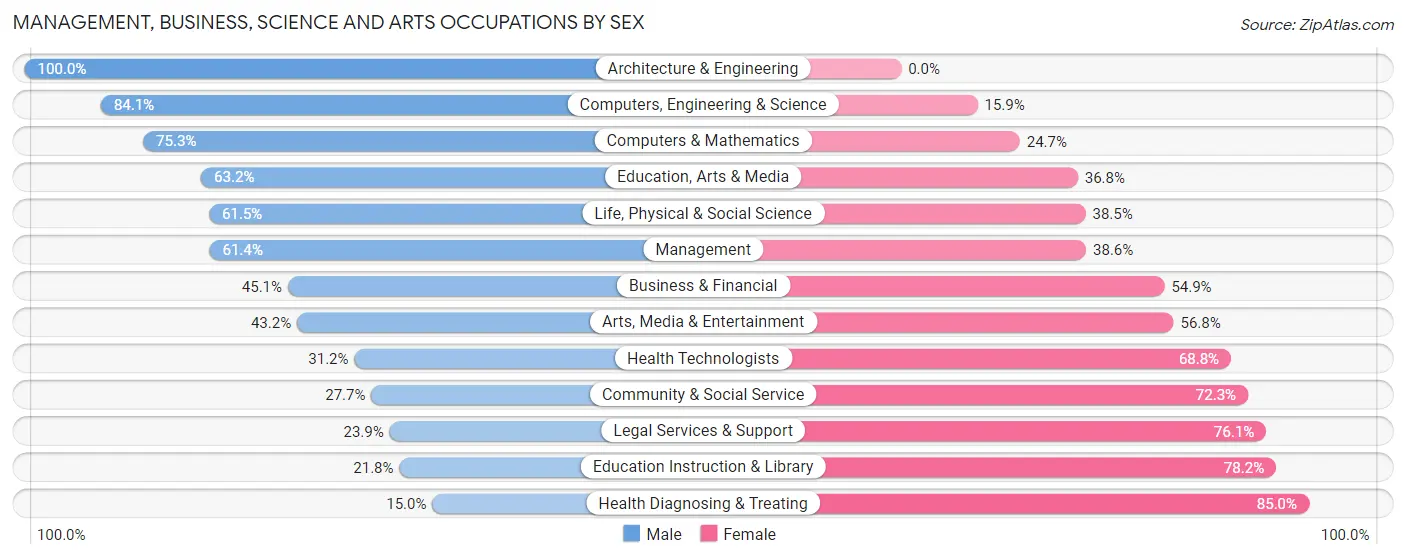
Management, Business, Science and Arts Occupations by Sex
Within the Management, Business, Science and Arts occupations in Beaufort, the most male-oriented occupations are Architecture & Engineering (100.0%), Computers, Engineering & Science (84.1%), and Computers & Mathematics (75.3%), while the most female-oriented occupations are Health Diagnosing & Treating (85.0%), Education Instruction & Library (78.2%), and Legal Services & Support (76.1%).
| Occupation | Male | Female |
| Management | 433 (61.4%) | 272 (38.6%) |
| Business & Financial | 87 (45.1%) | 106 (54.9%) |
| Computers, Engineering & Science | 153 (84.1%) | 29 (15.9%) |
| Computers & Mathematics | 73 (75.3%) | 24 (24.7%) |
| Architecture & Engineering | 72 (100.0%) | 0 (0.0%) |
| Life, Physical & Social Science | 8 (61.5%) | 5 (38.5%) |
| Community & Social Service | 178 (27.7%) | 465 (72.3%) |
| Education, Arts & Media | 24 (63.2%) | 14 (36.8%) |
| Legal Services & Support | 37 (23.9%) | 118 (76.1%) |
| Education Instruction & Library | 79 (21.8%) | 283 (78.2%) |
| Arts, Media & Entertainment | 38 (43.2%) | 50 (56.8%) |
| Health Diagnosing & Treating | 108 (15.0%) | 614 (85.0%) |
| Health Technologists | 108 (31.2%) | 238 (68.8%) |
| Total (Category) | 959 (39.2%) | 1,486 (60.8%) |
| Total (Overall) | 2,929 (51.6%) | 2,749 (48.4%) |
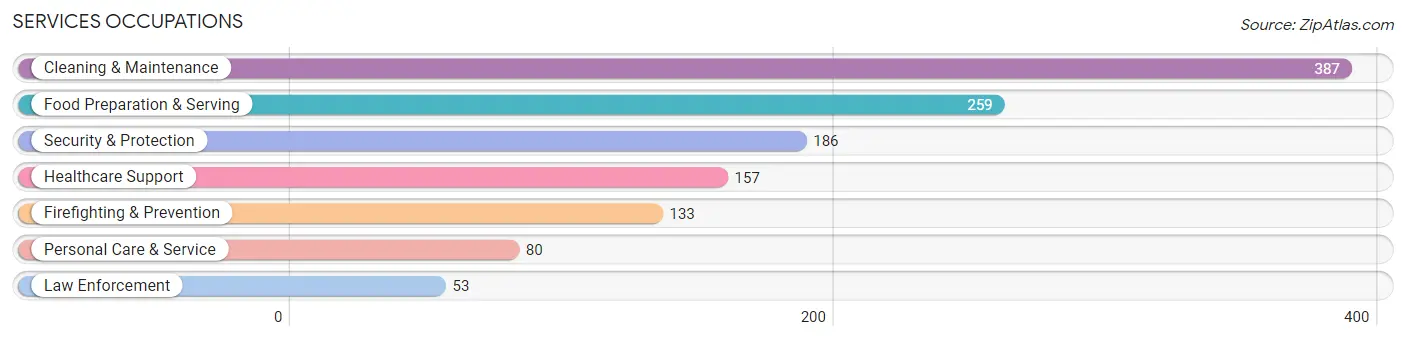
Services Occupations
The most common Services occupations in Beaufort are Cleaning & Maintenance (387 | 6.8%), Food Preparation & Serving (259 | 4.6%), Security & Protection (186 | 3.3%), Healthcare Support (157 | 2.8%), and Firefighting & Prevention (133 | 2.3%).
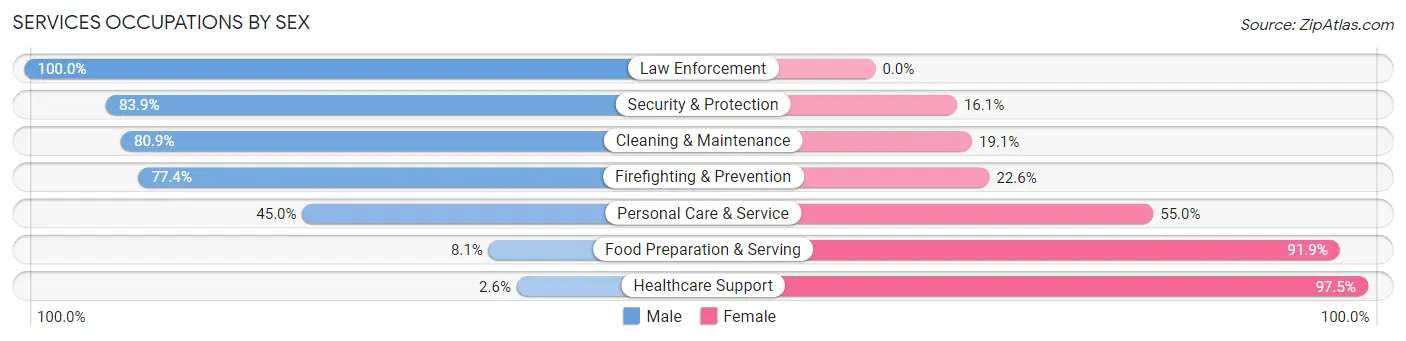
Services Occupations by Sex
Within the Services occupations in Beaufort, the most male-oriented occupations are Law Enforcement (100.0%), Security & Protection (83.9%), and Cleaning & Maintenance (80.9%), while the most female-oriented occupations are Healthcare Support (97.5%), Food Preparation & Serving (91.9%), and Personal Care & Service (55.0%).
| Occupation | Male | Female |
| Healthcare Support | 4 (2.5%) | 153 (97.5%) |
| Security & Protection | 156 (83.9%) | 30 (16.1%) |
| Firefighting & Prevention | 103 (77.4%) | 30 (22.6%) |
| Law Enforcement | 53 (100.0%) | 0 (0.0%) |
| Food Preparation & Serving | 21 (8.1%) | 238 (91.9%) |
| Cleaning & Maintenance | 313 (80.9%) | 74 (19.1%) |
| Personal Care & Service | 36 (45.0%) | 44 (55.0%) |
| Total (Category) | 530 (49.6%) | 539 (50.4%) |
| Total (Overall) | 2,929 (51.6%) | 2,749 (48.4%) |
Sales and Office Occupations
The most common Sales and Office occupations in Beaufort are Sales & Related (653 | 11.5%), and Office & Administration (487 | 8.6%).
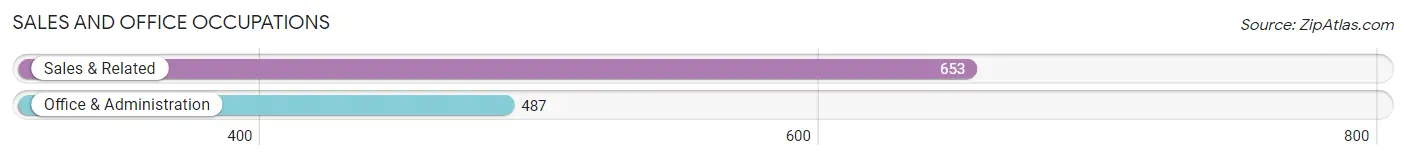
Sales and Office Occupations by Sex
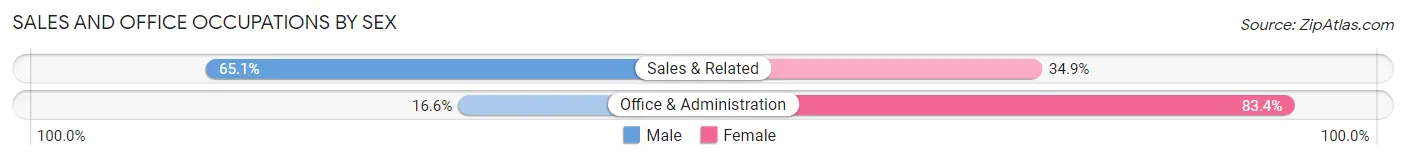
| Occupation | Male | Female |
| Sales & Related | 425 (65.1%) | 228 (34.9%) |
| Office & Administration | 81 (16.6%) | 406 (83.4%) |
| Total (Category) | 506 (44.4%) | 634 (55.6%) |
| Total (Overall) | 2,929 (51.6%) | 2,749 (48.4%) |
Natural Resources, Construction and Maintenance Occupations
The most common Natural Resources, Construction and Maintenance occupations in Beaufort are Construction & Extraction (447 | 7.9%), and Installation, Maintenance & Repair (184 | 3.2%).
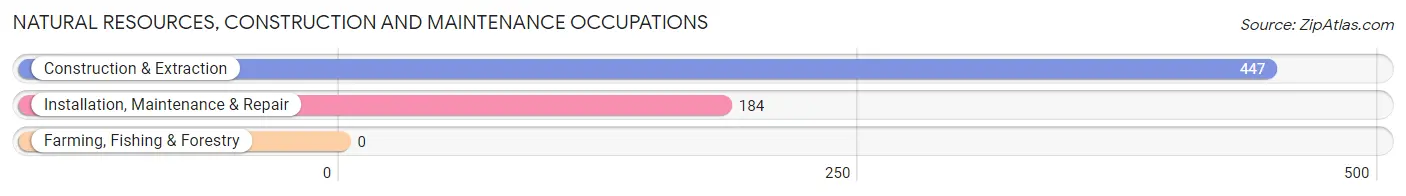
Natural Resources, Construction and Maintenance Occupations by Sex
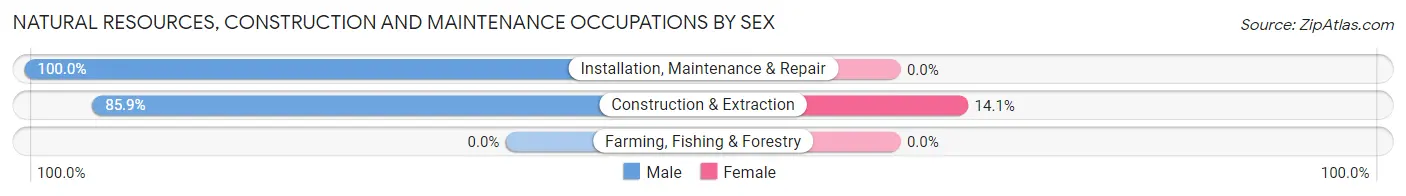
| Occupation | Male | Female |
| Farming, Fishing & Forestry | 0 (0.0%) | 0 (0.0%) |
| Construction & Extraction | 384 (85.9%) | 63 (14.1%) |
| Installation, Maintenance & Repair | 184 (100.0%) | 0 (0.0%) |
| Total (Category) | 568 (90.0%) | 63 (10.0%) |
| Total (Overall) | 2,929 (51.6%) | 2,749 (48.4%) |
Production, Transportation and Moving Occupations
The most common Production, Transportation and Moving occupations in Beaufort are Production (184 | 3.2%), Material Moving (142 | 2.5%), and Transportation (67 | 1.2%).
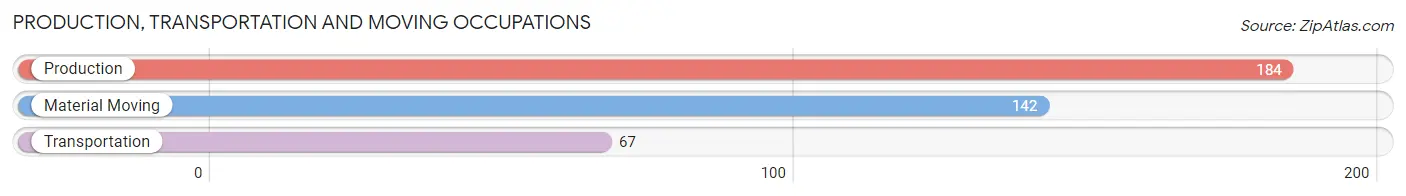
Production, Transportation and Moving Occupations by Sex
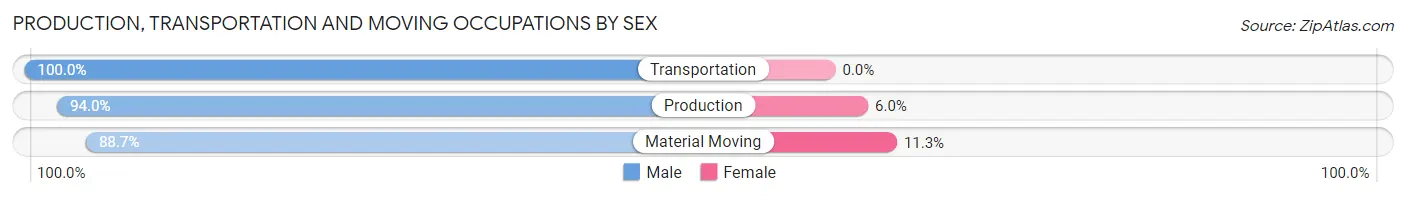
| Occupation | Male | Female |
| Production | 173 (94.0%) | 11 (6.0%) |
| Transportation | 67 (100.0%) | 0 (0.0%) |
| Material Moving | 126 (88.7%) | 16 (11.3%) |
| Total (Category) | 366 (93.1%) | 27 (6.9%) |
| Total (Overall) | 2,929 (51.6%) | 2,749 (48.4%) |
Employment Industries by Sex in Beaufort
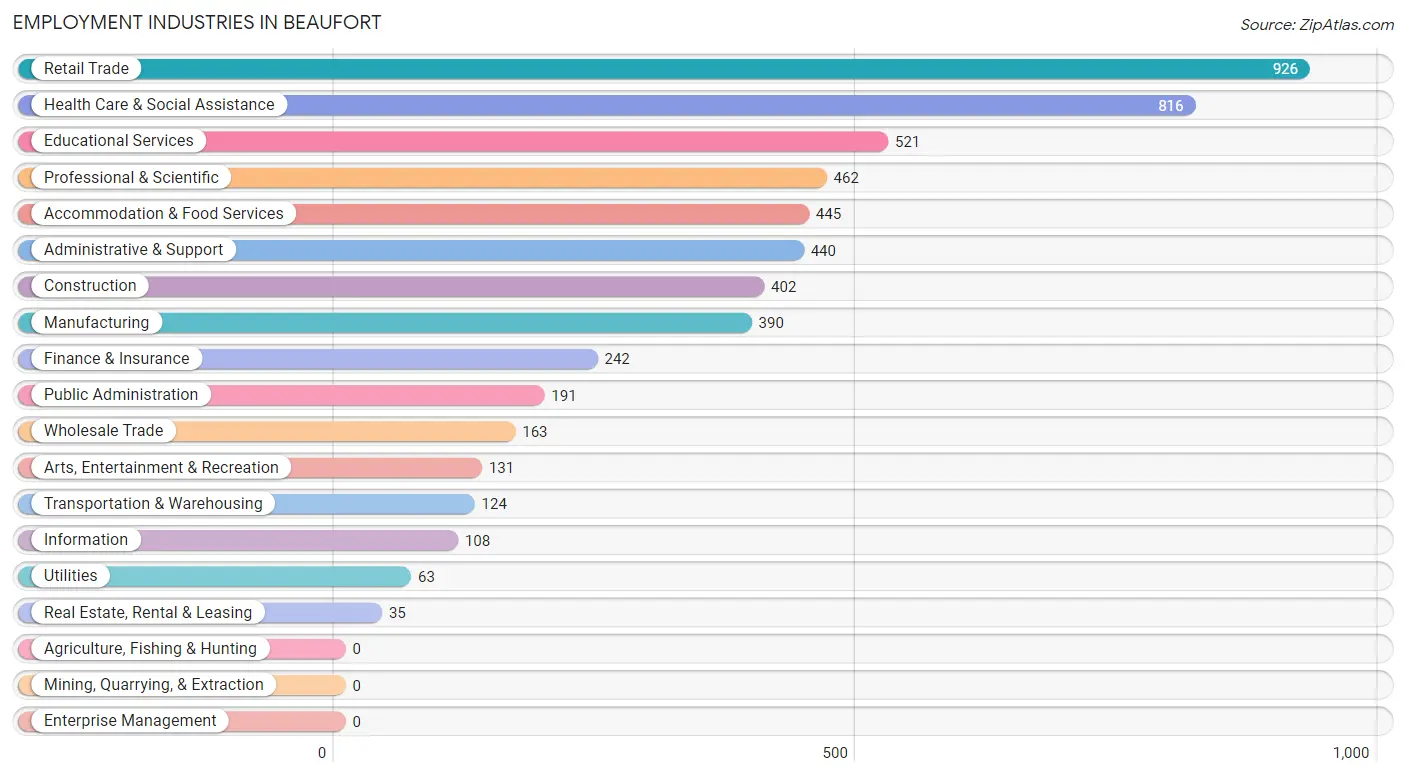
Employment Industries in Beaufort
The major employment industries in Beaufort include Retail Trade (926 | 16.3%), Health Care & Social Assistance (816 | 14.4%), Educational Services (521 | 9.2%), Professional & Scientific (462 | 8.1%), and Accommodation & Food Services (445 | 7.8%).
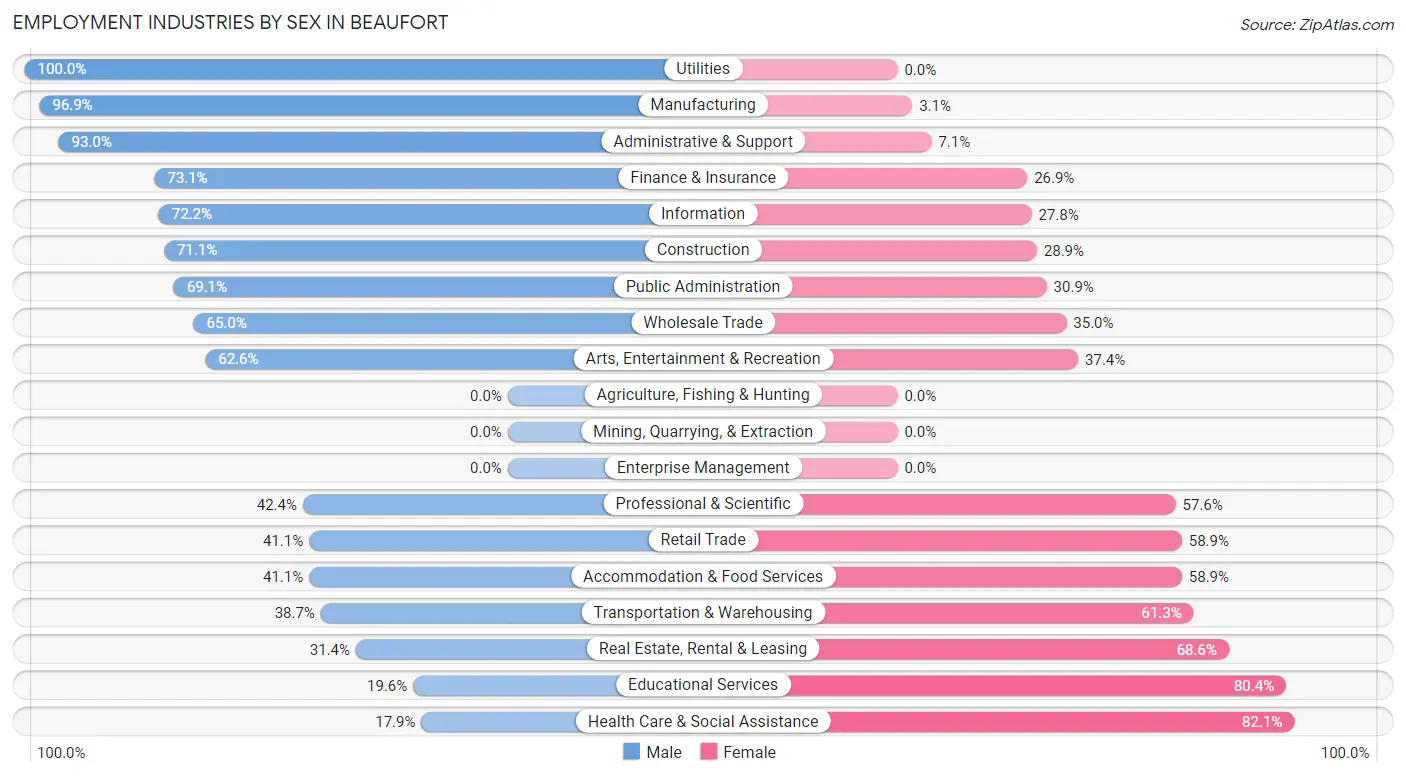
Employment Industries by Sex in Beaufort
The Beaufort industries that see more men than women are Utilities (100.0%), Manufacturing (96.9%), and Administrative & Support (92.9%), whereas the industries that tend to have a higher number of women are Health Care & Social Assistance (82.1%), Educational Services (80.4%), and Real Estate, Rental & Leasing (68.6%).
| Industry | Male | Female |
| Agriculture, Fishing & Hunting | 0 (0.0%) | 0 (0.0%) |
| Mining, Quarrying, & Extraction | 0 (0.0%) | 0 (0.0%) |
| Construction | 286 (71.1%) | 116 (28.9%) |
| Manufacturing | 378 (96.9%) | 12 (3.1%) |
| Wholesale Trade | 106 (65.0%) | 57 (35.0%) |
| Retail Trade | 381 (41.1%) | 545 (58.9%) |
| Transportation & Warehousing | 48 (38.7%) | 76 (61.3%) |
| Utilities | 63 (100.0%) | 0 (0.0%) |
| Information | 78 (72.2%) | 30 (27.8%) |
| Finance & Insurance | 177 (73.1%) | 65 (26.9%) |
| Real Estate, Rental & Leasing | 11 (31.4%) | 24 (68.6%) |
| Professional & Scientific | 196 (42.4%) | 266 (57.6%) |
| Enterprise Management | 0 (0.0%) | 0 (0.0%) |
| Administrative & Support | 409 (92.9%) | 31 (7.0%) |
| Educational Services | 102 (19.6%) | 419 (80.4%) |
| Health Care & Social Assistance | 146 (17.9%) | 670 (82.1%) |
| Arts, Entertainment & Recreation | 82 (62.6%) | 49 (37.4%) |
| Accommodation & Food Services | 183 (41.1%) | 262 (58.9%) |
| Public Administration | 132 (69.1%) | 59 (30.9%) |
| Total | 2,929 (51.6%) | 2,749 (48.4%) |
Education in Beaufort
School Enrollment in Beaufort
The most common levels of schooling among the 2,591 students in Beaufort are middle school (722 | 27.9%), college / undergraduate (558 | 21.5%), and elementary school (448 | 17.3%).
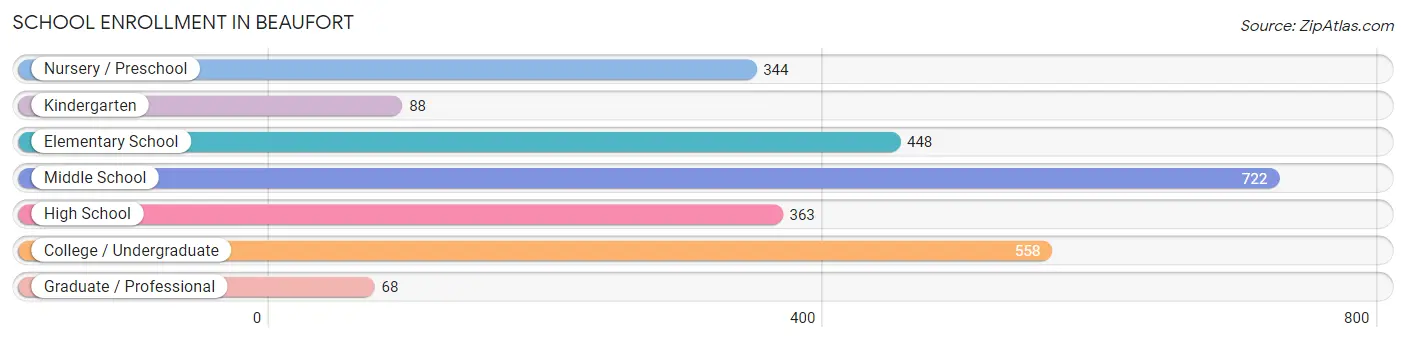
| School Level | # Students | % Students |
| Nursery / Preschool | 344 | 13.3% |
| Kindergarten | 88 | 3.4% |
| Elementary School | 448 | 17.3% |
| Middle School | 722 | 27.9% |
| High School | 363 | 14.0% |
| College / Undergraduate | 558 | 21.5% |
| Graduate / Professional | 68 | 2.6% |
| Total | 2,591 | 100.0% |
School Enrollment by Age by Funding Source in Beaufort
Out of a total of 2,591 students who are enrolled in schools in Beaufort, 578 (22.3%) attend a private institution, while the remaining 2,013 (77.7%) are enrolled in public schools. The age group of 35 years and over has the highest likelihood of being enrolled in private schools, with 109 (54.5% in the age bracket) enrolled. Conversely, the age group of 18 to 19 year olds has the lowest likelihood of being enrolled in a private school, with 40 (100.0% in the age bracket) attending a public institution.
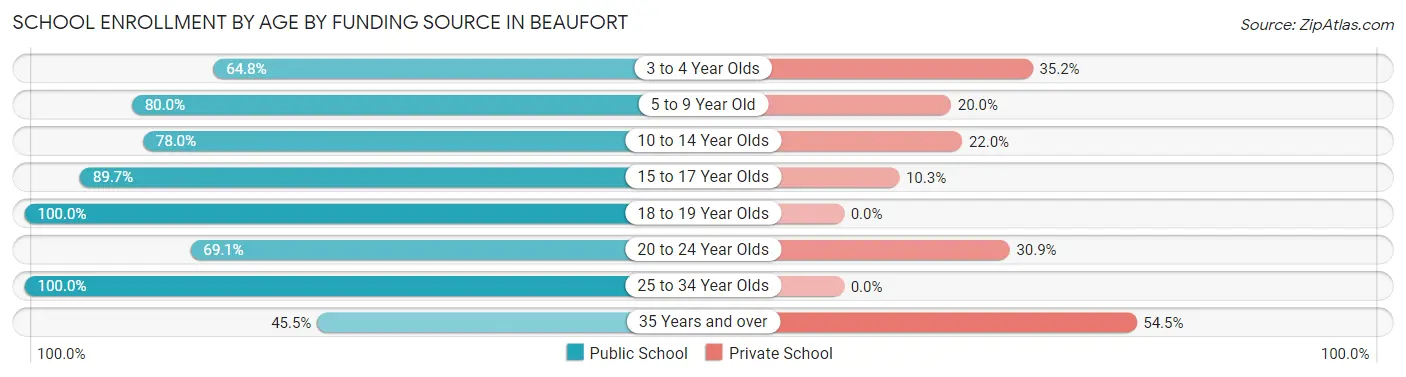
| Age Bracket | Public School | Private School |
| 3 to 4 Year Olds | 166 (64.8%) | 90 (35.2%) |
| 5 to 9 Year Old | 433 (80.0%) | 108 (20.0%) |
| 10 to 14 Year Olds | 630 (78.0%) | 178 (22.0%) |
| 15 to 17 Year Olds | 270 (89.7%) | 31 (10.3%) |
| 18 to 19 Year Olds | 40 (100.0%) | 0 (0.0%) |
| 20 to 24 Year Olds | 141 (69.1%) | 63 (30.9%) |
| 25 to 34 Year Olds | 241 (100.0%) | 0 (0.0%) |
| 35 Years and over | 91 (45.5%) | 109 (54.5%) |
| Total | 2,013 (77.7%) | 578 (22.3%) |
Educational Attainment by Field of Study in Beaufort
Business (633 | 19.2%), education (415 | 12.6%), science & technology (353 | 10.7%), bio, nature & agricultural (295 | 8.9%), and social sciences (295 | 8.9%) are the most common fields of study among 3,299 individuals in Beaufort who have obtained a bachelor's degree or higher.
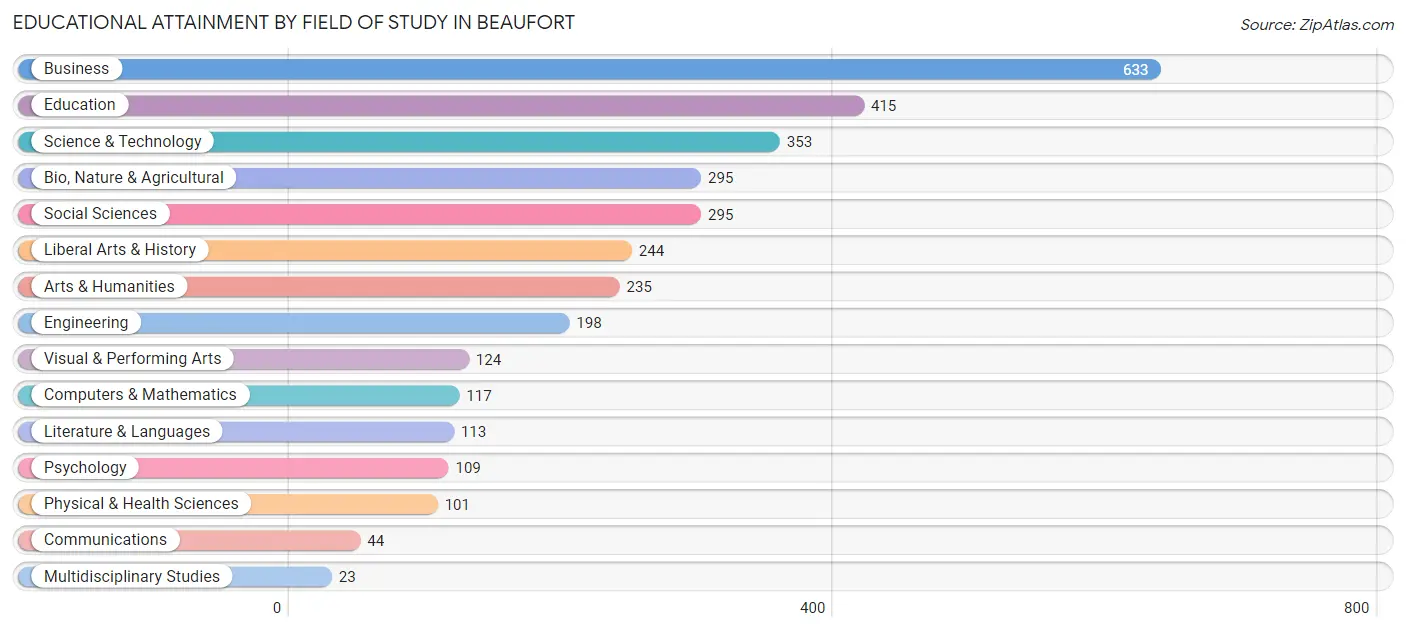
| Field of Study | # Graduates | % Graduates |
| Computers & Mathematics | 117 | 3.5% |
| Bio, Nature & Agricultural | 295 | 8.9% |
| Physical & Health Sciences | 101 | 3.1% |
| Psychology | 109 | 3.3% |
| Social Sciences | 295 | 8.9% |
| Engineering | 198 | 6.0% |
| Multidisciplinary Studies | 23 | 0.7% |
| Science & Technology | 353 | 10.7% |
| Business | 633 | 19.2% |
| Education | 415 | 12.6% |
| Literature & Languages | 113 | 3.4% |
| Liberal Arts & History | 244 | 7.4% |
| Visual & Performing Arts | 124 | 3.8% |
| Communications | 44 | 1.3% |
| Arts & Humanities | 235 | 7.1% |
| Total | 3,299 | 100.0% |
Transportation & Commute in Beaufort
Vehicle Availability by Sex in Beaufort
The most prevalent vehicle ownership categories in Beaufort are males with 2 vehicles (1,788, accounting for 59.7%) and females with 2 vehicles (1,017, making up 64.7%).
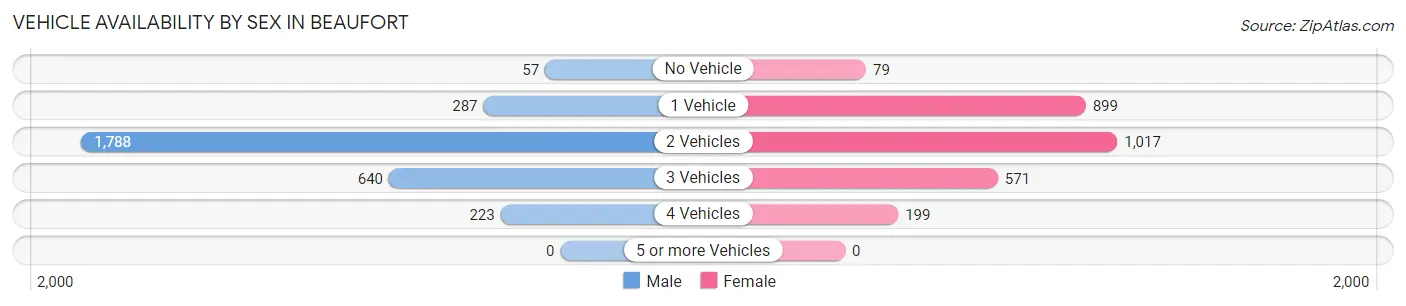
| Vehicles Available | Male | Female |
| No Vehicle | 57 (1.9%) | 79 (2.9%) |
| 1 Vehicle | 287 (9.6%) | 899 (32.5%) |
| 2 Vehicles | 1,788 (59.7%) | 1,017 (36.8%) |
| 3 Vehicles | 640 (21.4%) | 571 (20.6%) |
| 4 Vehicles | 223 (7.4%) | 199 (7.2%) |
| 5 or more Vehicles | 0 (0.0%) | 0 (0.0%) |
| Total | 2,995 (100.0%) | 2,765 (100.0%) |
Commute Time in Beaufort
The most frequently occuring commute durations in Beaufort are 30 to 34 minutes (1,168 commuters, 18.0%), 10 to 14 minutes (1,058 commuters, 16.3%), and 15 to 19 minutes (1,053 commuters, 16.3%).
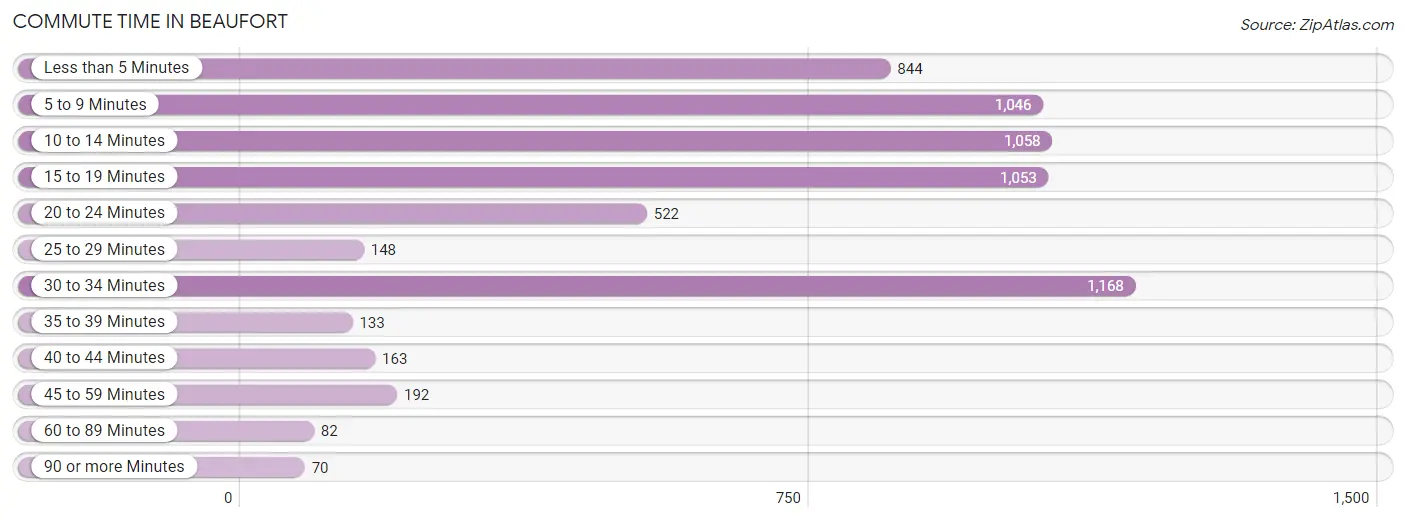
| Commute Time | # Commuters | % Commuters |
| Less than 5 Minutes | 844 | 13.0% |
| 5 to 9 Minutes | 1,046 | 16.1% |
| 10 to 14 Minutes | 1,058 | 16.3% |
| 15 to 19 Minutes | 1,053 | 16.3% |
| 20 to 24 Minutes | 522 | 8.1% |
| 25 to 29 Minutes | 148 | 2.3% |
| 30 to 34 Minutes | 1,168 | 18.0% |
| 35 to 39 Minutes | 133 | 2.1% |
| 40 to 44 Minutes | 163 | 2.5% |
| 45 to 59 Minutes | 192 | 3.0% |
| 60 to 89 Minutes | 82 | 1.3% |
| 90 or more Minutes | 70 | 1.1% |
Commute Time by Sex in Beaufort
The most common commute times in Beaufort are 30 to 34 minutes (716 commuters, 18.5%) for males and 10 to 14 minutes (565 commuters, 21.6%) for females.
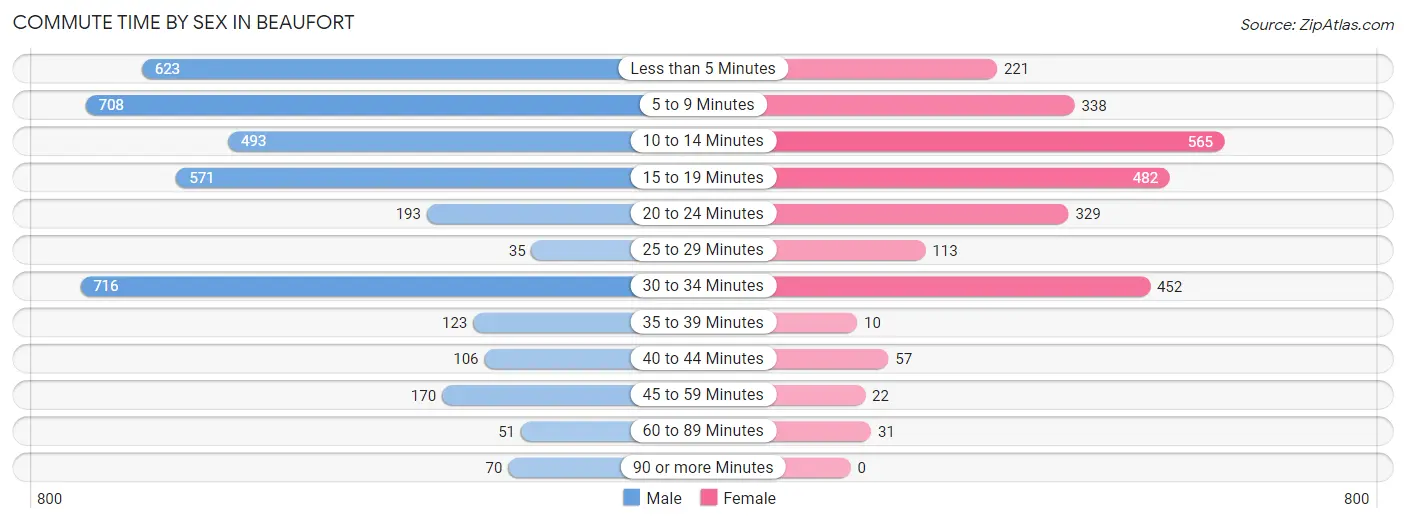
| Commute Time | Male | Female |
| Less than 5 Minutes | 623 (16.1%) | 221 (8.4%) |
| 5 to 9 Minutes | 708 (18.3%) | 338 (12.9%) |
| 10 to 14 Minutes | 493 (12.8%) | 565 (21.6%) |
| 15 to 19 Minutes | 571 (14.8%) | 482 (18.4%) |
| 20 to 24 Minutes | 193 (5.0%) | 329 (12.6%) |
| 25 to 29 Minutes | 35 (0.9%) | 113 (4.3%) |
| 30 to 34 Minutes | 716 (18.5%) | 452 (17.2%) |
| 35 to 39 Minutes | 123 (3.2%) | 10 (0.4%) |
| 40 to 44 Minutes | 106 (2.8%) | 57 (2.2%) |
| 45 to 59 Minutes | 170 (4.4%) | 22 (0.8%) |
| 60 to 89 Minutes | 51 (1.3%) | 31 (1.2%) |
| 90 or more Minutes | 70 (1.8%) | 0 (0.0%) |
Time of Departure to Work by Sex in Beaufort
The most frequent times of departure to work in Beaufort are 7:00 AM to 7:29 AM (683, 17.7%) for males and 7:30 AM to 7:59 AM (584, 22.3%) for females.
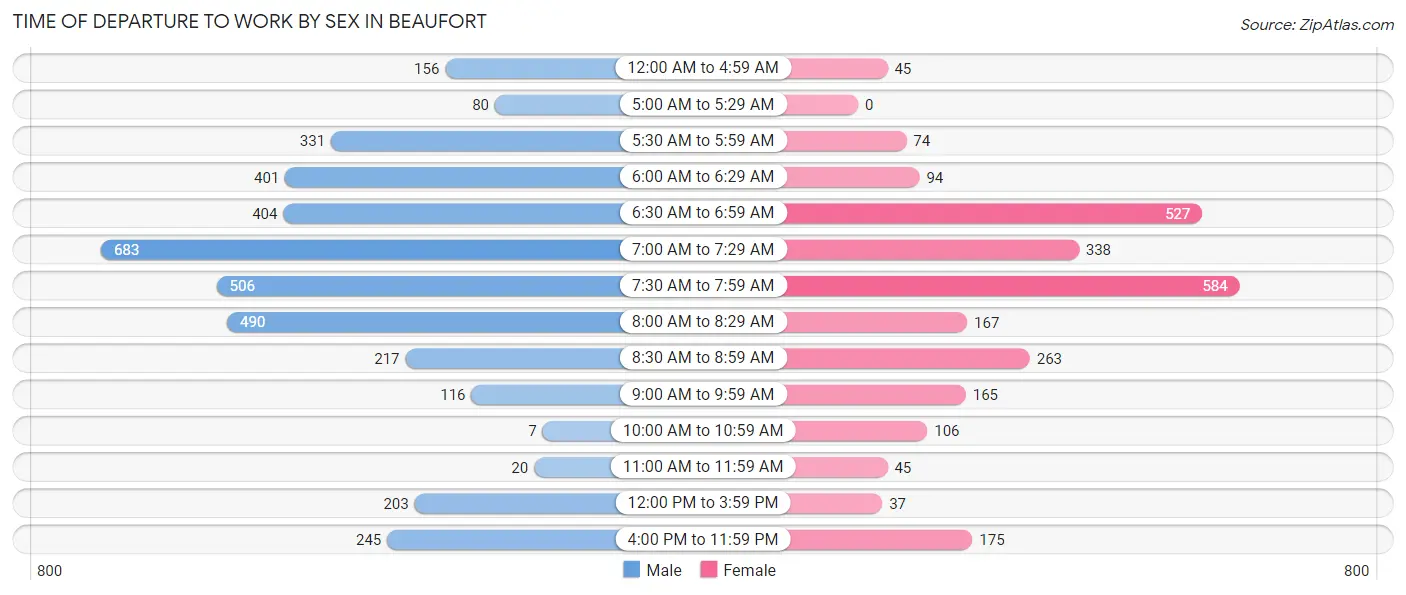
| Time of Departure | Male | Female |
| 12:00 AM to 4:59 AM | 156 (4.0%) | 45 (1.7%) |
| 5:00 AM to 5:29 AM | 80 (2.1%) | 0 (0.0%) |
| 5:30 AM to 5:59 AM | 331 (8.6%) | 74 (2.8%) |
| 6:00 AM to 6:29 AM | 401 (10.4%) | 94 (3.6%) |
| 6:30 AM to 6:59 AM | 404 (10.5%) | 527 (20.1%) |
| 7:00 AM to 7:29 AM | 683 (17.7%) | 338 (12.9%) |
| 7:30 AM to 7:59 AM | 506 (13.1%) | 584 (22.3%) |
| 8:00 AM to 8:29 AM | 490 (12.7%) | 167 (6.4%) |
| 8:30 AM to 8:59 AM | 217 (5.6%) | 263 (10.0%) |
| 9:00 AM to 9:59 AM | 116 (3.0%) | 165 (6.3%) |
| 10:00 AM to 10:59 AM | 7 (0.2%) | 106 (4.1%) |
| 11:00 AM to 11:59 AM | 20 (0.5%) | 45 (1.7%) |
| 12:00 PM to 3:59 PM | 203 (5.3%) | 37 (1.4%) |
| 4:00 PM to 11:59 PM | 245 (6.4%) | 175 (6.7%) |
| Total | 3,859 (100.0%) | 2,620 (100.0%) |
Housing Occupancy in Beaufort
Occupancy by Ownership in Beaufort
Of the total 5,121 dwellings in Beaufort, owner-occupied units account for 2,935 (57.3%), while renter-occupied units make up 2,186 (42.7%).
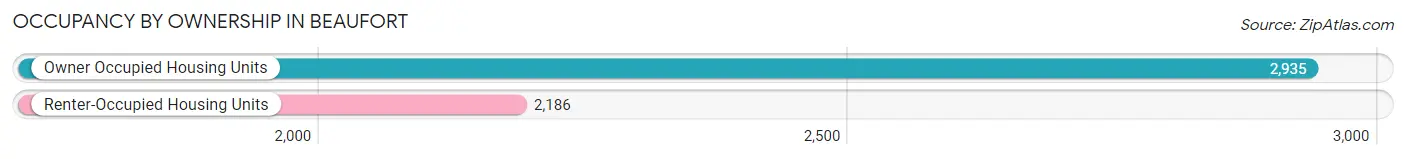
| Occupancy | # Housing Units | % Housing Units |
| Owner Occupied Housing Units | 2,935 | 57.3% |
| Renter-Occupied Housing Units | 2,186 | 42.7% |
| Total Occupied Housing Units | 5,121 | 100.0% |
Occupancy by Household Size in Beaufort
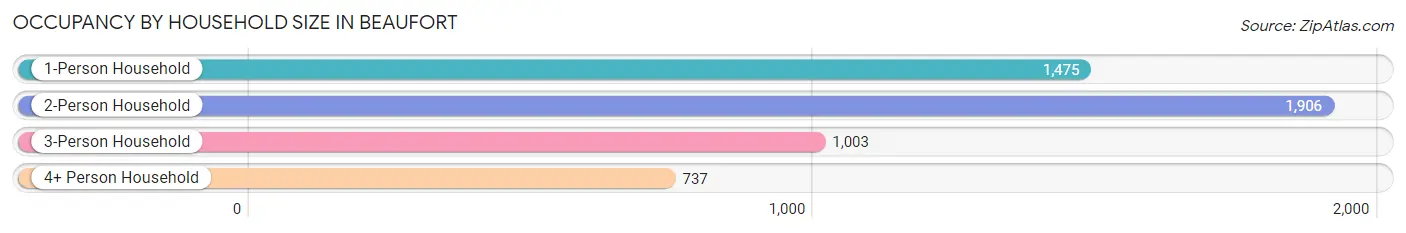
| Household Size | # Housing Units | % Housing Units |
| 1-Person Household | 1,475 | 28.8% |
| 2-Person Household | 1,906 | 37.2% |
| 3-Person Household | 1,003 | 19.6% |
| 4+ Person Household | 737 | 14.4% |
| Total Housing Units | 5,121 | 100.0% |
Occupancy by Ownership by Household Size in Beaufort
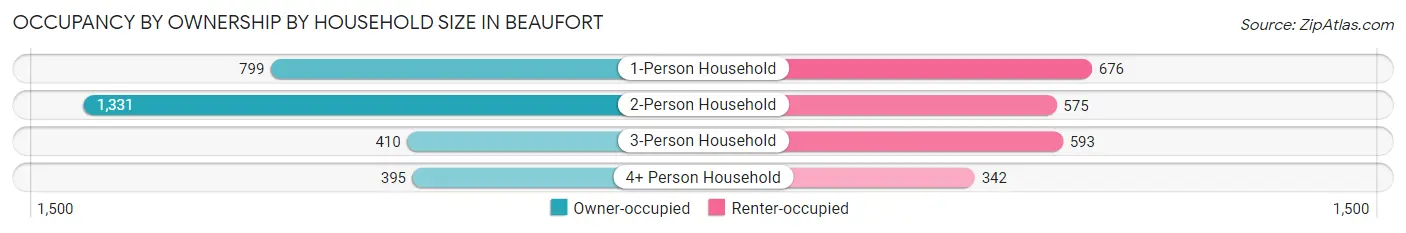
| Household Size | Owner-occupied | Renter-occupied |
| 1-Person Household | 799 (54.2%) | 676 (45.8%) |
| 2-Person Household | 1,331 (69.8%) | 575 (30.2%) |
| 3-Person Household | 410 (40.9%) | 593 (59.1%) |
| 4+ Person Household | 395 (53.6%) | 342 (46.4%) |
| Total Housing Units | 2,935 (57.3%) | 2,186 (42.7%) |
Occupancy by Educational Attainment in Beaufort
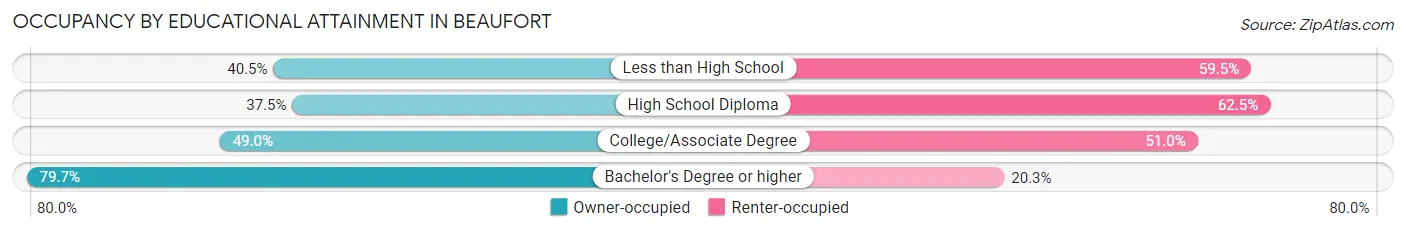
| Household Size | Owner-occupied | Renter-occupied |
| Less than High School | 90 (40.5%) | 132 (59.5%) |
| High School Diploma | 518 (37.5%) | 862 (62.5%) |
| College/Associate Degree | 763 (49.0%) | 793 (51.0%) |
| Bachelor's Degree or higher | 1,564 (79.7%) | 399 (20.3%) |
Occupancy by Age of Householder in Beaufort
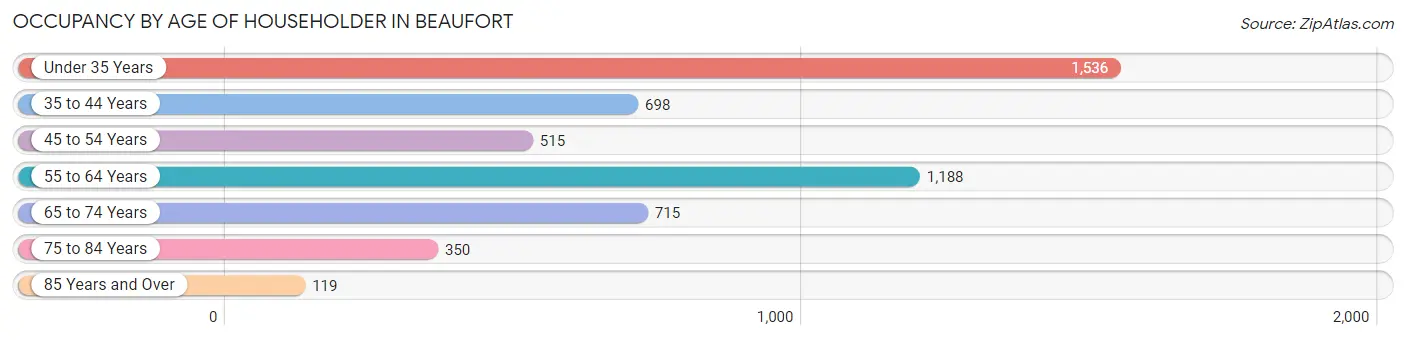
| Age Bracket | # Households | % Households |
| Under 35 Years | 1,536 | 30.0% |
| 35 to 44 Years | 698 | 13.6% |
| 45 to 54 Years | 515 | 10.1% |
| 55 to 64 Years | 1,188 | 23.2% |
| 65 to 74 Years | 715 | 14.0% |
| 75 to 84 Years | 350 | 6.8% |
| 85 Years and Over | 119 | 2.3% |
| Total | 5,121 | 100.0% |
Housing Finances in Beaufort
Median Income by Occupancy in Beaufort
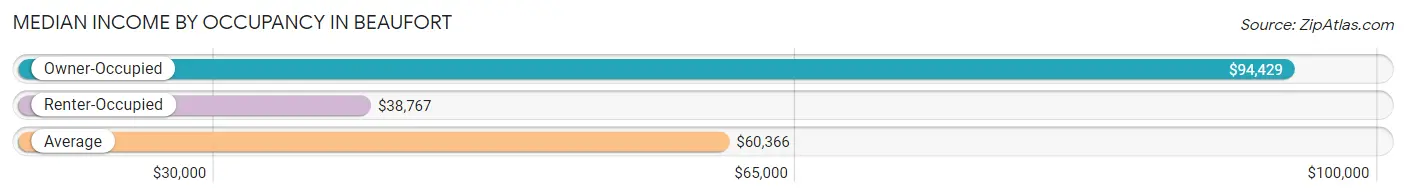
| Occupancy Type | # Households | Median Income |
| Owner-Occupied | 2,935 (57.3%) | $94,429 |
| Renter-Occupied | 2,186 (42.7%) | $38,767 |
| Average | 5,121 (100.0%) | $60,366 |
Occupancy by Householder Income Bracket in Beaufort
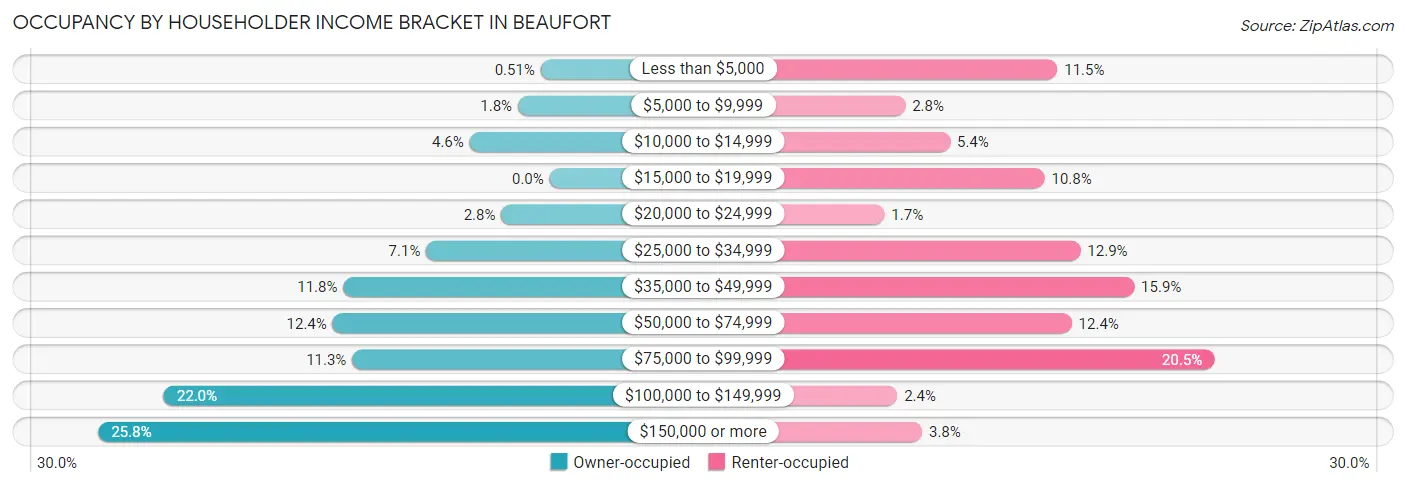
| Income Bracket | Owner-occupied | Renter-occupied |
| Less than $5,000 | 15 (0.5%) | 252 (11.5%) |
| $5,000 to $9,999 | 53 (1.8%) | 62 (2.8%) |
| $10,000 to $14,999 | 134 (4.6%) | 118 (5.4%) |
| $15,000 to $19,999 | 0 (0.0%) | 236 (10.8%) |
| $20,000 to $24,999 | 81 (2.8%) | 36 (1.7%) |
| $25,000 to $34,999 | 207 (7.0%) | 281 (12.9%) |
| $35,000 to $49,999 | 346 (11.8%) | 348 (15.9%) |
| $50,000 to $74,999 | 364 (12.4%) | 270 (12.3%) |
| $75,000 to $99,999 | 331 (11.3%) | 448 (20.5%) |
| $100,000 to $149,999 | 647 (22.0%) | 52 (2.4%) |
| $150,000 or more | 757 (25.8%) | 83 (3.8%) |
| Total | 2,935 (100.0%) | 2,186 (100.0%) |
Monthly Housing Cost Tiers in Beaufort
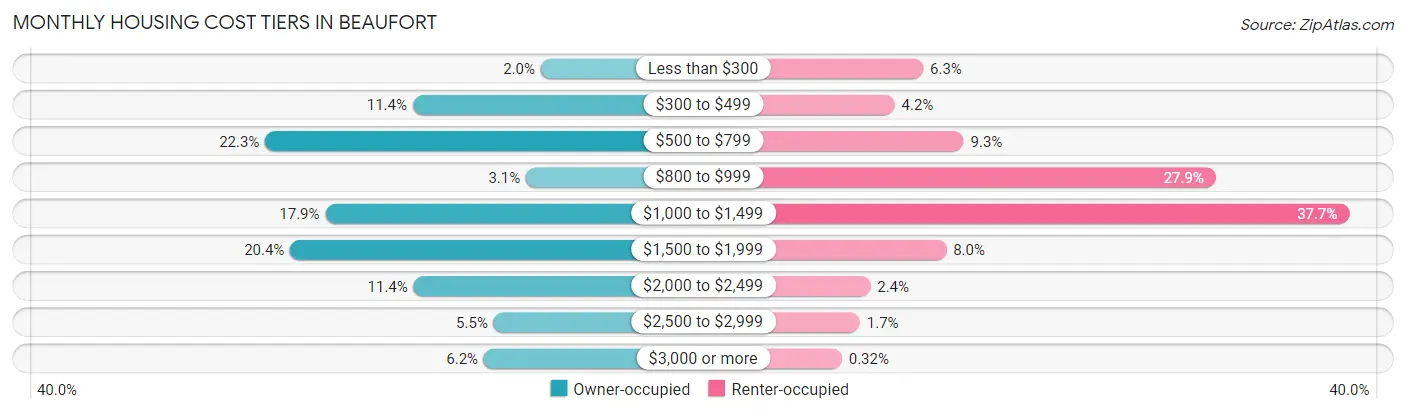
| Monthly Cost | Owner-occupied | Renter-occupied |
| Less than $300 | 58 (2.0%) | 138 (6.3%) |
| $300 to $499 | 335 (11.4%) | 92 (4.2%) |
| $500 to $799 | 654 (22.3%) | 203 (9.3%) |
| $800 to $999 | 90 (3.1%) | 609 (27.9%) |
| $1,000 to $1,499 | 524 (17.8%) | 824 (37.7%) |
| $1,500 to $1,999 | 600 (20.4%) | 175 (8.0%) |
| $2,000 to $2,499 | 333 (11.4%) | 53 (2.4%) |
| $2,500 to $2,999 | 160 (5.4%) | 36 (1.7%) |
| $3,000 or more | 181 (6.2%) | 7 (0.3%) |
| Total | 2,935 (100.0%) | 2,186 (100.0%) |
Physical Housing Characteristics in Beaufort
Housing Structures in Beaufort
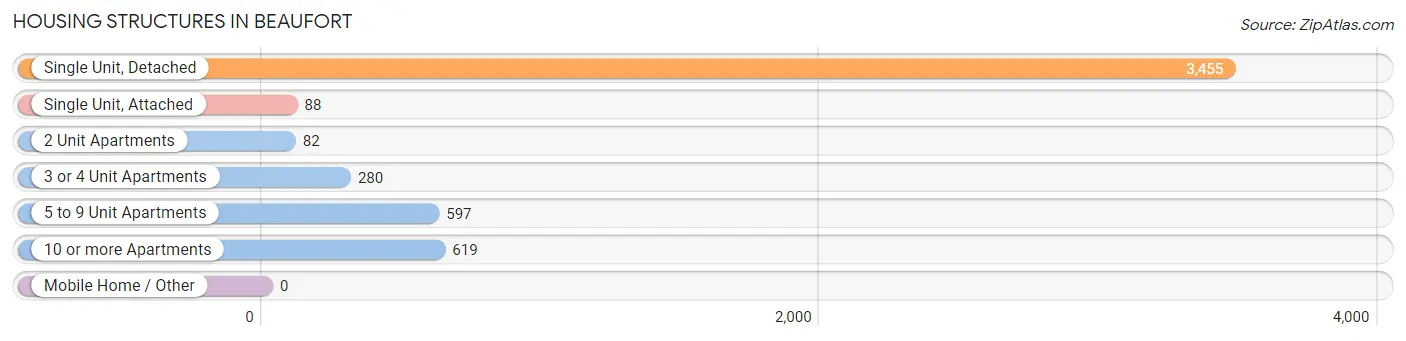
| Structure Type | # Housing Units | % Housing Units |
| Single Unit, Detached | 3,455 | 67.5% |
| Single Unit, Attached | 88 | 1.7% |
| 2 Unit Apartments | 82 | 1.6% |
| 3 or 4 Unit Apartments | 280 | 5.5% |
| 5 to 9 Unit Apartments | 597 | 11.7% |
| 10 or more Apartments | 619 | 12.1% |
| Mobile Home / Other | 0 | 0.0% |
| Total | 5,121 | 100.0% |
Housing Structures by Occupancy in Beaufort
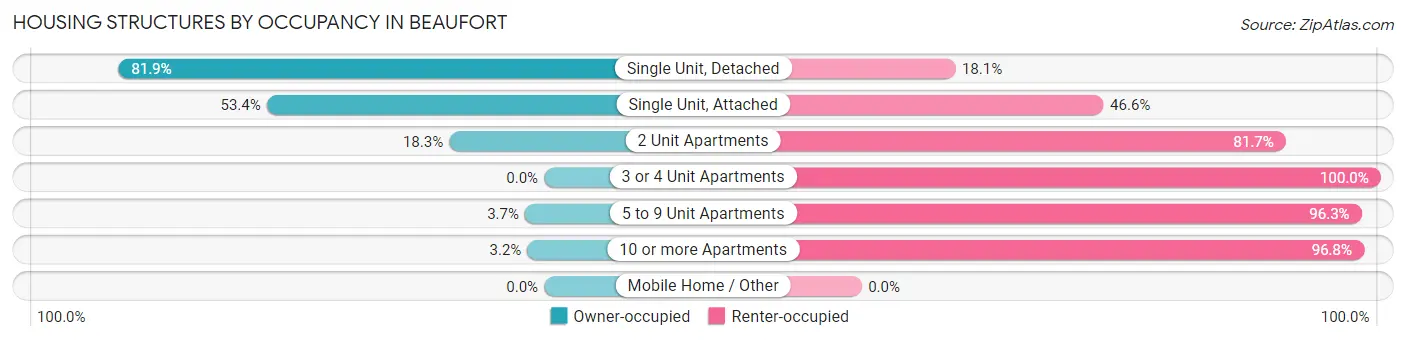
| Structure Type | Owner-occupied | Renter-occupied |
| Single Unit, Detached | 2,831 (81.9%) | 624 (18.1%) |
| Single Unit, Attached | 47 (53.4%) | 41 (46.6%) |
| 2 Unit Apartments | 15 (18.3%) | 67 (81.7%) |
| 3 or 4 Unit Apartments | 0 (0.0%) | 280 (100.0%) |
| 5 to 9 Unit Apartments | 22 (3.7%) | 575 (96.3%) |
| 10 or more Apartments | 20 (3.2%) | 599 (96.8%) |
| Mobile Home / Other | 0 (0.0%) | 0 (0.0%) |
| Total | 2,935 (57.3%) | 2,186 (42.7%) |
Housing Structures by Number of Rooms in Beaufort
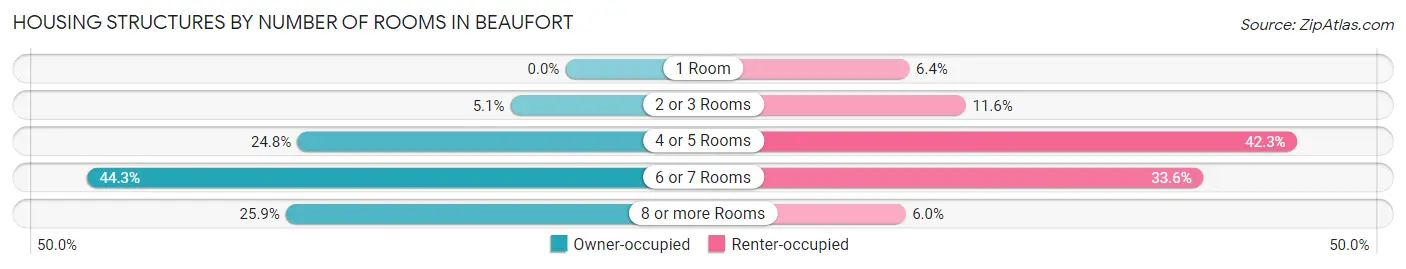
| Number of Rooms | Owner-occupied | Renter-occupied |
| 1 Room | 0 (0.0%) | 140 (6.4%) |
| 2 or 3 Rooms | 149 (5.1%) | 254 (11.6%) |
| 4 or 5 Rooms | 728 (24.8%) | 925 (42.3%) |
| 6 or 7 Rooms | 1,299 (44.3%) | 735 (33.6%) |
| 8 or more Rooms | 759 (25.9%) | 132 (6.0%) |
| Total | 2,935 (100.0%) | 2,186 (100.0%) |
Housing Structure by Heating Type in Beaufort
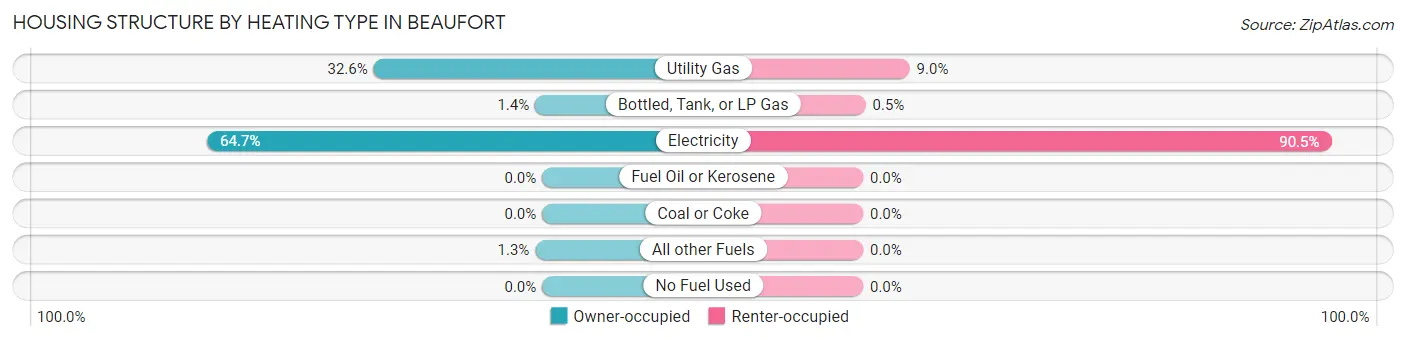
| Heating Type | Owner-occupied | Renter-occupied |
| Utility Gas | 956 (32.6%) | 197 (9.0%) |
| Bottled, Tank, or LP Gas | 40 (1.4%) | 11 (0.5%) |
| Electricity | 1,900 (64.7%) | 1,978 (90.5%) |
| Fuel Oil or Kerosene | 0 (0.0%) | 0 (0.0%) |
| Coal or Coke | 0 (0.0%) | 0 (0.0%) |
| All other Fuels | 39 (1.3%) | 0 (0.0%) |
| No Fuel Used | 0 (0.0%) | 0 (0.0%) |
| Total | 2,935 (100.0%) | 2,186 (100.0%) |
Household Vehicle Usage in Beaufort
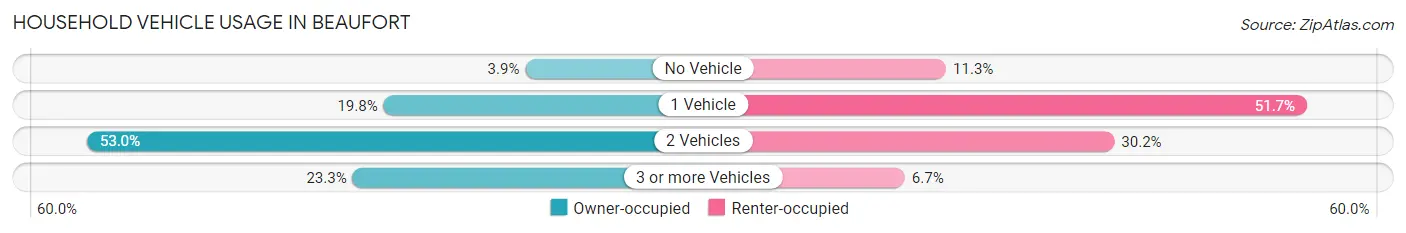
| Vehicles per Household | Owner-occupied | Renter-occupied |
| No Vehicle | 115 (3.9%) | 248 (11.3%) |
| 1 Vehicle | 581 (19.8%) | 1,131 (51.7%) |
| 2 Vehicles | 1,556 (53.0%) | 660 (30.2%) |
| 3 or more Vehicles | 683 (23.3%) | 147 (6.7%) |
| Total | 2,935 (100.0%) | 2,186 (100.0%) |
Real Estate & Mortgages in Beaufort
Real Estate and Mortgage Overview in Beaufort
| Characteristic | Without Mortgage | With Mortgage |
| Housing Units | 1,177 | 1,758 |
| Median Property Value | $251,300 | $339,600 |
| Median Household Income | $53,472 | $589 |
| Monthly Housing Costs | $612 | $169 |
| Real Estate Taxes | $1,197 | $40 |
Property Value by Mortgage Status in Beaufort
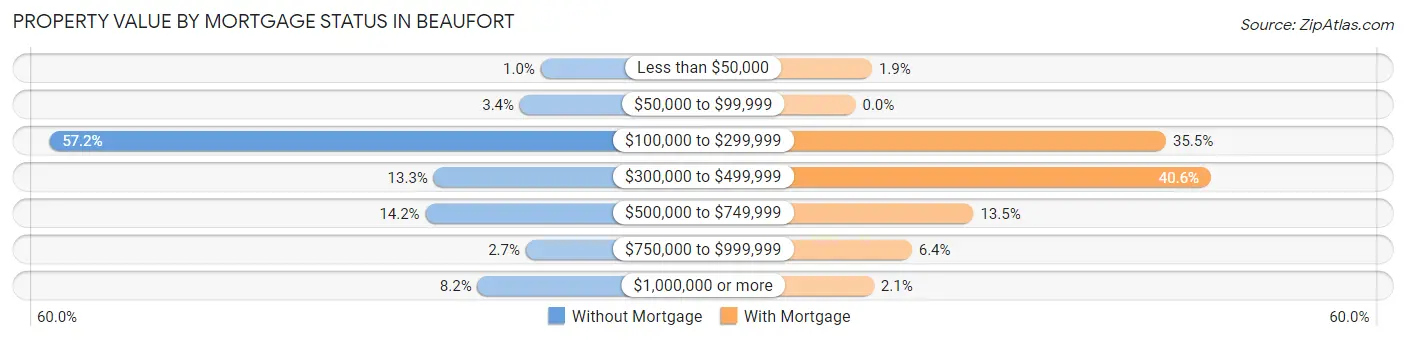
| Property Value | Without Mortgage | With Mortgage |
| Less than $50,000 | 12 (1.0%) | 33 (1.9%) |
| $50,000 to $99,999 | 40 (3.4%) | 0 (0.0%) |
| $100,000 to $299,999 | 673 (57.2%) | 624 (35.5%) |
| $300,000 to $499,999 | 156 (13.3%) | 714 (40.6%) |
| $500,000 to $749,999 | 167 (14.2%) | 237 (13.5%) |
| $750,000 to $999,999 | 32 (2.7%) | 113 (6.4%) |
| $1,000,000 or more | 97 (8.2%) | 37 (2.1%) |
| Total | 1,177 (100.0%) | 1,758 (100.0%) |
Household Income by Mortgage Status in Beaufort
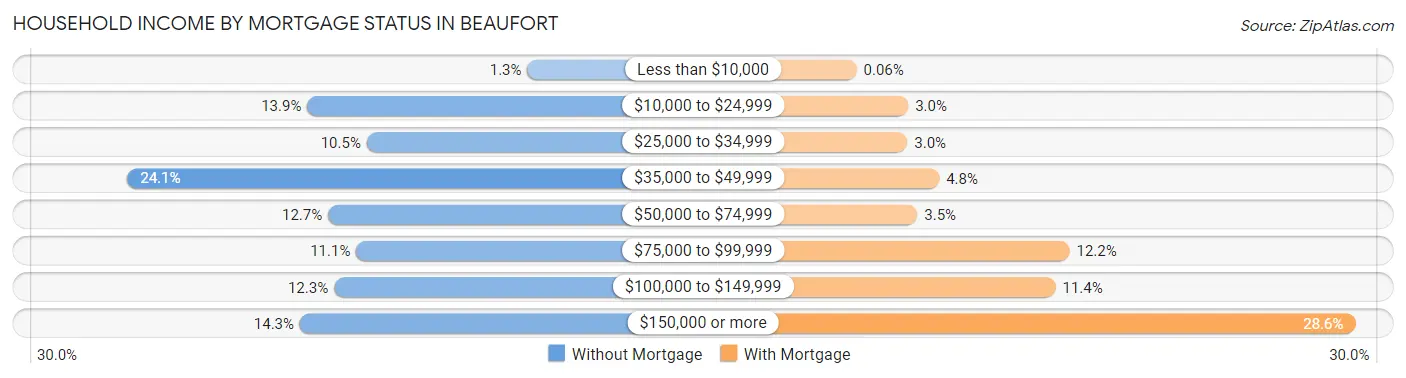
| Household Income | Without Mortgage | With Mortgage |
| Less than $10,000 | 15 (1.3%) | 1 (0.1%) |
| $10,000 to $24,999 | 163 (13.9%) | 53 (3.0%) |
| $25,000 to $34,999 | 123 (10.4%) | 52 (3.0%) |
| $35,000 to $49,999 | 284 (24.1%) | 84 (4.8%) |
| $50,000 to $74,999 | 149 (12.7%) | 62 (3.5%) |
| $75,000 to $99,999 | 130 (11.1%) | 215 (12.2%) |
| $100,000 to $149,999 | 145 (12.3%) | 201 (11.4%) |
| $150,000 or more | 168 (14.3%) | 502 (28.6%) |
| Total | 1,177 (100.0%) | 1,758 (100.0%) |
Property Value to Household Income Ratio in Beaufort
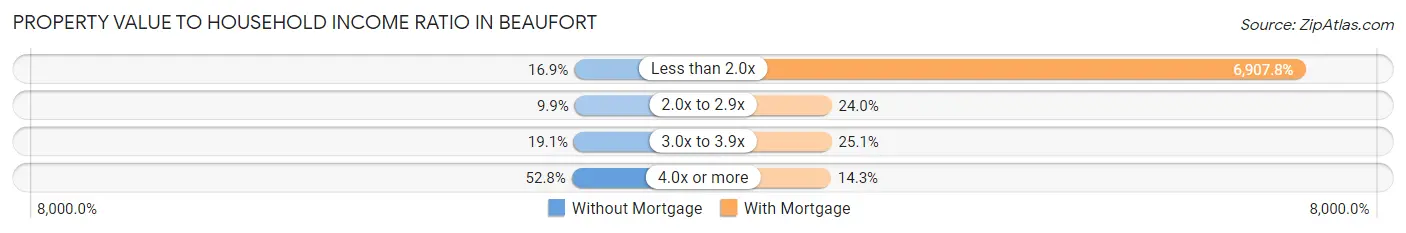
| Value-to-Income Ratio | Without Mortgage | With Mortgage |
| Less than 2.0x | 199 (16.9%) | 121,439 (6,907.8%) |
| 2.0x to 2.9x | 117 (9.9%) | 422 (24.0%) |
| 3.0x to 3.9x | 225 (19.1%) | 442 (25.1%) |
| 4.0x or more | 621 (52.8%) | 251 (14.3%) |
| Total | 1,177 (100.0%) | 1,758 (100.0%) |
Real Estate Taxes by Mortgage Status in Beaufort
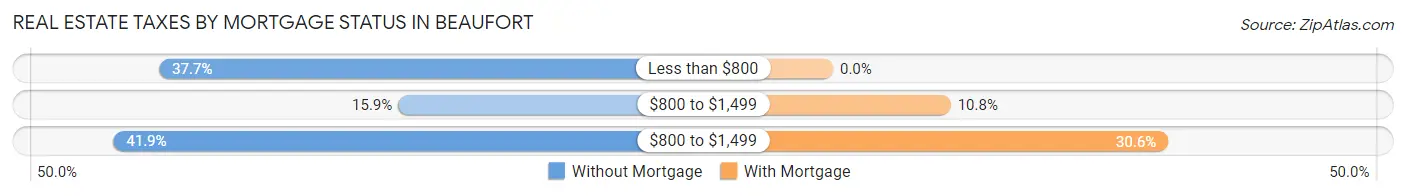
| Property Taxes | Without Mortgage | With Mortgage |
| Less than $800 | 444 (37.7%) | 0 (0.0%) |
| $800 to $1,499 | 187 (15.9%) | 189 (10.7%) |
| $800 to $1,499 | 493 (41.9%) | 538 (30.6%) |
| Total | 1,177 (100.0%) | 1,758 (100.0%) |
Health & Disability in Beaufort
Health Insurance Coverage by Age in Beaufort
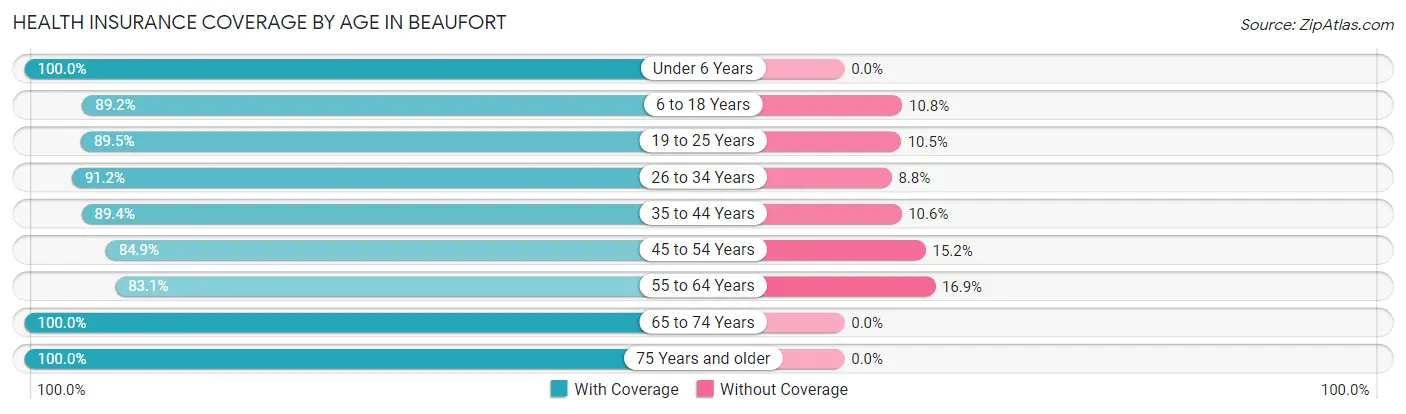
| Age Bracket | With Coverage | Without Coverage |
| Under 6 Years | 1,143 (100.0%) | 0 (0.0%) |
| 6 to 18 Years | 1,541 (89.2%) | 186 (10.8%) |
| 19 to 25 Years | 876 (89.5%) | 103 (10.5%) |
| 26 to 34 Years | 1,962 (91.2%) | 189 (8.8%) |
| 35 to 44 Years | 968 (89.4%) | 115 (10.6%) |
| 45 to 54 Years | 868 (84.9%) | 155 (15.1%) |
| 55 to 64 Years | 1,544 (83.1%) | 314 (16.9%) |
| 65 to 74 Years | 1,076 (100.0%) | 0 (0.0%) |
| 75 Years and older | 791 (100.0%) | 0 (0.0%) |
| Total | 10,769 (91.0%) | 1,062 (9.0%) |
Health Insurance Coverage by Citizenship Status in Beaufort
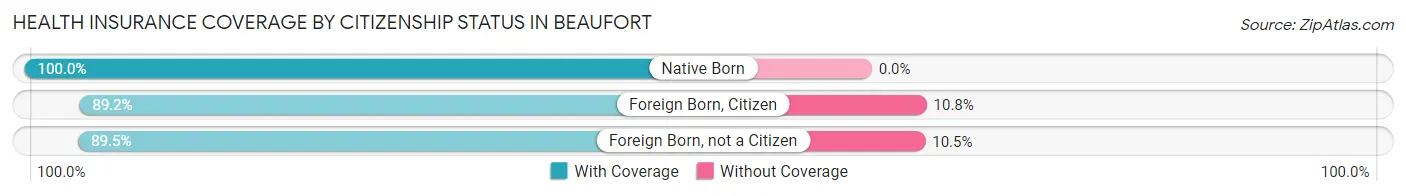
| Citizenship Status | With Coverage | Without Coverage |
| Native Born | 1,143 (100.0%) | 0 (0.0%) |
| Foreign Born, Citizen | 1,541 (89.2%) | 186 (10.8%) |
| Foreign Born, not a Citizen | 876 (89.5%) | 103 (10.5%) |
Health Insurance Coverage by Household Income in Beaufort
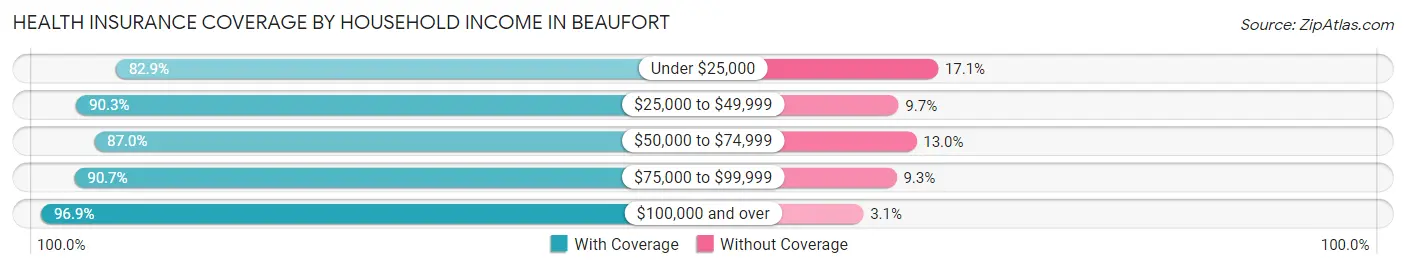
| Household Income | With Coverage | Without Coverage |
| Under $25,000 | 1,718 (82.9%) | 354 (17.1%) |
| $25,000 to $49,999 | 2,149 (90.3%) | 230 (9.7%) |
| $50,000 to $74,999 | 1,142 (87.0%) | 171 (13.0%) |
| $75,000 to $99,999 | 1,559 (90.7%) | 160 (9.3%) |
| $100,000 and over | 4,128 (96.9%) | 131 (3.1%) |
Public vs Private Health Insurance Coverage by Age in Beaufort
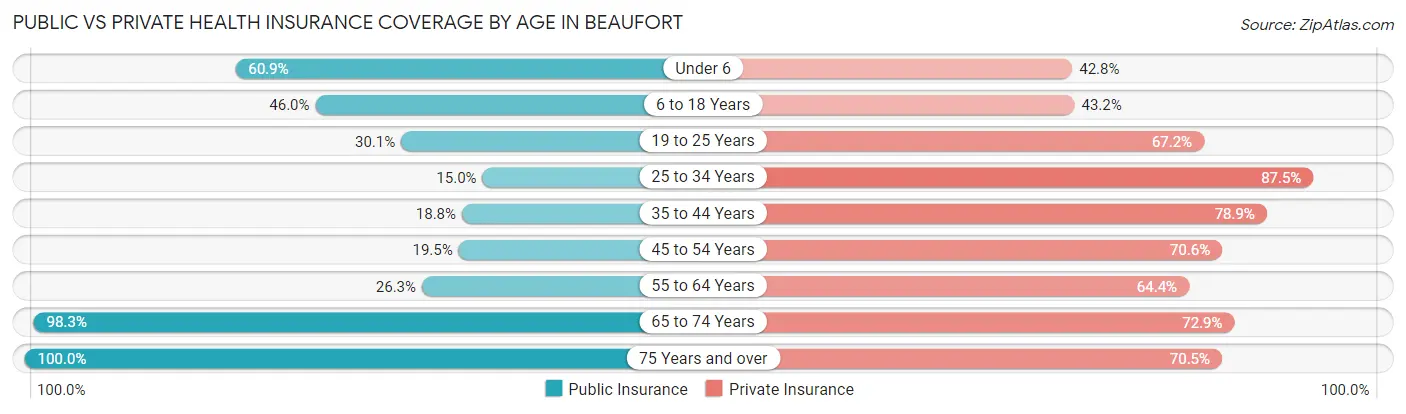
| Age Bracket | Public Insurance | Private Insurance |
| Under 6 | 696 (60.9%) | 489 (42.8%) |
| 6 to 18 Years | 795 (46.0%) | 746 (43.2%) |
| 19 to 25 Years | 295 (30.1%) | 658 (67.2%) |
| 25 to 34 Years | 323 (15.0%) | 1,882 (87.5%) |
| 35 to 44 Years | 204 (18.8%) | 854 (78.9%) |
| 45 to 54 Years | 199 (19.5%) | 722 (70.6%) |
| 55 to 64 Years | 488 (26.3%) | 1,197 (64.4%) |
| 65 to 74 Years | 1,058 (98.3%) | 784 (72.9%) |
| 75 Years and over | 791 (100.0%) | 558 (70.5%) |
| Total | 4,849 (41.0%) | 7,890 (66.7%) |
Disability Status by Sex by Age in Beaufort
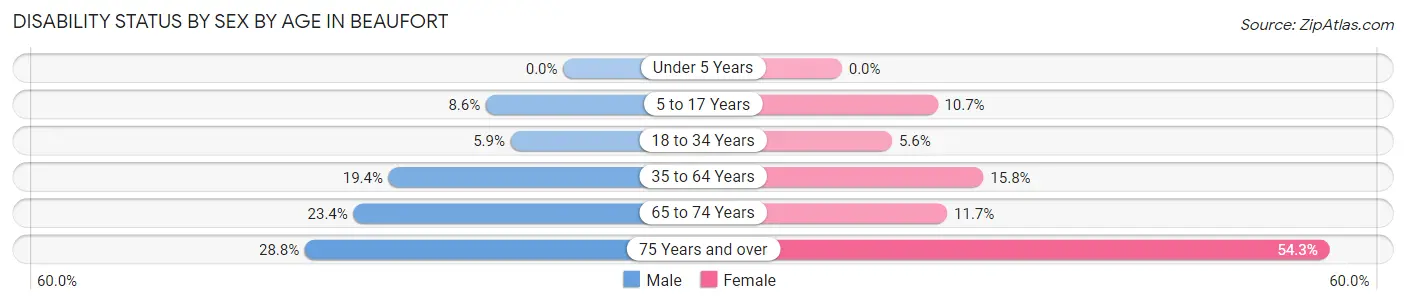
| Age Bracket | Male | Female |
| Under 5 Years | 0 (0.0%) | 0 (0.0%) |
| 5 to 17 Years | 60 (8.6%) | 116 (10.6%) |
| 18 to 34 Years | 85 (5.9%) | 96 (5.6%) |
| 35 to 64 Years | 312 (19.4%) | 372 (15.8%) |
| 65 to 74 Years | 100 (23.4%) | 76 (11.7%) |
| 75 Years and over | 101 (28.8%) | 239 (54.3%) |
Disability Class by Sex by Age in Beaufort
Disability Class: Hearing Difficulty
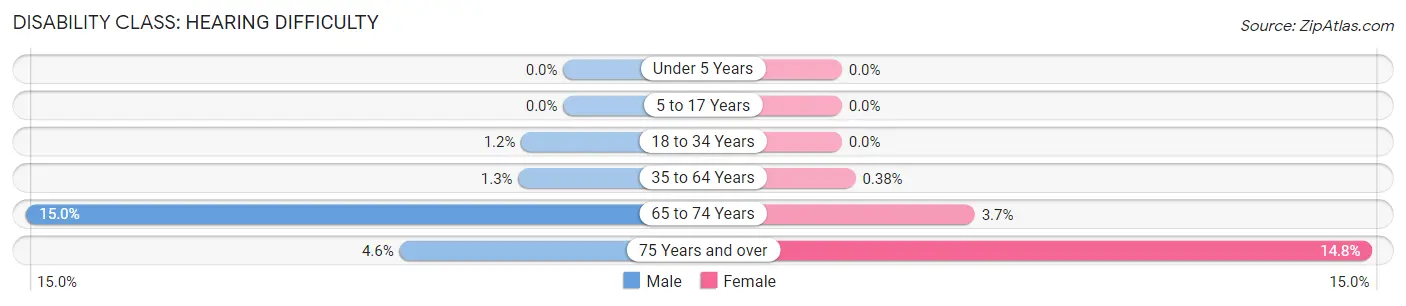
| Age Bracket | Male | Female |
| Under 5 Years | 0 (0.0%) | 0 (0.0%) |
| 5 to 17 Years | 0 (0.0%) | 0 (0.0%) |
| 18 to 34 Years | 17 (1.2%) | 0 (0.0%) |
| 35 to 64 Years | 20 (1.3%) | 9 (0.4%) |
| 65 to 74 Years | 64 (14.9%) | 24 (3.7%) |
| 75 Years and over | 16 (4.6%) | 65 (14.8%) |
Disability Class: Vision Difficulty
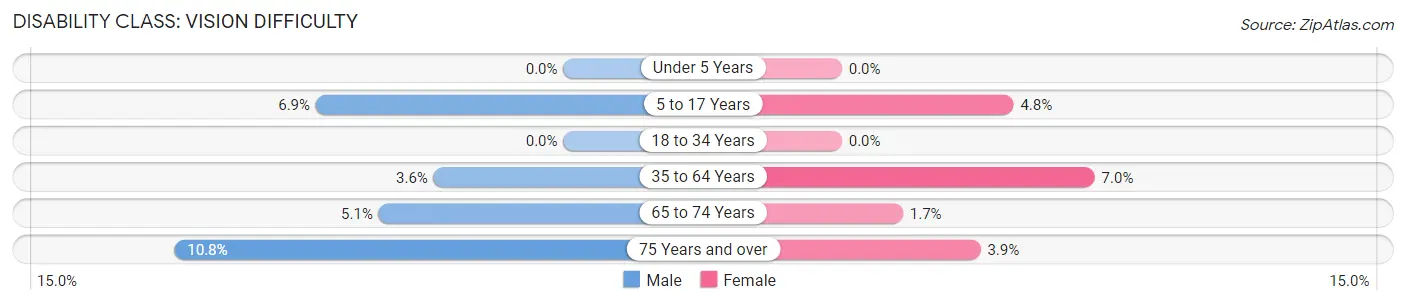
| Age Bracket | Male | Female |
| Under 5 Years | 0 (0.0%) | 0 (0.0%) |
| 5 to 17 Years | 48 (6.9%) | 52 (4.8%) |
| 18 to 34 Years | 0 (0.0%) | 0 (0.0%) |
| 35 to 64 Years | 58 (3.6%) | 166 (7.0%) |
| 65 to 74 Years | 22 (5.1%) | 11 (1.7%) |
| 75 Years and over | 38 (10.8%) | 17 (3.9%) |
Disability Class: Cognitive Difficulty
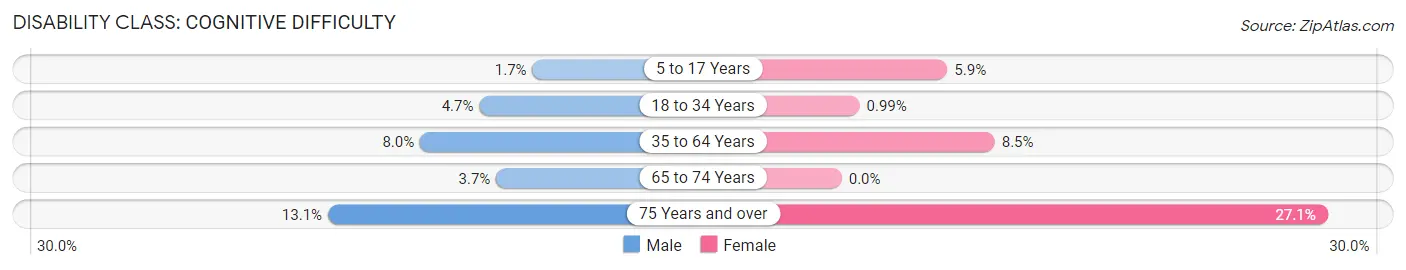
| Age Bracket | Male | Female |
| 5 to 17 Years | 12 (1.7%) | 64 (5.9%) |
| 18 to 34 Years | 68 (4.7%) | 17 (1.0%) |
| 35 to 64 Years | 128 (8.0%) | 201 (8.5%) |
| 65 to 74 Years | 16 (3.7%) | 0 (0.0%) |
| 75 Years and over | 46 (13.1%) | 119 (27.1%) |
Disability Class: Ambulatory Difficulty
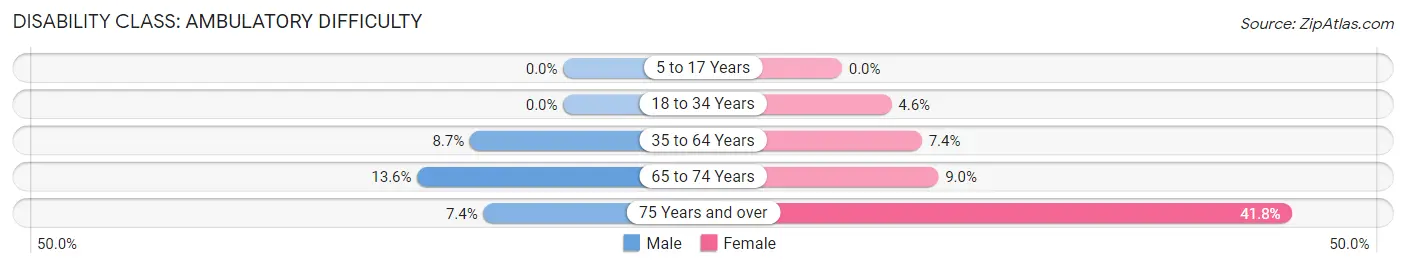
| Age Bracket | Male | Female |
| 5 to 17 Years | 0 (0.0%) | 0 (0.0%) |
| 18 to 34 Years | 0 (0.0%) | 79 (4.6%) |
| 35 to 64 Years | 139 (8.7%) | 175 (7.4%) |
| 65 to 74 Years | 58 (13.6%) | 58 (8.9%) |
| 75 Years and over | 26 (7.4%) | 184 (41.8%) |
Disability Class: Self-Care Difficulty
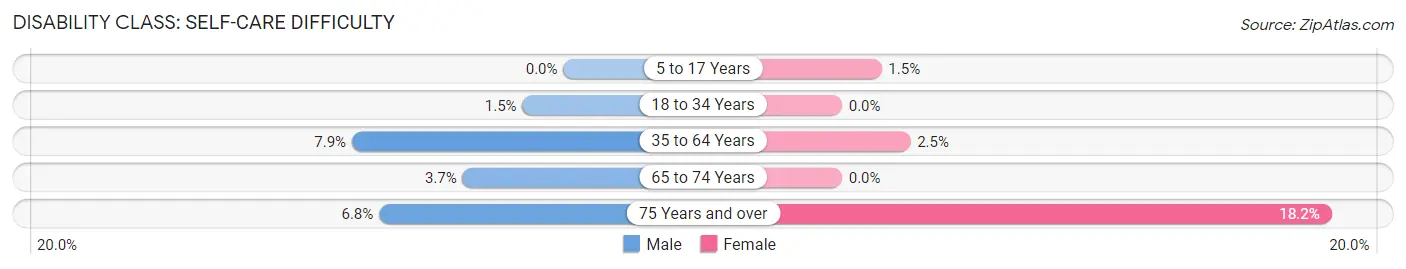
| Age Bracket | Male | Female |
| 5 to 17 Years | 0 (0.0%) | 16 (1.5%) |
| 18 to 34 Years | 22 (1.5%) | 0 (0.0%) |
| 35 to 64 Years | 126 (7.9%) | 60 (2.5%) |
| 65 to 74 Years | 16 (3.7%) | 0 (0.0%) |
| 75 Years and over | 24 (6.8%) | 80 (18.2%) |
Technology Access in Beaufort
Computing Device Access in Beaufort
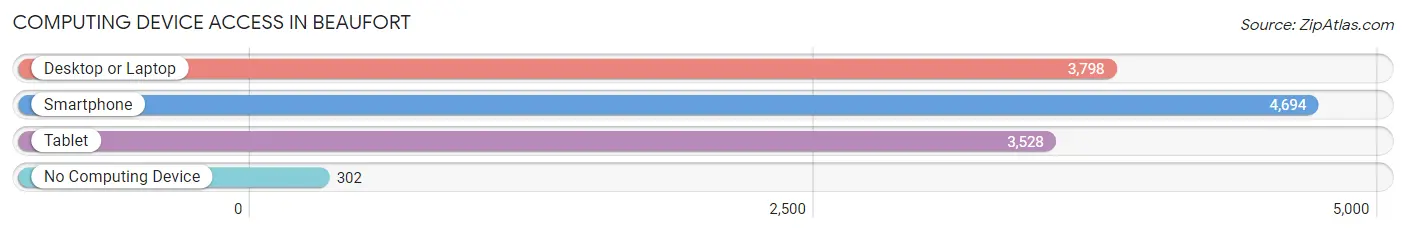
| Device Type | # Households | % Households |
| Desktop or Laptop | 3,798 | 74.2% |
| Smartphone | 4,694 | 91.7% |
| Tablet | 3,528 | 68.9% |
| No Computing Device | 302 | 5.9% |
| Total | 5,121 | 100.0% |
Internet Access in Beaufort
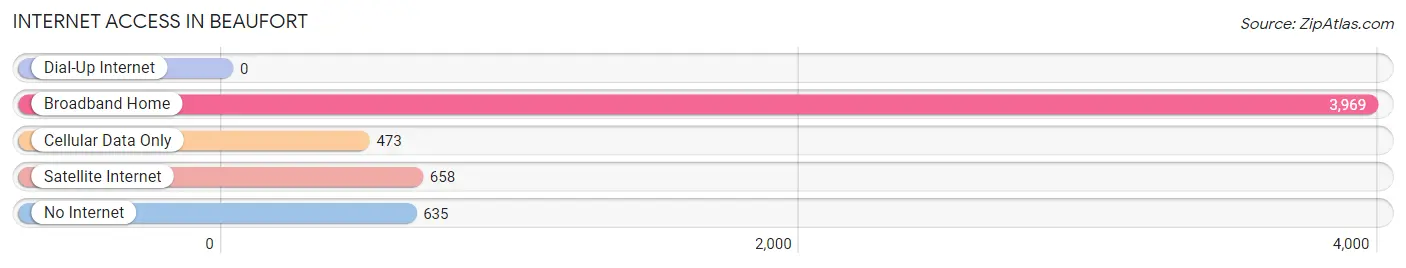
| Internet Type | # Households | % Households |
| Dial-Up Internet | 0 | 0.0% |
| Broadband Home | 3,969 | 77.5% |
| Cellular Data Only | 473 | 9.2% |
| Satellite Internet | 658 | 12.9% |
| No Internet | 635 | 12.4% |
| Total | 5,121 | 100.0% |
Beaufort Summary
Beaufort, South Carolina is a city located in Beaufort County, South Carolina, United States. It is the county seat of Beaufort County and the second-largest municipality in the state. The city's population was 12,361 at the 2010 census, up from its 2000 population of 11,419. Beaufort is a part of the Hilton Head Island-Bluffton-Beaufort, SC Metropolitan Statistical Area.
History
Beaufort was founded in 1711 by French Huguenot settlers. It was named after Henry Somerset, the Duke of Beaufort. The city was originally part of the Port Royal Sound area, which was part of the Province of Carolina. The city was a major port of entry for African slaves brought to the United States. During the American Revolution, the city was occupied by British forces from 1779 to 1782.
In 1861, Beaufort was the site of the first Confederate victory of the Civil War, the Battle of Port Royal. The city was occupied by Union forces from 1862 to 1865. After the war, the city was rebuilt and became a popular tourist destination.
Geography
Beaufort is located at 32°25'N 80°41'W (32.4167, -80.6833). It is situated on Port Royal Island, which is part of the Sea Islands chain that stretches along the Atlantic coast from South Carolina to Florida. The city is bordered to the north by the Beaufort River, to the east by the Atlantic Ocean, to the south by the Broad River, and to the west by the Coosaw River.
The city has a total area of 11.2 square miles (29.0 km2), of which 10.2 square miles (26.4 km2) is land and 1.0 square mile (2.6 km2) is water.
Economy
Beaufort's economy is largely based on tourism, with the city being a popular destination for visitors from around the world. The city is also home to several military installations, including Marine Corps Air Station Beaufort, Naval Hospital Beaufort, and Marine Corps Recruit Depot Parris Island.
The city is also home to several industries, including seafood processing, boat building, and paper and pulp production. The city is also home to several educational institutions, including the University of South Carolina Beaufort, Technical College of the Lowcountry, and Beaufort County Community College.
Demographics
As of the 2010 census, there were 12,361 people, 4,845 households, and 3,072 families residing in the city. The population density was 1,206.2 people per square mile (465.7/km2). There were 5,541 housing units at an average density of 541.3 per square mile (209.2/km2). The racial makeup of the city was 68.2% White, 28.2% African American, 0.3% Native American, 0.9% Asian, 0.1% Pacific Islander, 0.7% from other races, and 1.6% from two or more races. Hispanic or Latino of any race were 2.7% of the population.
There were 4,845 households, out of which 24.7% had children under the age of 18 living with them, 44.2% were married couples living together, 14.7% had a female householder with no husband present, and 36.2% were non-families. 29.2% of all households were made up of individuals, and 10.2% had someone living alone who was 65 years of age or older. The average household size was 2.41 and the average family size was 2.97.
In the city, the population was spread out, with 22.2% under the age of 18, 11.2% from 18 to 24, 25.2% from 25 to 44, 25.7% from 45 to 64, and 15.7% who were 65 years of age or older. The median age was 38 years. For every 100 females, there were 91.2 males. For every 100 females age 18 and over, there were 88.2 males.
The median income for a household in the city was $41,945, and the median income for a family was $50,945. Males had a median income of $35,945 versus $27,945 for females. The per capita income for the city was $22,945. About 10.2% of families and 13.2% of the population were below the poverty line, including 18.2% of those under age 18 and 8.2% of those age 65 or over.
Common Questions
What is Per Capita Income in Beaufort?
Per Capita income in Beaufort is $36,267.
What is the Median Family Income in Beaufort?
Median Family Income in Beaufort is $82,122.
What is the Median Household income in Beaufort?
Median Household Income in Beaufort is $60,366.
What is Income or Wage Gap in Beaufort?
Income or Wage Gap in Beaufort is 1.0%.
Women in Beaufort earn 99.0 cents for every dollar earned by a man.
What is Inequality or Gini Index in Beaufort?
Inequality or Gini Index in Beaufort is 0.46.
What is the Total Population of Beaufort?
Total Population of Beaufort is 13,582.
What is the Total Male Population of Beaufort?
Total Male Population of Beaufort is 6,447.
What is the Total Female Population of Beaufort?
Total Female Population of Beaufort is 7,135.
What is the Ratio of Males per 100 Females in Beaufort?
There are 90.36 Males per 100 Females in Beaufort.
What is the Ratio of Females per 100 Males in Beaufort?
There are 110.67 Females per 100 Males in Beaufort.
What is the Median Population Age in Beaufort?
Median Population Age in Beaufort is 33.1 Years.
What is the Average Family Size in Beaufort
Average Family Size in Beaufort is 2.9 People.
What is the Average Household Size in Beaufort
Average Household Size in Beaufort is 2.3 People.
How Large is the Labor Force in Beaufort?
There are 7,300 People in the Labor Forcein in Beaufort.
What is the Percentage of People in the Labor Force in Beaufort?
66.0% of People are in the Labor Force in Beaufort.
What is the Unemployment Rate in Beaufort?
Unemployment Rate in Beaufort is 4.0%.