Roebuck, SC Map & Demographics
Roebuck Map
Roebuck Overview
$27,227
PER CAPITA INCOME
$58,900
AVG FAMILY INCOME
$58,738
AVG HOUSEHOLD INCOME
0.8%
WAGE / INCOME GAP [ % ]
99.2¢/ $1
WAGE / INCOME GAP [ $ ]
0.33
INEQUALITY / GINI INDEX
3,837
TOTAL POPULATION
2,002
MALE POPULATION
1,835
FEMALE POPULATION
109.10
MALES / 100 FEMALES
91.66
FEMALES / 100 MALES
35.6
MEDIAN AGE
3.0
AVG FAMILY SIZE
2.7
AVG HOUSEHOLD SIZE
2,297
LABOR FORCE [ PEOPLE ]
72.2%
PERCENT IN LABOR FORCE
1.9%
UNEMPLOYMENT RATE
Roebuck Zip Codes
Roebuck Area Codes
Income in Roebuck
Income Overview in Roebuck
Per Capita Income in Roebuck is $27,227, while median incomes of families and households are $58,900 and $58,738 respectively.
| Characteristic | Number | Measure |
| Per Capita Income | 3,837 | $27,227 |
| Median Family Income | 1,150 | $58,900 |
| Mean Family Income | 1,150 | $72,980 |
| Median Household Income | 1,413 | $58,738 |
| Mean Household Income | 1,413 | $71,524 |
| Income Deficit | 1,150 | $0 |
| Wage / Income Gap (%) | 3,837 | 0.80% |
| Wage / Income Gap ($) | 3,837 | 99.20¢ per $1 |
| Gini / Inequality Index | 3,837 | 0.33 |
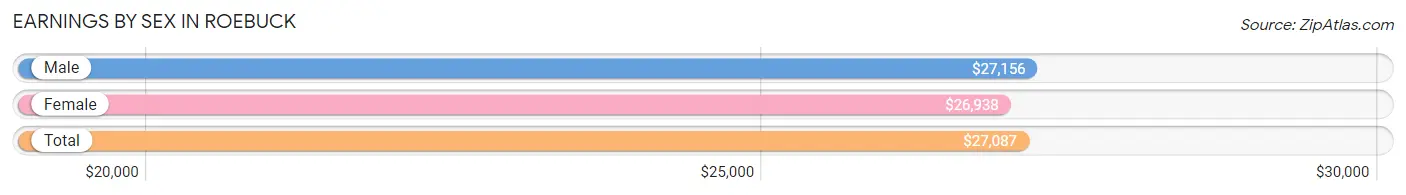
Earnings by Sex in Roebuck
Average Earnings in Roebuck are $27,087, $27,156 for men and $26,938 for women, a difference of 0.8%.
| Sex | Number | Average Earnings |
| Male | 1,207 (52.0%) | $27,156 |
| Female | 1,112 (47.9%) | $26,938 |
| Total | 2,319 (100.0%) | $27,087 |
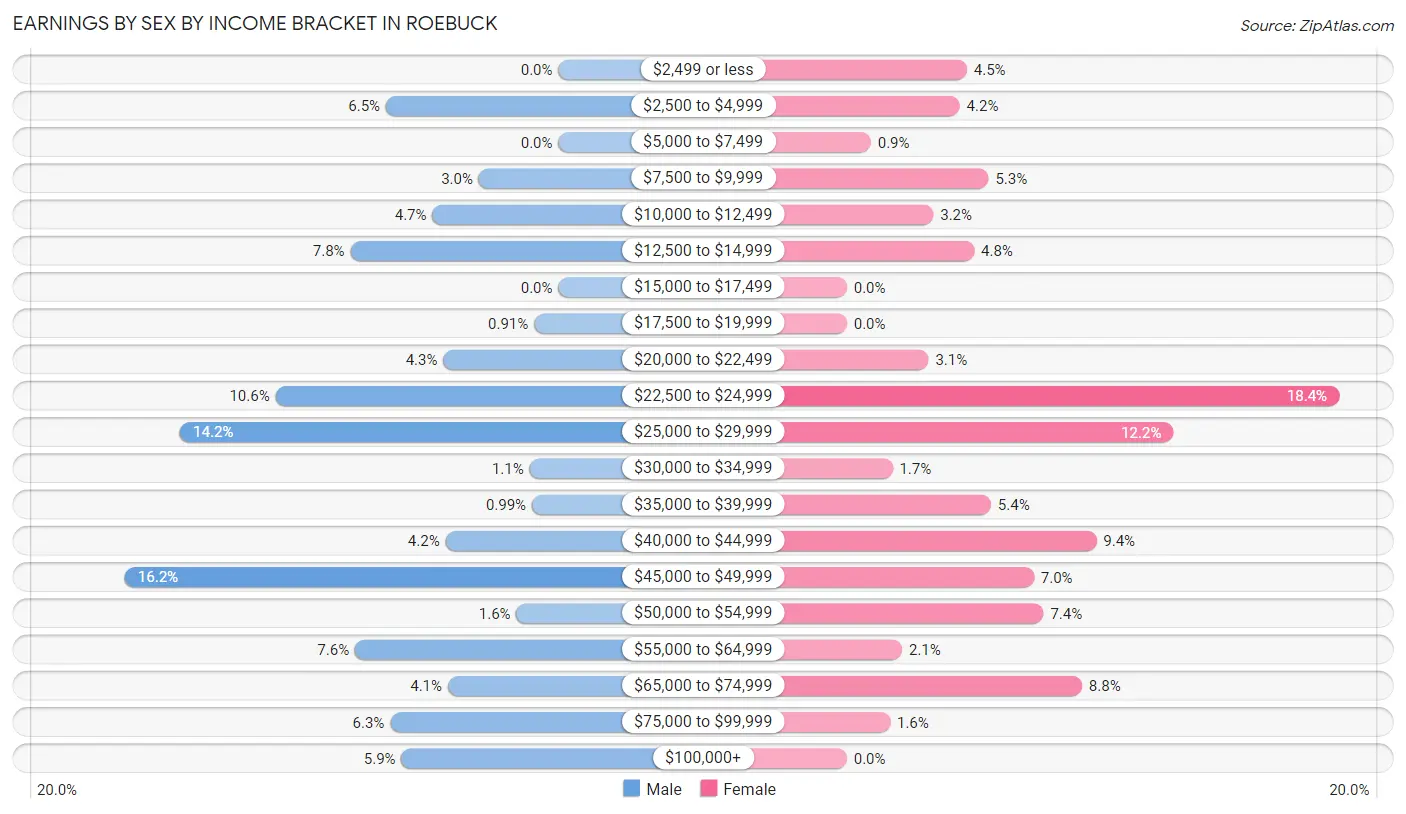
Earnings by Sex by Income Bracket in Roebuck
The most common earnings brackets in Roebuck are $45,000 to $49,999 for men (196 | 16.2%) and $22,500 to $24,999 for women (205 | 18.4%).
| Income | Male | Female |
| $2,499 or less | 0 (0.0%) | 50 (4.5%) |
| $2,500 to $4,999 | 78 (6.5%) | 47 (4.2%) |
| $5,000 to $7,499 | 0 (0.0%) | 10 (0.9%) |
| $7,500 to $9,999 | 36 (3.0%) | 59 (5.3%) |
| $10,000 to $12,499 | 57 (4.7%) | 36 (3.2%) |
| $12,500 to $14,999 | 94 (7.8%) | 53 (4.8%) |
| $15,000 to $17,499 | 0 (0.0%) | 0 (0.0%) |
| $17,500 to $19,999 | 11 (0.9%) | 0 (0.0%) |
| $20,000 to $22,499 | 52 (4.3%) | 34 (3.1%) |
| $22,500 to $24,999 | 128 (10.6%) | 205 (18.4%) |
| $25,000 to $29,999 | 171 (14.2%) | 136 (12.2%) |
| $30,000 to $34,999 | 13 (1.1%) | 19 (1.7%) |
| $35,000 to $39,999 | 12 (1.0%) | 60 (5.4%) |
| $40,000 to $44,999 | 51 (4.2%) | 104 (9.3%) |
| $45,000 to $49,999 | 196 (16.2%) | 78 (7.0%) |
| $50,000 to $54,999 | 19 (1.6%) | 82 (7.4%) |
| $55,000 to $64,999 | 92 (7.6%) | 23 (2.1%) |
| $65,000 to $74,999 | 50 (4.1%) | 98 (8.8%) |
| $75,000 to $99,999 | 76 (6.3%) | 18 (1.6%) |
| $100,000+ | 71 (5.9%) | 0 (0.0%) |
| Total | 1,207 (100.0%) | 1,112 (100.0%) |
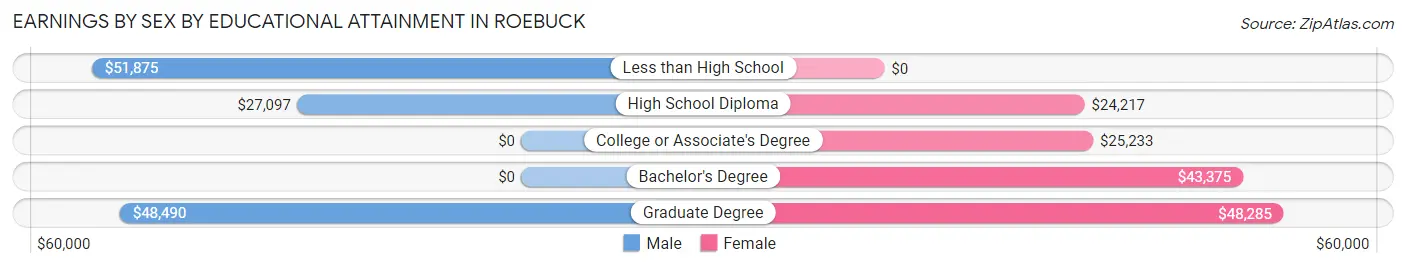
Earnings by Sex by Educational Attainment in Roebuck
Average earnings in Roebuck are $43,235 for men and $28,549 for women, a difference of 34.0%. Men with an educational attainment of less than high school enjoy the highest average annual earnings of $51,875, while those with high school diploma education earn the least with $27,097. Women with an educational attainment of graduate degree earn the most with the average annual earnings of $48,285, while those with high school diploma education have the smallest earnings of $24,217.
| Educational Attainment | Male Income | Female Income |
| Less than High School | $51,875 | $0 |
| High School Diploma | $27,097 | $24,217 |
| College or Associate's Degree | - | - |
| Bachelor's Degree | - | - |
| Graduate Degree | $48,490 | $48,285 |
| Total | $43,235 | $28,549 |
Family Income in Roebuck
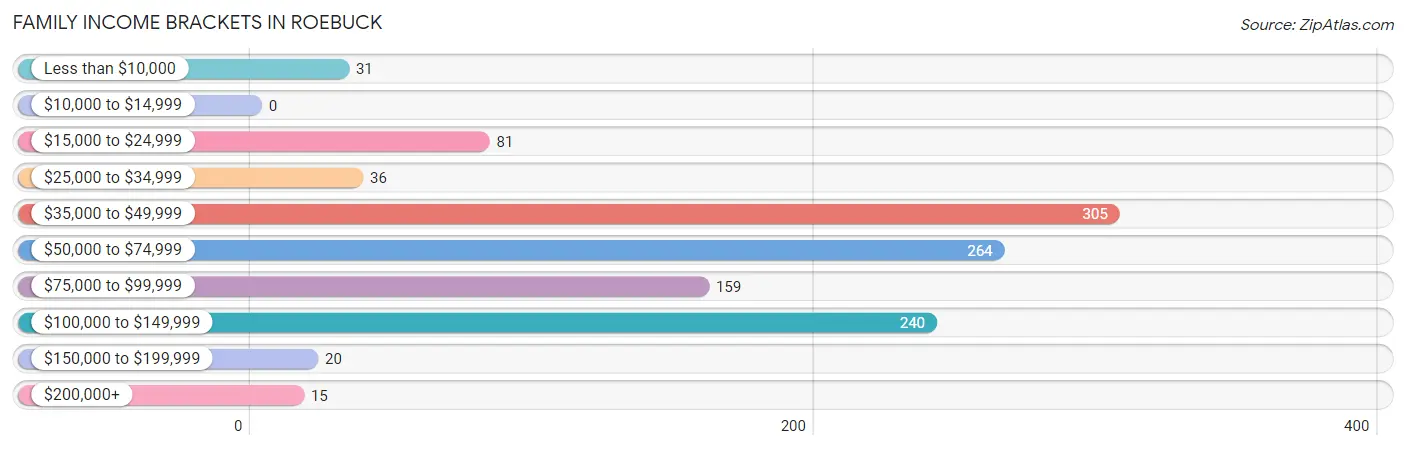
Family Income Brackets in Roebuck
According to the Roebuck family income data, there are 305 families falling into the $35,000 to $49,999 income range, which is the most common income bracket and makes up 26.5% of all families.
| Income Bracket | # Families | % Families |
| Less than $10,000 | 31 | 2.7% |
| $10,000 to $14,999 | 0 | 0.0% |
| $15,000 to $24,999 | 81 | 7.0% |
| $25,000 to $34,999 | 36 | 3.1% |
| $35,000 to $49,999 | 305 | 26.5% |
| $50,000 to $74,999 | 264 | 23.0% |
| $75,000 to $99,999 | 159 | 13.8% |
| $100,000 to $149,999 | 240 | 20.9% |
| $150,000 to $199,999 | 20 | 1.7% |
| $200,000+ | 15 | 1.3% |
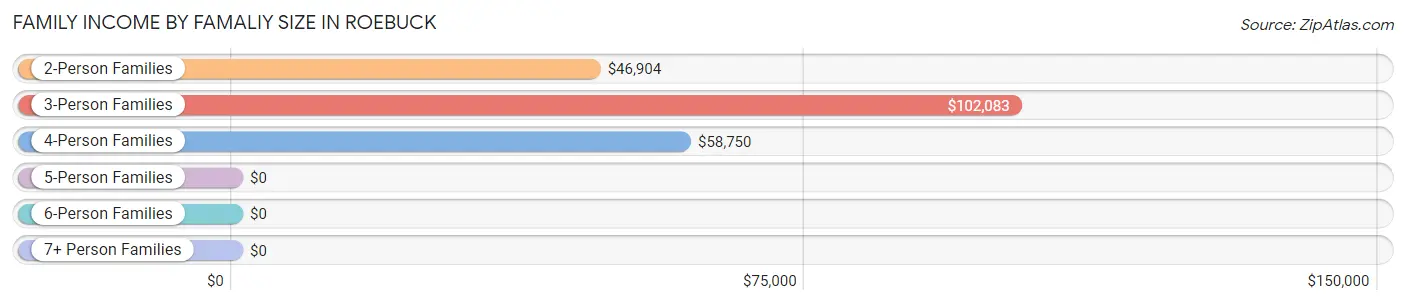
Family Income by Famaliy Size in Roebuck
3-person families (217 | 18.9%) account for the highest median family income in Roebuck with $102,083 per family, while 3-person families (217 | 18.9%) have the highest median income of $34,028 per family member.
| Income Bracket | # Families | Median Income |
| 2-Person Families | 624 (54.3%) | $46,904 |
| 3-Person Families | 217 (18.9%) | $102,083 |
| 4-Person Families | 168 (14.6%) | $58,750 |
| 5-Person Families | 74 (6.4%) | $0 |
| 6-Person Families | 60 (5.2%) | $0 |
| 7+ Person Families | 7 (0.6%) | $0 |
| Total | 1,150 (100.0%) | $58,900 |
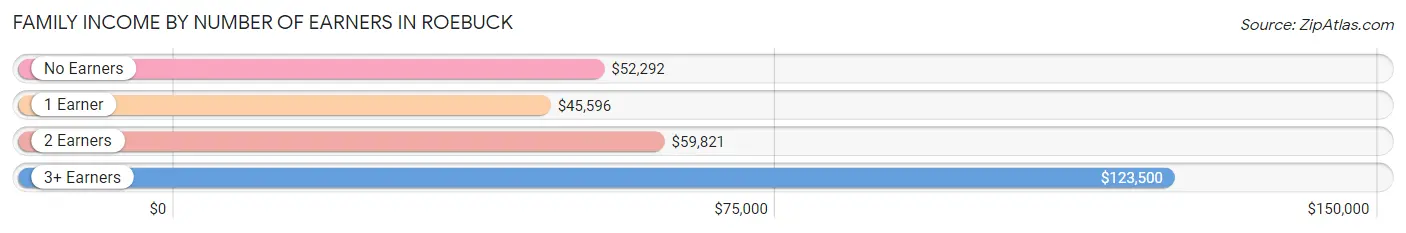
Family Income by Number of Earners in Roebuck
The median family income in Roebuck is $58,900, with families comprising 3+ earners (112) having the highest median family income of $123,500, while families with 1 earner (241) have the lowest median family income of $45,596, accounting for 9.7% and 21.0% of families, respectively.
| Number of Earners | # Families | Median Income |
| No Earners | 148 (12.9%) | $52,292 |
| 1 Earner | 241 (21.0%) | $45,596 |
| 2 Earners | 649 (56.4%) | $59,821 |
| 3+ Earners | 112 (9.7%) | $123,500 |
| Total | 1,150 (100.0%) | $58,900 |
Household Income in Roebuck
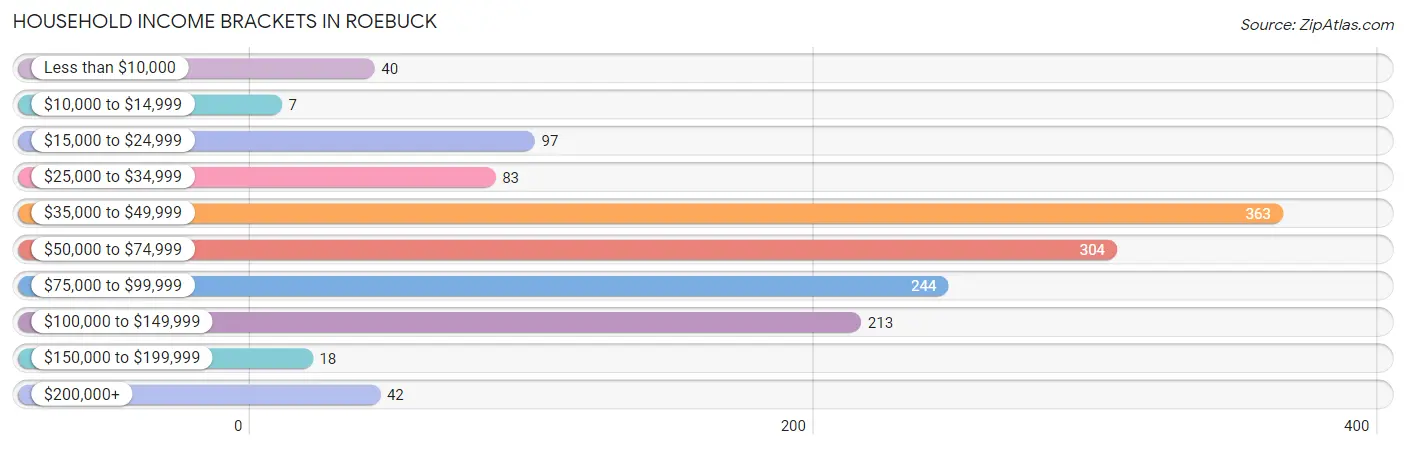
Household Income Brackets in Roebuck
With 363 households falling in the category, the $35,000 to $49,999 income range is the most frequent in Roebuck, accounting for 25.7% of all households. In contrast, only 7 households (0.5%) fall into the $10,000 to $14,999 income bracket, making it the least populous group.
| Income Bracket | # Households | % Households |
| Less than $10,000 | 40 | 2.8% |
| $10,000 to $14,999 | 7 | 0.5% |
| $15,000 to $24,999 | 97 | 6.9% |
| $25,000 to $34,999 | 83 | 5.9% |
| $35,000 to $49,999 | 363 | 25.7% |
| $50,000 to $74,999 | 304 | 21.5% |
| $75,000 to $99,999 | 244 | 17.3% |
| $100,000 to $149,999 | 213 | 15.1% |
| $150,000 to $199,999 | 18 | 1.3% |
| $200,000+ | 42 | 3.0% |
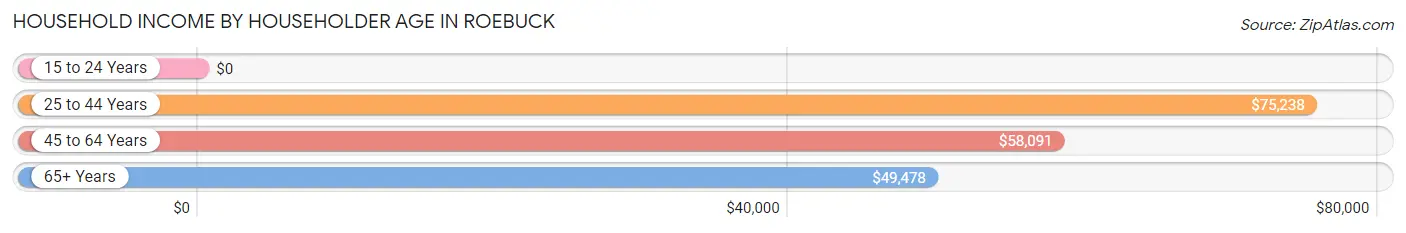
Household Income by Householder Age in Roebuck
The median household income in Roebuck is $58,738, with the highest median household income of $75,238 found in the 25 to 44 years age bracket for the primary householder. A total of 530 households (37.5%) fall into this category.
| Income Bracket | # Households | Median Income |
| 15 to 24 Years | 0 (0.0%) | $0 |
| 25 to 44 Years | 530 (37.5%) | $75,238 |
| 45 to 64 Years | 645 (45.7%) | $58,091 |
| 65+ Years | 238 (16.8%) | $49,478 |
| Total | 1,413 (100.0%) | $58,738 |
Poverty in Roebuck
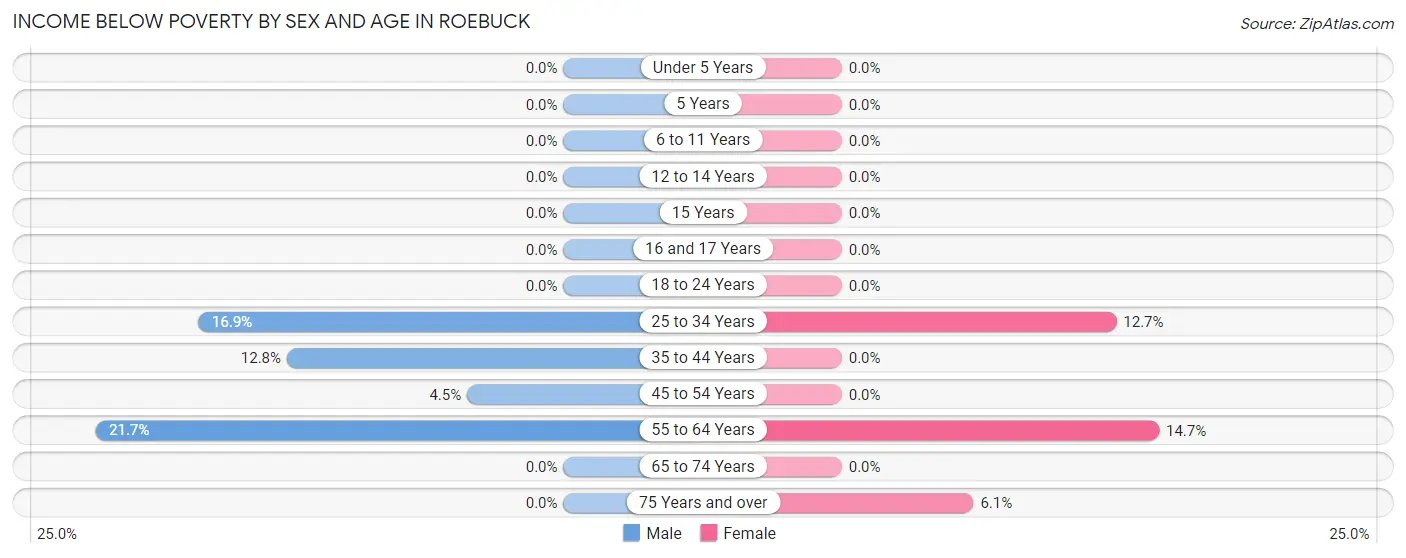
Income Below Poverty by Sex and Age in Roebuck
With 7.6% poverty level for males and 5.3% for females among the residents of Roebuck, 55 to 64 year old males and 55 to 64 year old females are the most vulnerable to poverty, with 31 males (21.7%) and 29 females (14.7%) in their respective age groups living below the poverty level.
| Age Bracket | Male | Female |
| Under 5 Years | 0 (0.0%) | 0 (0.0%) |
| 5 Years | 0 (0.0%) | 0 (0.0%) |
| 6 to 11 Years | 0 (0.0%) | 0 (0.0%) |
| 12 to 14 Years | 0 (0.0%) | 0 (0.0%) |
| 15 Years | 0 (0.0%) | 0 (0.0%) |
| 16 and 17 Years | 0 (0.0%) | 0 (0.0%) |
| 18 to 24 Years | 0 (0.0%) | 0 (0.0%) |
| 25 to 34 Years | 70 (16.9%) | 60 (12.7%) |
| 35 to 44 Years | 34 (12.8%) | 0 (0.0%) |
| 45 to 54 Years | 17 (4.5%) | 0 (0.0%) |
| 55 to 64 Years | 31 (21.7%) | 29 (14.7%) |
| 65 to 74 Years | 0 (0.0%) | 0 (0.0%) |
| 75 Years and over | 0 (0.0%) | 8 (6.1%) |
| Total | 152 (7.6%) | 97 (5.3%) |
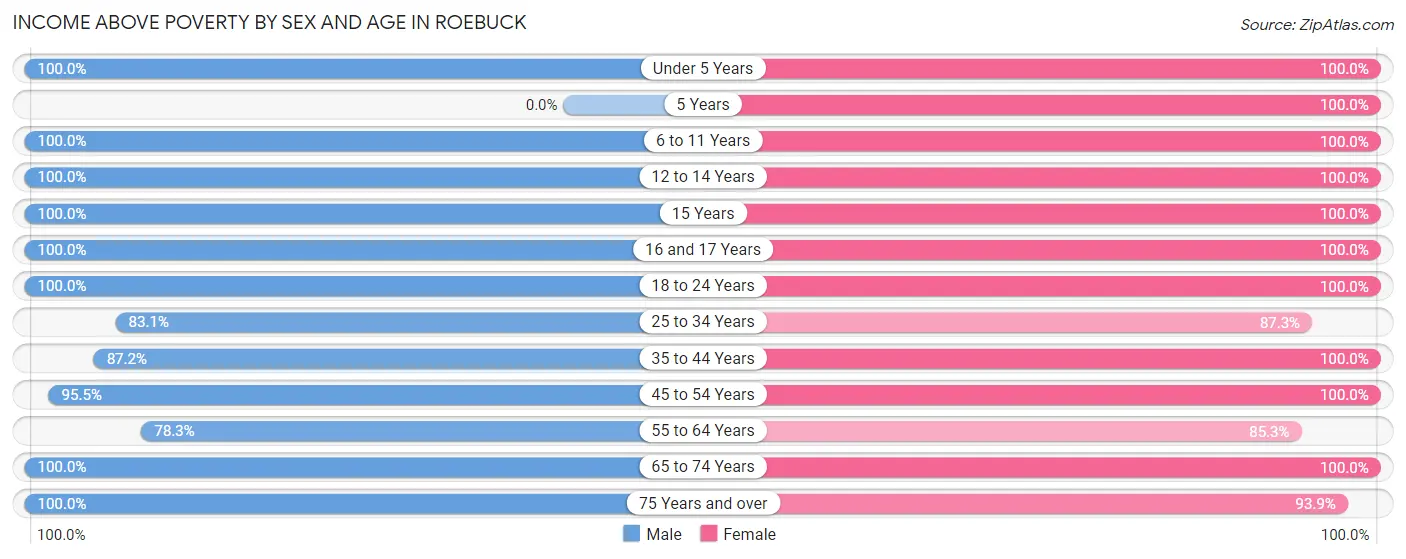
Income Above Poverty by Sex and Age in Roebuck
According to the poverty statistics in Roebuck, males aged under 5 years and females aged under 5 years are the age groups that are most secure financially, with 100.0% of males and 100.0% of females in these age groups living above the poverty line.
| Age Bracket | Male | Female |
| Under 5 Years | 125 (100.0%) | 91 (100.0%) |
| 5 Years | 0 (0.0%) | 8 (100.0%) |
| 6 to 11 Years | 173 (100.0%) | 37 (100.0%) |
| 12 to 14 Years | 63 (100.0%) | 81 (100.0%) |
| 15 Years | 43 (100.0%) | 35 (100.0%) |
| 16 and 17 Years | 108 (100.0%) | 47 (100.0%) |
| 18 to 24 Years | 122 (100.0%) | 67 (100.0%) |
| 25 to 34 Years | 344 (83.1%) | 411 (87.3%) |
| 35 to 44 Years | 231 (87.2%) | 186 (100.0%) |
| 45 to 54 Years | 363 (95.5%) | 359 (100.0%) |
| 55 to 64 Years | 112 (78.3%) | 168 (85.3%) |
| 65 to 74 Years | 105 (100.0%) | 125 (100.0%) |
| 75 Years and over | 61 (100.0%) | 123 (93.9%) |
| Total | 1,850 (92.4%) | 1,738 (94.7%) |
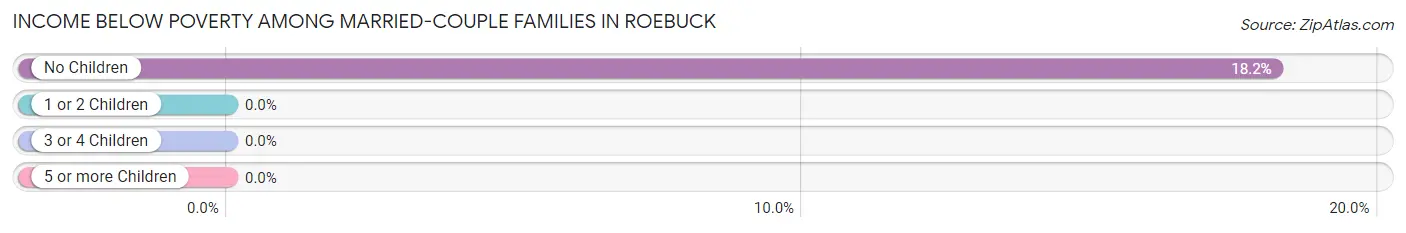
Income Below Poverty Among Married-Couple Families in Roebuck
The poverty statistics for married-couple families in Roebuck show that 11.6% or 101 of the total 868 families live below the poverty line. Families with no children have the highest poverty rate of 18.2%, comprising of 101 families. On the other hand, families with 1 or 2 children have the lowest poverty rate of 0.0%, which includes 0 families.
| Children | Above Poverty | Below Poverty |
| No Children | 454 (81.8%) | 101 (18.2%) |
| 1 or 2 Children | 221 (100.0%) | 0 (0.0%) |
| 3 or 4 Children | 92 (100.0%) | 0 (0.0%) |
| 5 or more Children | 0 (0.0%) | 0 (0.0%) |
| Total | 767 (88.4%) | 101 (11.6%) |
Income Below Poverty Among Single-Parent Households in Roebuck
| Children | Single Father | Single Mother |
| No Children | 0 (0.0%) | 0 (0.0%) |
| 1 or 2 Children | 0 (0.0%) | 0 (0.0%) |
| 3 or 4 Children | 0 (0.0%) | 0 (0.0%) |
| 5 or more Children | 0 (0.0%) | 0 (0.0%) |
| Total | 0 (0.0%) | 0 (0.0%) |
Income Below Poverty Among Married-Couple vs Single-Parent Households in Roebuck
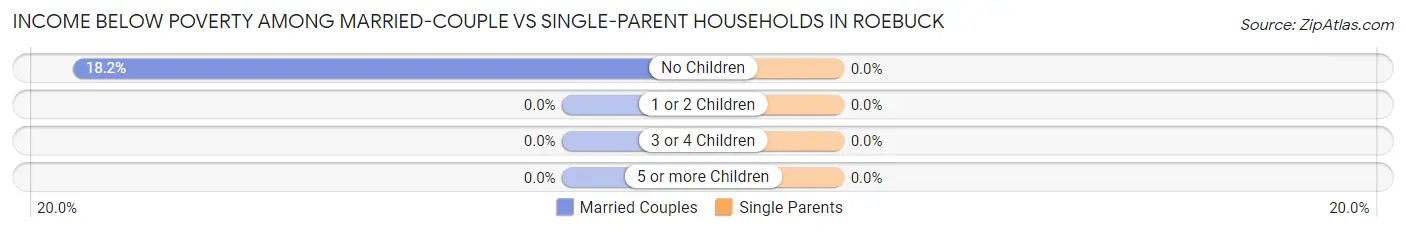
| Children | Married-Couple Families | Single-Parent Households |
| No Children | 101 (18.2%) | 0 (0.0%) |
| 1 or 2 Children | 0 (0.0%) | 0 (0.0%) |
| 3 or 4 Children | 0 (0.0%) | 0 (0.0%) |
| 5 or more Children | 0 (0.0%) | 0 (0.0%) |
| Total | 101 (11.6%) | 0 (0.0%) |
Race in Roebuck
The most populous races in Roebuck are White / Caucasian (2,429 | 63.3%), Black / African American (936 | 24.4%), and Hispanic or Latino (368 | 9.6%).
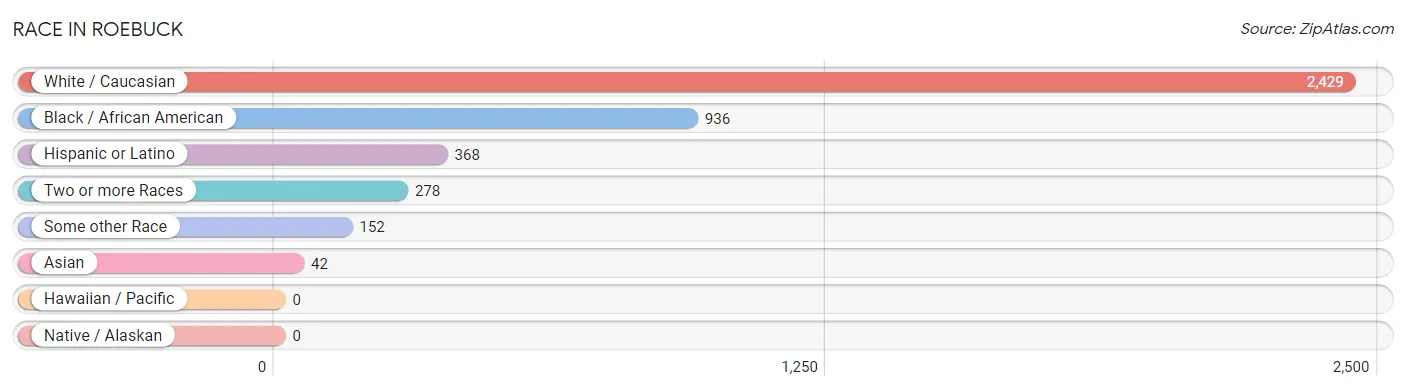
| Race | # Population | % Population |
| Asian | 42 | 1.1% |
| Black / African American | 936 | 24.4% |
| Hawaiian / Pacific | 0 | 0.0% |
| Hispanic or Latino | 368 | 9.6% |
| Native / Alaskan | 0 | 0.0% |
| White / Caucasian | 2,429 | 63.3% |
| Two or more Races | 278 | 7.2% |
| Some other Race | 152 | 4.0% |
| Total | 3,837 | 100.0% |
Ancestry in Roebuck
The most populous ancestries reported in Roebuck are Irish (500 | 13.0%), American (454 | 11.8%), English (345 | 9.0%), German (343 | 8.9%), and Polish (184 | 4.8%), together accounting for 47.6% of all Roebuck residents.
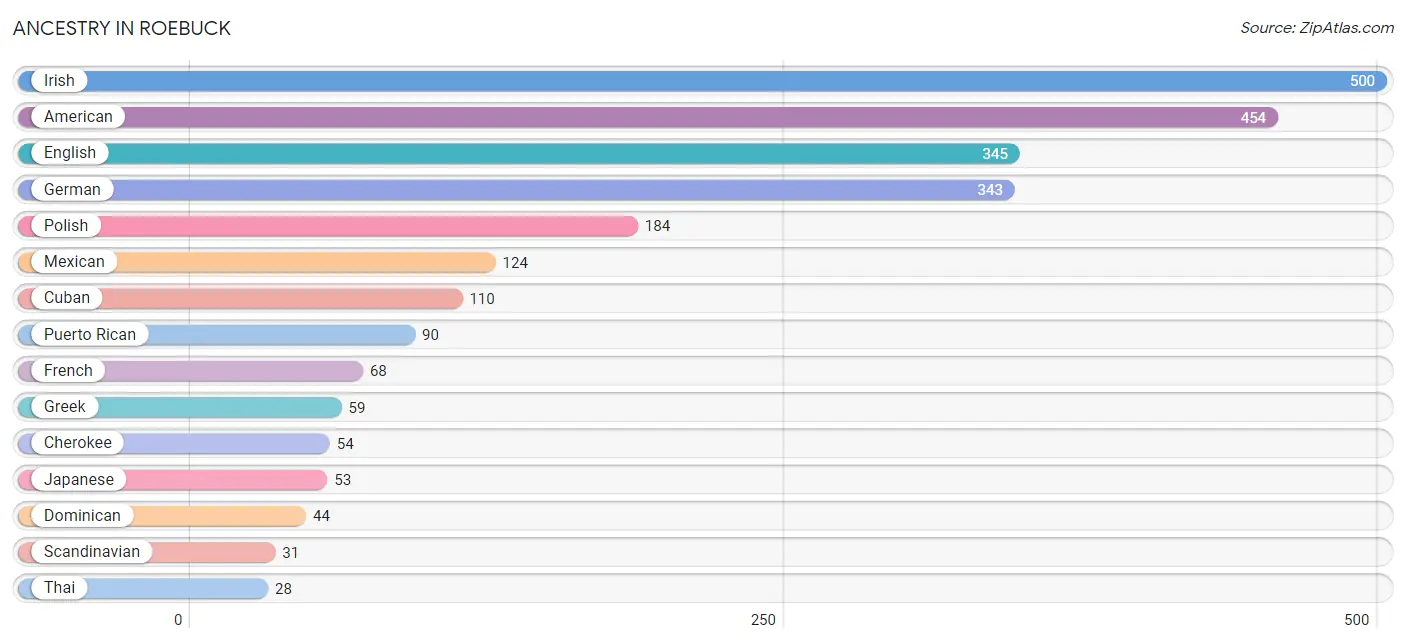
| Ancestry | # Population | % Population |
| African | 23 | 0.6% |
| American | 454 | 11.8% |
| British | 15 | 0.4% |
| Cherokee | 54 | 1.4% |
| Creek | 8 | 0.2% |
| Cuban | 110 | 2.9% |
| Dominican | 44 | 1.1% |
| Dutch | 7 | 0.2% |
| English | 345 | 9.0% |
| French | 68 | 1.8% |
| French Canadian | 9 | 0.2% |
| German | 343 | 8.9% |
| Greek | 59 | 1.5% |
| Irish | 500 | 13.0% |
| Italian | 14 | 0.4% |
| Japanese | 53 | 1.4% |
| Mexican | 124 | 3.2% |
| Norwegian | 9 | 0.2% |
| Polish | 184 | 4.8% |
| Puerto Rican | 90 | 2.4% |
| Scandinavian | 31 | 0.8% |
| Scottish | 11 | 0.3% |
| Subsaharan African | 23 | 0.6% |
| Swedish | 16 | 0.4% |
| Swiss | 21 | 0.5% |
| Thai | 28 | 0.7% |
| Ukrainian | 10 | 0.3% | View All 27 Rows |
Immigrants in Roebuck
The most numerous immigrant groups reported in Roebuck came from Latin America (69 | 1.8%), Central America (46 | 1.2%), Mexico (46 | 1.2%), Caribbean (23 | 0.6%), and Dominican Republic (23 | 0.6%), together accounting for 5.4% of all Roebuck residents.
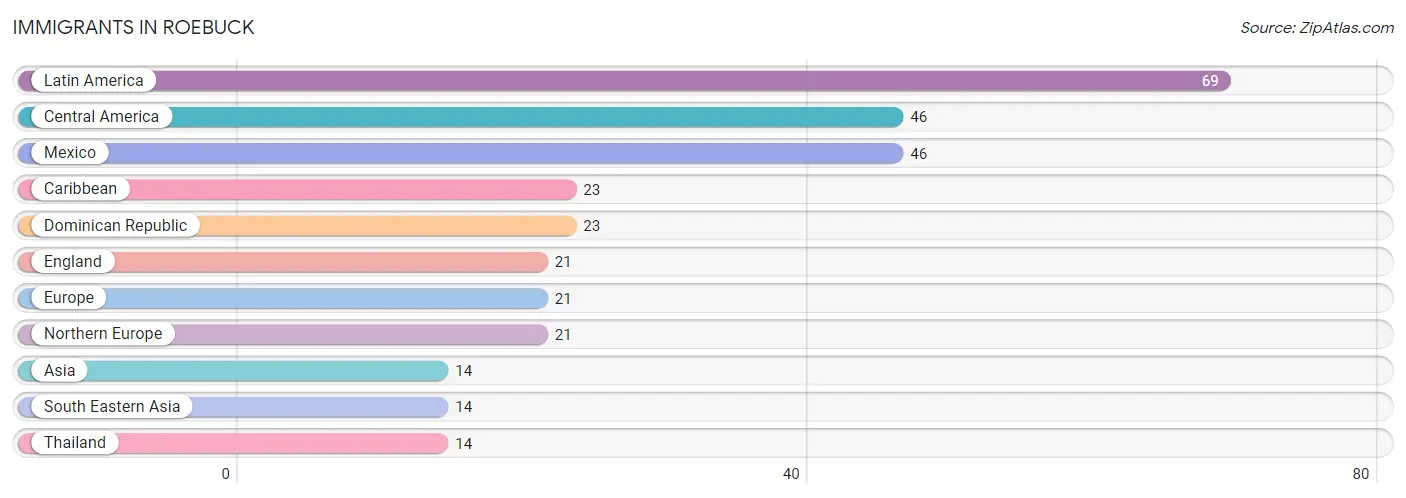
| Immigration Origin | # Population | % Population |
| Asia | 14 | 0.4% |
| Caribbean | 23 | 0.6% |
| Central America | 46 | 1.2% |
| Dominican Republic | 23 | 0.6% |
| England | 21 | 0.5% |
| Europe | 21 | 0.5% |
| Latin America | 69 | 1.8% |
| Mexico | 46 | 1.2% |
| Northern Europe | 21 | 0.5% |
| South Eastern Asia | 14 | 0.4% |
| Thailand | 14 | 0.4% | View All 11 Rows |
Sex and Age in Roebuck
Sex and Age in Roebuck
The most populous age groups in Roebuck are 30 to 34 Years (296 | 14.8%) for men and 30 to 34 Years (270 | 14.7%) for women.
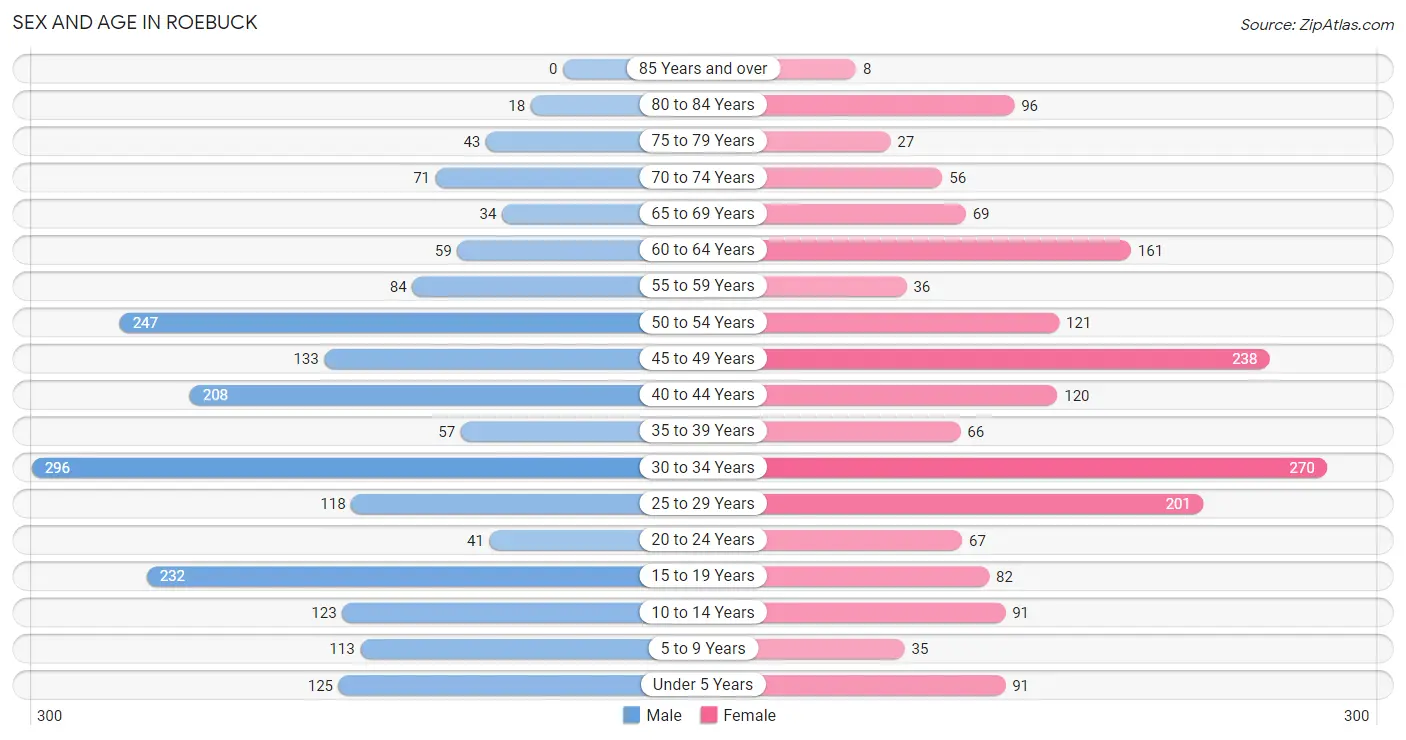
| Age Bracket | Male | Female |
| Under 5 Years | 125 (6.2%) | 91 (5.0%) |
| 5 to 9 Years | 113 (5.6%) | 35 (1.9%) |
| 10 to 14 Years | 123 (6.1%) | 91 (5.0%) |
| 15 to 19 Years | 232 (11.6%) | 82 (4.5%) |
| 20 to 24 Years | 41 (2.1%) | 67 (3.6%) |
| 25 to 29 Years | 118 (5.9%) | 201 (11.0%) |
| 30 to 34 Years | 296 (14.8%) | 270 (14.7%) |
| 35 to 39 Years | 57 (2.9%) | 66 (3.6%) |
| 40 to 44 Years | 208 (10.4%) | 120 (6.5%) |
| 45 to 49 Years | 133 (6.6%) | 238 (13.0%) |
| 50 to 54 Years | 247 (12.3%) | 121 (6.6%) |
| 55 to 59 Years | 84 (4.2%) | 36 (2.0%) |
| 60 to 64 Years | 59 (2.9%) | 161 (8.8%) |
| 65 to 69 Years | 34 (1.7%) | 69 (3.8%) |
| 70 to 74 Years | 71 (3.5%) | 56 (3.0%) |
| 75 to 79 Years | 43 (2.1%) | 27 (1.5%) |
| 80 to 84 Years | 18 (0.9%) | 96 (5.2%) |
| 85 Years and over | 0 (0.0%) | 8 (0.4%) |
| Total | 2,002 (100.0%) | 1,835 (100.0%) |
Families and Households in Roebuck
Median Family Size in Roebuck
The median family size in Roebuck is 2.98 persons per family, with married-couple families (868 | 75.5%) accounting for the largest median family size of 3.1 persons per family. On the other hand, single male/father families (101 | 8.8%) represent the smallest median family size with 2.36 persons per family.
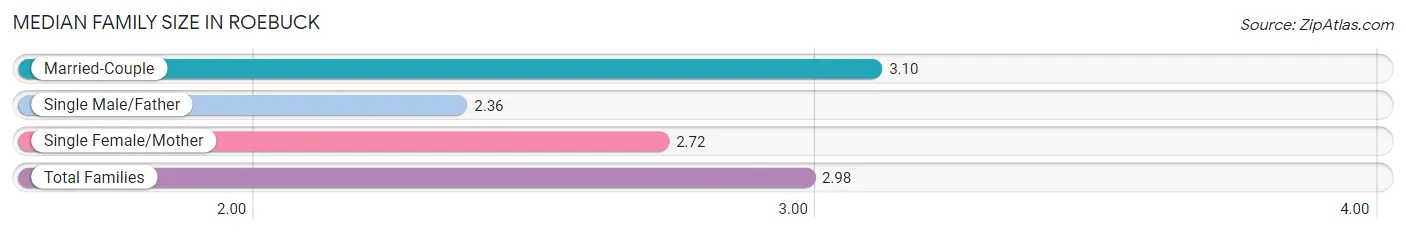
| Family Type | # Families | Family Size |
| Married-Couple | 868 (75.5%) | 3.10 |
| Single Male/Father | 101 (8.8%) | 2.36 |
| Single Female/Mother | 181 (15.7%) | 2.72 |
| Total Families | 1,150 (100.0%) | 2.98 |
Median Household Size in Roebuck
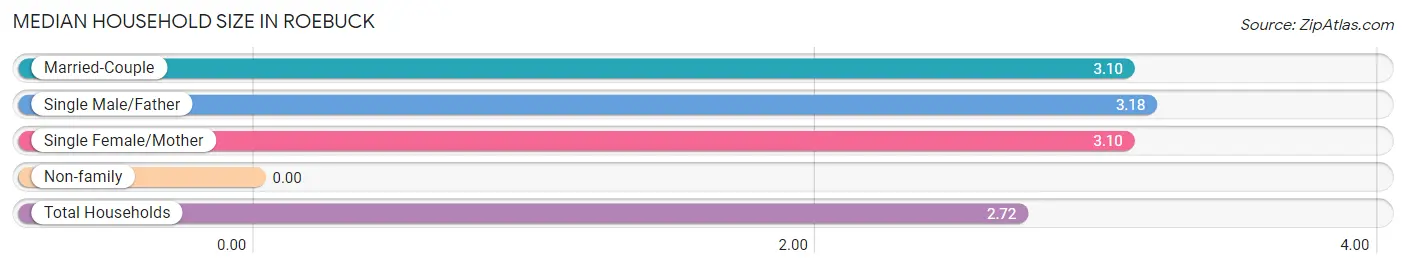
| Household Type | # Households | Household Size |
| Married-Couple | 868 (61.4%) | 3.10 |
| Single Male/Father | 101 (7.1%) | 3.18 |
| Single Female/Mother | 181 (12.8%) | 3.10 |
| Non-family | 263 (18.6%) | - |
| Total Households | 1,413 (100.0%) | 2.72 |
Household Size by Marriage Status in Roebuck
Out of a total of 1,413 households in Roebuck, 1,150 (81.4%) are family households, while 263 (18.6%) are nonfamily households. The most numerous type of family households are 2-person households, comprising 514, and the most common type of nonfamily households are 1-person households, comprising 263.
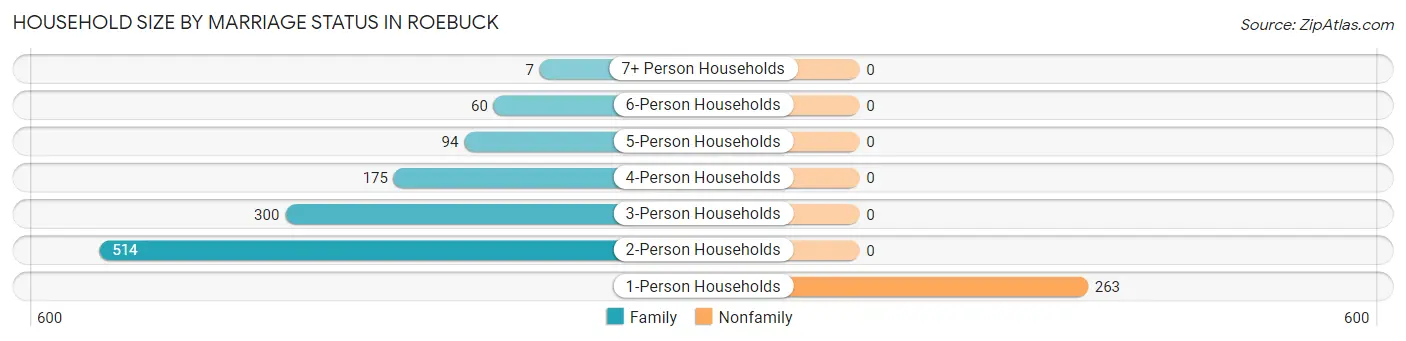
| Household Size | Family Households | Nonfamily Households |
| 1-Person Households | - | 263 (18.6%) |
| 2-Person Households | 514 (36.4%) | 0 (0.0%) |
| 3-Person Households | 300 (21.2%) | 0 (0.0%) |
| 4-Person Households | 175 (12.4%) | 0 (0.0%) |
| 5-Person Households | 94 (6.7%) | 0 (0.0%) |
| 6-Person Households | 60 (4.3%) | 0 (0.0%) |
| 7+ Person Households | 7 (0.5%) | 0 (0.0%) |
| Total | 1,150 (81.4%) | 263 (18.6%) |
Female Fertility in Roebuck
Fertility by Age in Roebuck
Average fertility rate in Roebuck is 37.0 births per 1,000 women. Women in the age bracket of 20 to 34 years have the highest fertility rate with 74.0 births per 1,000 women. Women in the age bracket of 20 to 34 years acount for 100.0% of all women with births.
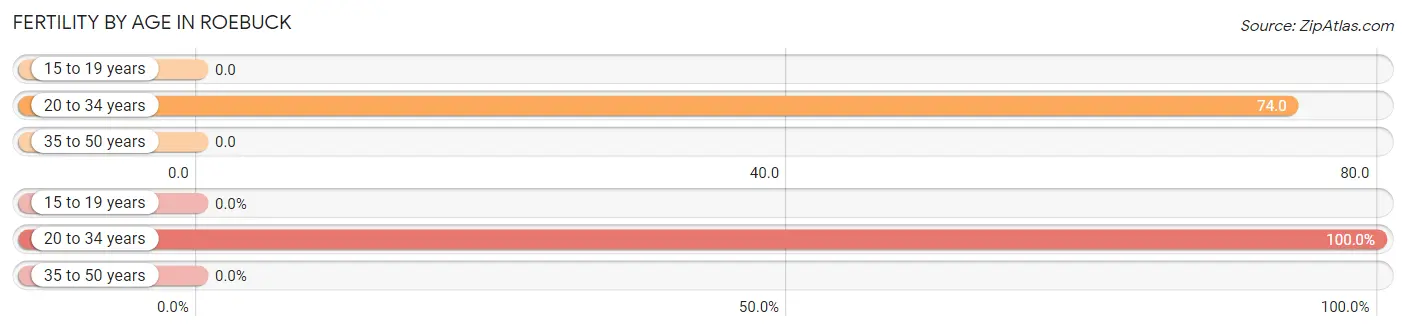
| Age Bracket | Women with Births | Births / 1,000 Women |
| 15 to 19 years | 0 (0.0%) | 0.0 |
| 20 to 34 years | 40 (100.0%) | 74.0 |
| 35 to 50 years | 0 (0.0%) | 0.0 |
| Total | 40 (100.0%) | 37.0 |
Fertility by Age by Marriage Status in Roebuck
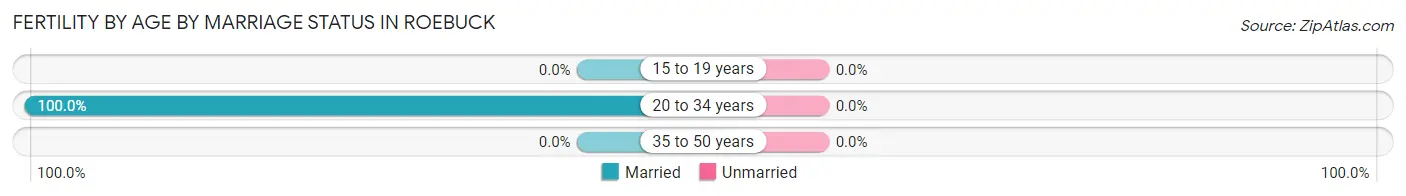
| Age Bracket | Married | Unmarried |
| 15 to 19 years | 0 (0.0%) | 0 (0.0%) |
| 20 to 34 years | 40 (100.0%) | 0 (0.0%) |
| 35 to 50 years | 0 (0.0%) | 0 (0.0%) |
| Total | 40 (100.0%) | 0 (0.0%) |
Fertility by Education in Roebuck
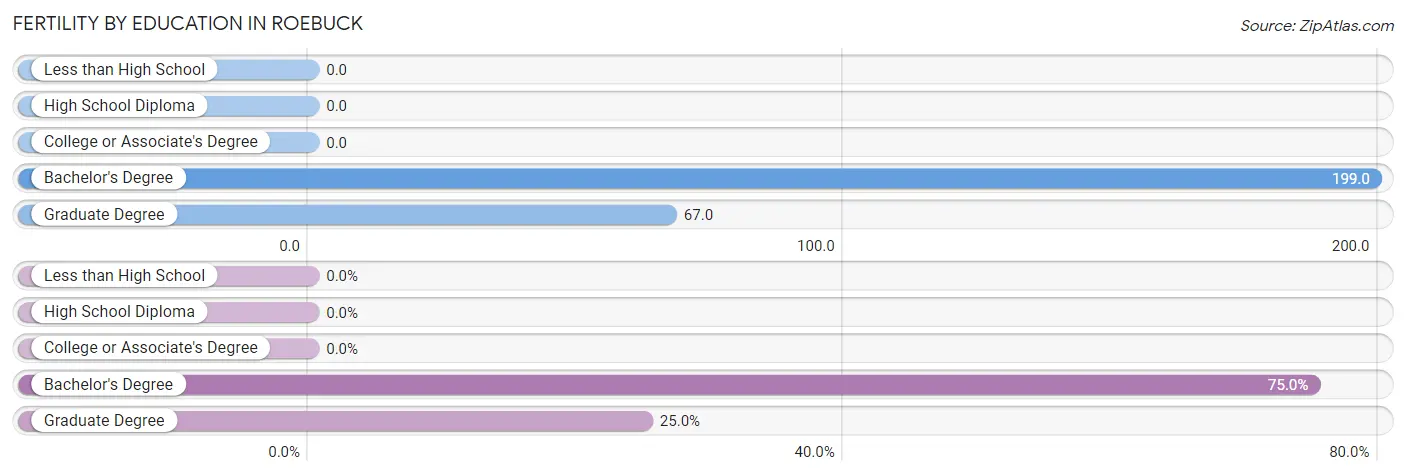
| Educational Attainment | Women with Births | Births / 1,000 Women |
| Less than High School | 0 (0.0%) | 0.0 |
| High School Diploma | 0 (0.0%) | 0.0 |
| College or Associate's Degree | 0 (0.0%) | 0.0 |
| Bachelor's Degree | 30 (75.0%) | 199.0 |
| Graduate Degree | 10 (25.0%) | 67.0 |
| Total | 40 (100.0%) | 37.0 |
Fertility by Education by Marriage Status in Roebuck
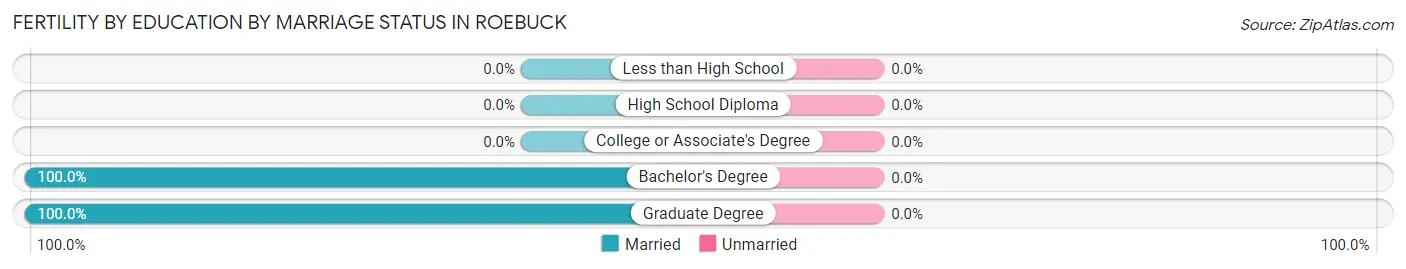
| Educational Attainment | Married | Unmarried |
| Less than High School | 0 (0.0%) | 0 (0.0%) |
| High School Diploma | 0 (0.0%) | 0 (0.0%) |
| College or Associate's Degree | 0 (0.0%) | 0 (0.0%) |
| Bachelor's Degree | 30 (100.0%) | 0 (0.0%) |
| Graduate Degree | 10 (100.0%) | 0 (0.0%) |
| Total | 40 (100.0%) | 0 (0.0%) |
Employment Characteristics in Roebuck
Employment by Class of Employer in Roebuck
Among the 2,222 employed individuals in Roebuck, private company employees (1,266 | 57.0%), state government employees (257 | 11.6%), and self-employed (not incorporated) (246 | 11.1%) make up the most common classes of employment.
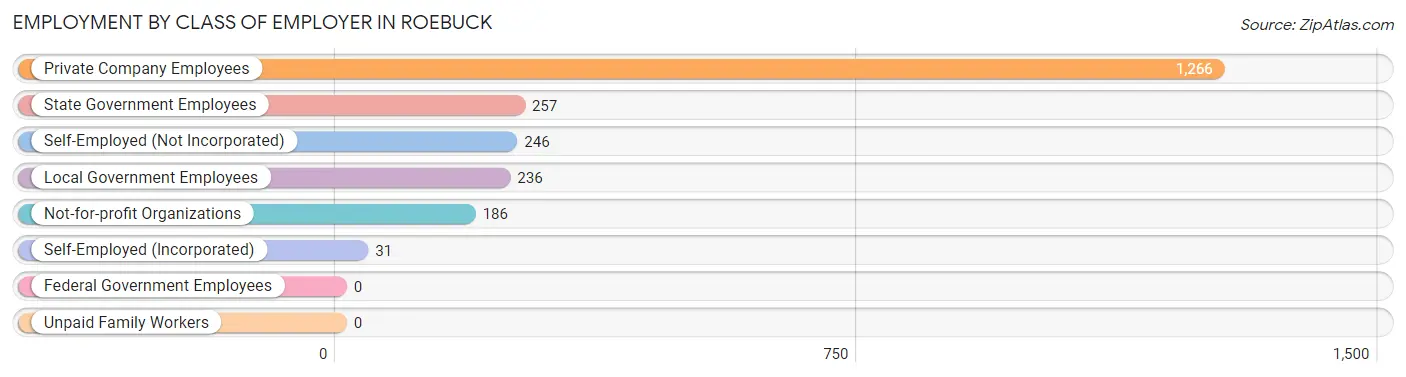
| Employer Class | # Employees | % Employees |
| Private Company Employees | 1,266 | 57.0% |
| Self-Employed (Incorporated) | 31 | 1.4% |
| Self-Employed (Not Incorporated) | 246 | 11.1% |
| Not-for-profit Organizations | 186 | 8.4% |
| Local Government Employees | 236 | 10.6% |
| State Government Employees | 257 | 11.6% |
| Federal Government Employees | 0 | 0.0% |
| Unpaid Family Workers | 0 | 0.0% |
| Total | 2,222 | 100.0% |
Employment Status by Age in Roebuck
According to the labor force statistics for Roebuck, out of the total population over 16 years of age (3,181), 72.2% or 2,297 individuals are in the labor force, with 1.9% or 44 of them unemployed. The age group with the highest labor force participation rate is 20 to 24 years, with 100.0% or 108 individuals in the labor force. Within the labor force, the 65 to 74 years age range has the highest percentage of unemployed individuals, with 31.4% or 11 of them being unemployed.
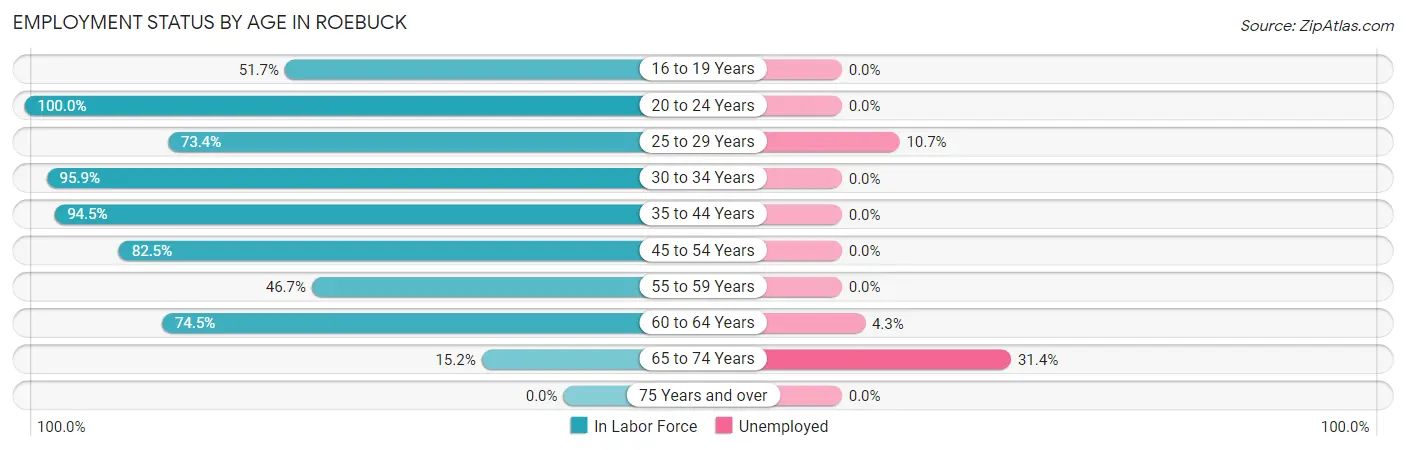
| Age Bracket | In Labor Force | Unemployed |
| 16 to 19 Years | 122 (51.7%) | 0 (0.0%) |
| 20 to 24 Years | 108 (100.0%) | 0 (0.0%) |
| 25 to 29 Years | 234 (73.4%) | 25 (10.7%) |
| 30 to 34 Years | 543 (95.9%) | 0 (0.0%) |
| 35 to 44 Years | 426 (94.5%) | 0 (0.0%) |
| 45 to 54 Years | 610 (82.5%) | 0 (0.0%) |
| 55 to 59 Years | 56 (46.7%) | 0 (0.0%) |
| 60 to 64 Years | 164 (74.5%) | 7 (4.3%) |
| 65 to 74 Years | 35 (15.2%) | 11 (31.4%) |
| 75 Years and over | 0 (0.0%) | 0 (0.0%) |
| Total | 2,297 (72.2%) | 44 (1.9%) |
Employment Status by Educational Attainment in Roebuck
According to labor force statistics for Roebuck, 84.2% of individuals (2,033) out of the total population between 25 and 64 years of age (2,415) are in the labor force, with 1.6% or 33 of them being unemployed. The group with the highest labor force participation rate are those with the educational attainment of bachelor's degree or higher, with 99.1% or 576 individuals in the labor force. Within the labor force, individuals with high school diploma education have the highest percentage of unemployment, with 4.7% or 25 of them being unemployed.
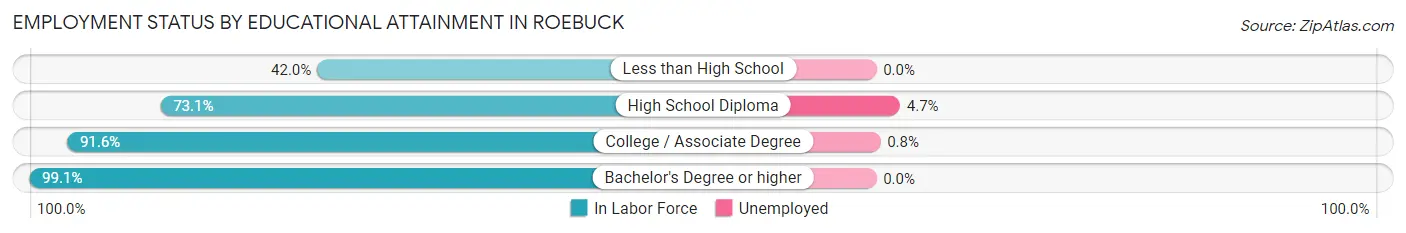
| Educational Attainment | In Labor Force | Unemployed |
| Less than High School | 74 (42.0%) | 0 (0.0%) |
| High School Diploma | 534 (73.1%) | 34 (4.7%) |
| College / Associate Degree | 849 (91.6%) | 7 (0.8%) |
| Bachelor's Degree or higher | 576 (99.1%) | 0 (0.0%) |
| Total | 2,033 (84.2%) | 39 (1.6%) |
Employment Occupations by Sex in Roebuck
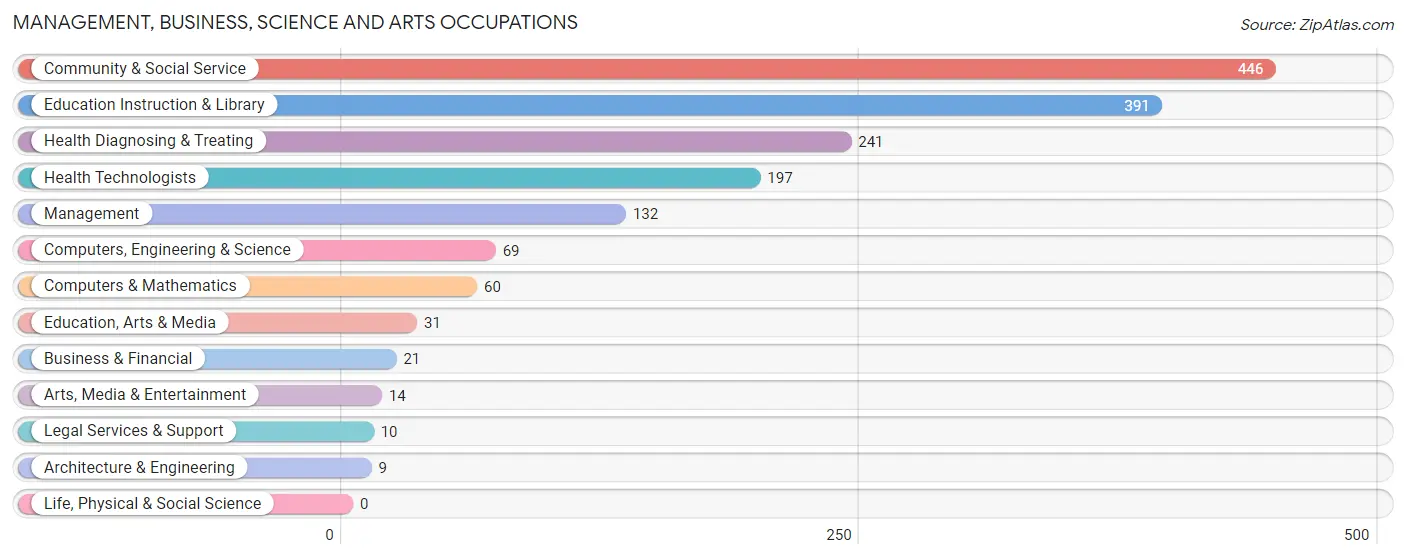
Management, Business, Science and Arts Occupations
The most common Management, Business, Science and Arts occupations in Roebuck are Community & Social Service (446 | 19.8%), Education Instruction & Library (391 | 17.3%), Health Diagnosing & Treating (241 | 10.7%), Health Technologists (197 | 8.7%), and Management (132 | 5.9%).
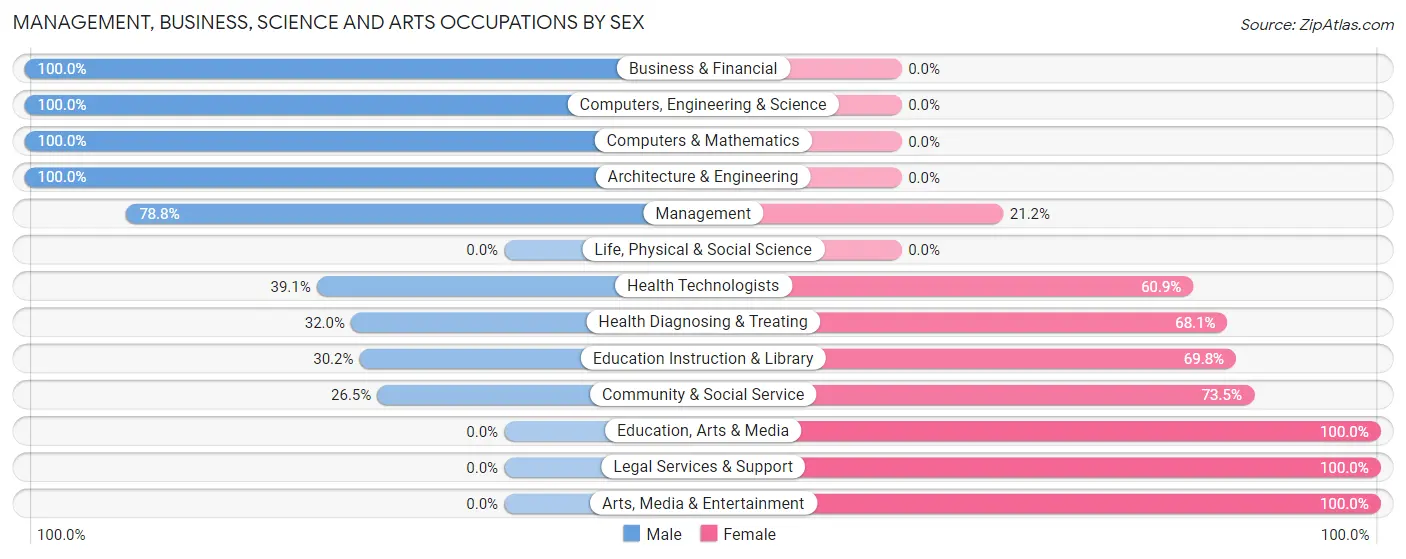
Management, Business, Science and Arts Occupations by Sex
Within the Management, Business, Science and Arts occupations in Roebuck, the most male-oriented occupations are Business & Financial (100.0%), Computers, Engineering & Science (100.0%), and Computers & Mathematics (100.0%), while the most female-oriented occupations are Education, Arts & Media (100.0%), Legal Services & Support (100.0%), and Arts, Media & Entertainment (100.0%).
| Occupation | Male | Female |
| Management | 104 (78.8%) | 28 (21.2%) |
| Business & Financial | 21 (100.0%) | 0 (0.0%) |
| Computers, Engineering & Science | 69 (100.0%) | 0 (0.0%) |
| Computers & Mathematics | 60 (100.0%) | 0 (0.0%) |
| Architecture & Engineering | 9 (100.0%) | 0 (0.0%) |
| Life, Physical & Social Science | 0 (0.0%) | 0 (0.0%) |
| Community & Social Service | 118 (26.5%) | 328 (73.5%) |
| Education, Arts & Media | 0 (0.0%) | 31 (100.0%) |
| Legal Services & Support | 0 (0.0%) | 10 (100.0%) |
| Education Instruction & Library | 118 (30.2%) | 273 (69.8%) |
| Arts, Media & Entertainment | 0 (0.0%) | 14 (100.0%) |
| Health Diagnosing & Treating | 77 (32.0%) | 164 (68.0%) |
| Health Technologists | 77 (39.1%) | 120 (60.9%) |
| Total (Category) | 389 (42.8%) | 520 (57.2%) |
| Total (Overall) | 1,175 (52.1%) | 1,080 (47.9%) |
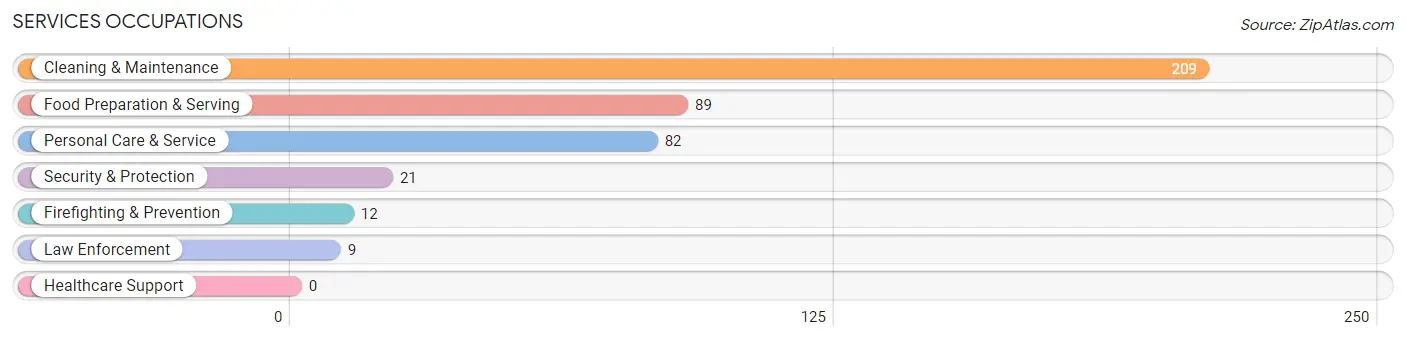
Services Occupations
The most common Services occupations in Roebuck are Cleaning & Maintenance (209 | 9.3%), Food Preparation & Serving (89 | 4.0%), Personal Care & Service (82 | 3.6%), Security & Protection (21 | 0.9%), and Firefighting & Prevention (12 | 0.5%).
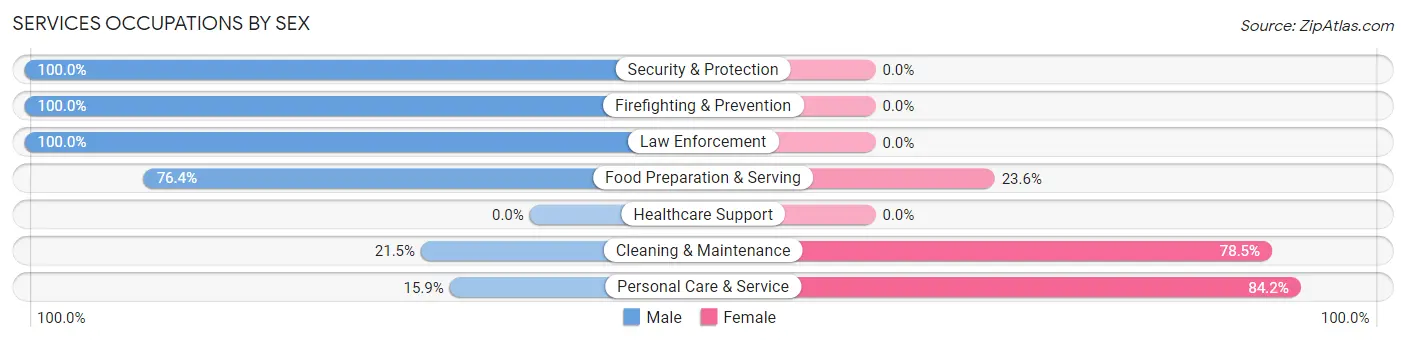
Services Occupations by Sex
Within the Services occupations in Roebuck, the most male-oriented occupations are Security & Protection (100.0%), Firefighting & Prevention (100.0%), and Law Enforcement (100.0%), while the most female-oriented occupations are Personal Care & Service (84.2%), Cleaning & Maintenance (78.5%), and Food Preparation & Serving (23.6%).
| Occupation | Male | Female |
| Healthcare Support | 0 (0.0%) | 0 (0.0%) |
| Security & Protection | 21 (100.0%) | 0 (0.0%) |
| Firefighting & Prevention | 12 (100.0%) | 0 (0.0%) |
| Law Enforcement | 9 (100.0%) | 0 (0.0%) |
| Food Preparation & Serving | 68 (76.4%) | 21 (23.6%) |
| Cleaning & Maintenance | 45 (21.5%) | 164 (78.5%) |
| Personal Care & Service | 13 (15.9%) | 69 (84.2%) |
| Total (Category) | 147 (36.7%) | 254 (63.3%) |
| Total (Overall) | 1,175 (52.1%) | 1,080 (47.9%) |
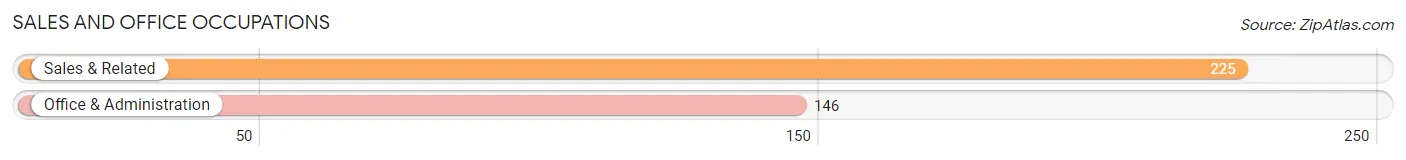
Sales and Office Occupations
The most common Sales and Office occupations in Roebuck are Sales & Related (225 | 10.0%), and Office & Administration (146 | 6.5%).
Sales and Office Occupations by Sex
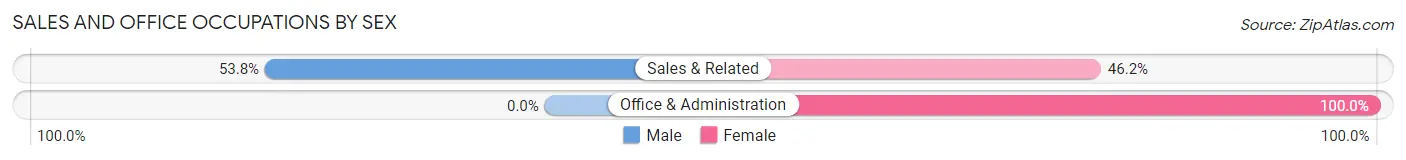
| Occupation | Male | Female |
| Sales & Related | 121 (53.8%) | 104 (46.2%) |
| Office & Administration | 0 (0.0%) | 146 (100.0%) |
| Total (Category) | 121 (32.6%) | 250 (67.4%) |
| Total (Overall) | 1,175 (52.1%) | 1,080 (47.9%) |
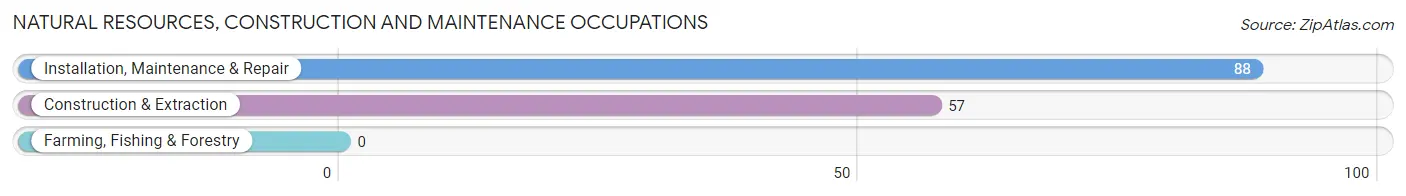
Natural Resources, Construction and Maintenance Occupations
The most common Natural Resources, Construction and Maintenance occupations in Roebuck are Installation, Maintenance & Repair (88 | 3.9%), and Construction & Extraction (57 | 2.5%).
Natural Resources, Construction and Maintenance Occupations by Sex
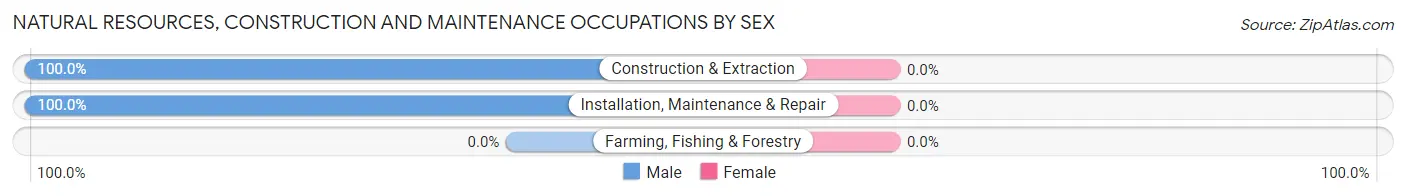
| Occupation | Male | Female |
| Farming, Fishing & Forestry | 0 (0.0%) | 0 (0.0%) |
| Construction & Extraction | 57 (100.0%) | 0 (0.0%) |
| Installation, Maintenance & Repair | 88 (100.0%) | 0 (0.0%) |
| Total (Category) | 145 (100.0%) | 0 (0.0%) |
| Total (Overall) | 1,175 (52.1%) | 1,080 (47.9%) |
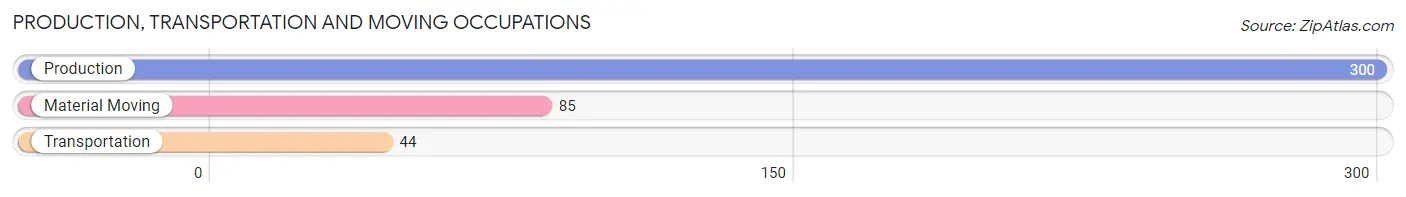
Production, Transportation and Moving Occupations
The most common Production, Transportation and Moving occupations in Roebuck are Production (300 | 13.3%), Material Moving (85 | 3.8%), and Transportation (44 | 1.9%).
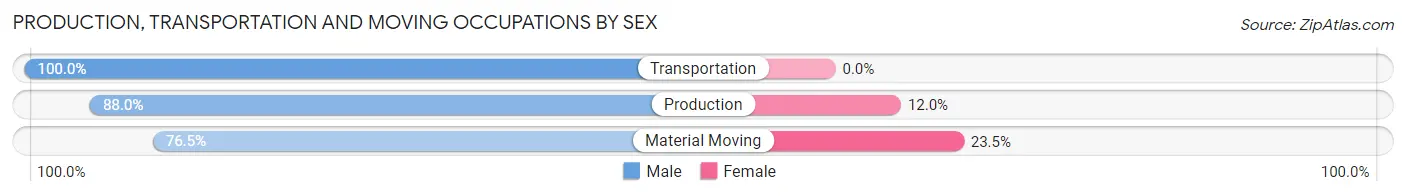
Production, Transportation and Moving Occupations by Sex
| Occupation | Male | Female |
| Production | 264 (88.0%) | 36 (12.0%) |
| Transportation | 44 (100.0%) | 0 (0.0%) |
| Material Moving | 65 (76.5%) | 20 (23.5%) |
| Total (Category) | 373 (87.0%) | 56 (13.1%) |
| Total (Overall) | 1,175 (52.1%) | 1,080 (47.9%) |
Employment Industries by Sex in Roebuck
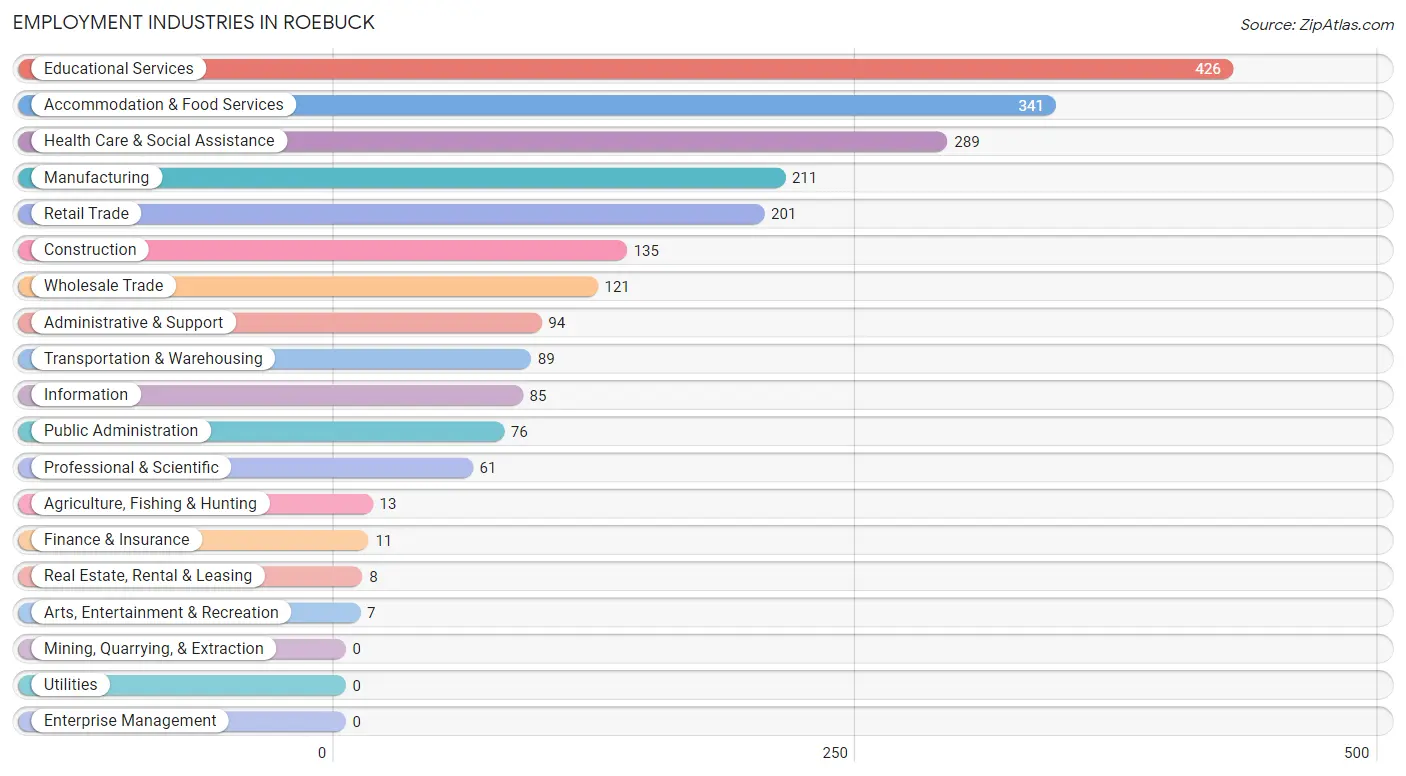
Employment Industries in Roebuck
The major employment industries in Roebuck include Educational Services (426 | 18.9%), Accommodation & Food Services (341 | 15.1%), Health Care & Social Assistance (289 | 12.8%), Manufacturing (211 | 9.4%), and Retail Trade (201 | 8.9%).
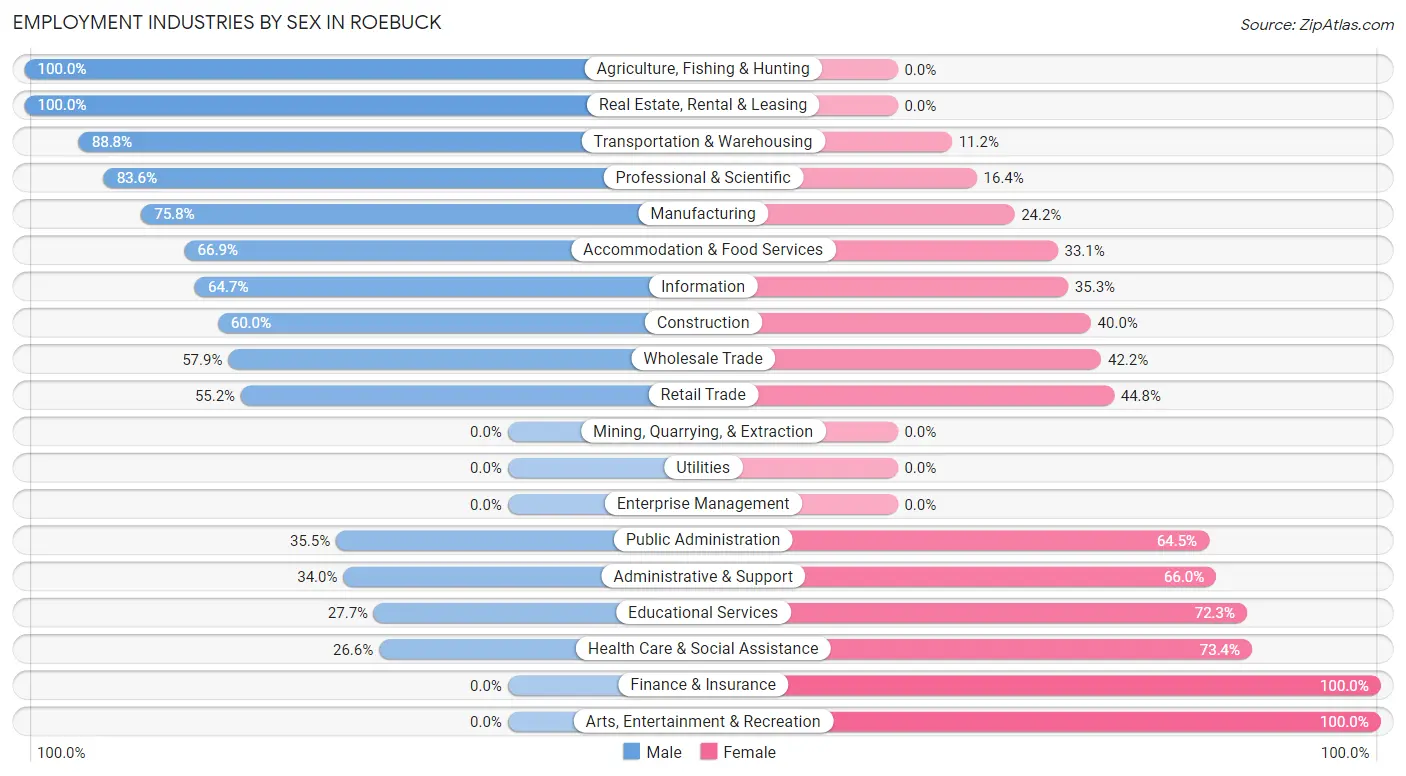
Employment Industries by Sex in Roebuck
The Roebuck industries that see more men than women are Agriculture, Fishing & Hunting (100.0%), Real Estate, Rental & Leasing (100.0%), and Transportation & Warehousing (88.8%), whereas the industries that tend to have a higher number of women are Finance & Insurance (100.0%), Arts, Entertainment & Recreation (100.0%), and Health Care & Social Assistance (73.4%).
| Industry | Male | Female |
| Agriculture, Fishing & Hunting | 13 (100.0%) | 0 (0.0%) |
| Mining, Quarrying, & Extraction | 0 (0.0%) | 0 (0.0%) |
| Construction | 81 (60.0%) | 54 (40.0%) |
| Manufacturing | 160 (75.8%) | 51 (24.2%) |
| Wholesale Trade | 70 (57.9%) | 51 (42.1%) |
| Retail Trade | 111 (55.2%) | 90 (44.8%) |
| Transportation & Warehousing | 79 (88.8%) | 10 (11.2%) |
| Utilities | 0 (0.0%) | 0 (0.0%) |
| Information | 55 (64.7%) | 30 (35.3%) |
| Finance & Insurance | 0 (0.0%) | 11 (100.0%) |
| Real Estate, Rental & Leasing | 8 (100.0%) | 0 (0.0%) |
| Professional & Scientific | 51 (83.6%) | 10 (16.4%) |
| Enterprise Management | 0 (0.0%) | 0 (0.0%) |
| Administrative & Support | 32 (34.0%) | 62 (66.0%) |
| Educational Services | 118 (27.7%) | 308 (72.3%) |
| Health Care & Social Assistance | 77 (26.6%) | 212 (73.4%) |
| Arts, Entertainment & Recreation | 0 (0.0%) | 7 (100.0%) |
| Accommodation & Food Services | 228 (66.9%) | 113 (33.1%) |
| Public Administration | 27 (35.5%) | 49 (64.5%) |
| Total | 1,175 (52.1%) | 1,080 (47.9%) |
Education in Roebuck
School Enrollment in Roebuck
The most common levels of schooling among the 783 students in Roebuck are high school (346 | 44.2%), elementary school (160 | 20.4%), and middle school (130 | 16.6%).
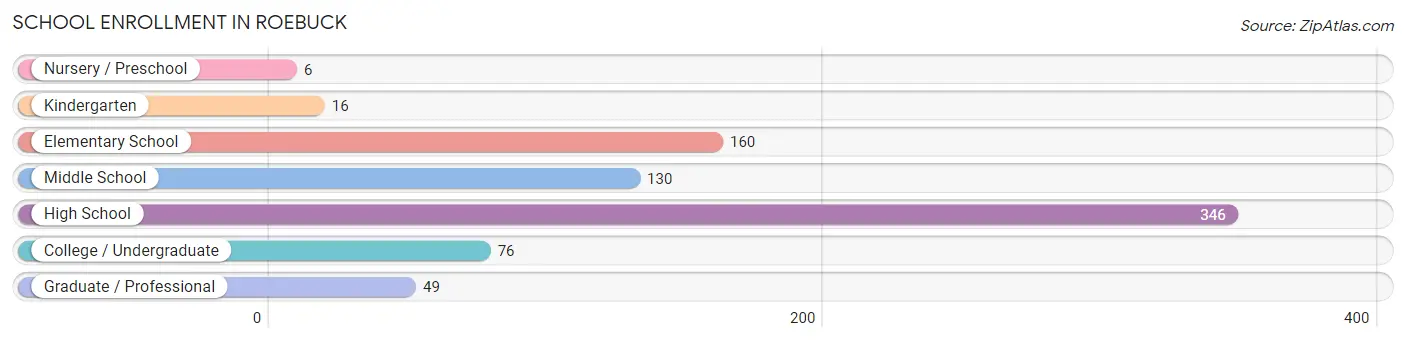
| School Level | # Students | % Students |
| Nursery / Preschool | 6 | 0.8% |
| Kindergarten | 16 | 2.0% |
| Elementary School | 160 | 20.4% |
| Middle School | 130 | 16.6% |
| High School | 346 | 44.2% |
| College / Undergraduate | 76 | 9.7% |
| Graduate / Professional | 49 | 6.3% |
| Total | 783 | 100.0% |
School Enrollment by Age by Funding Source in Roebuck
Out of a total of 783 students who are enrolled in schools in Roebuck, 25 (3.2%) attend a private institution, while the remaining 758 (96.8%) are enrolled in public schools. The age group of 25 to 34 year olds has the highest likelihood of being enrolled in private schools, with 25 (52.1% in the age bracket) enrolled. Conversely, the age group of 3 to 4 year olds has the lowest likelihood of being enrolled in a private school, with 14 (100.0% in the age bracket) attending a public institution.
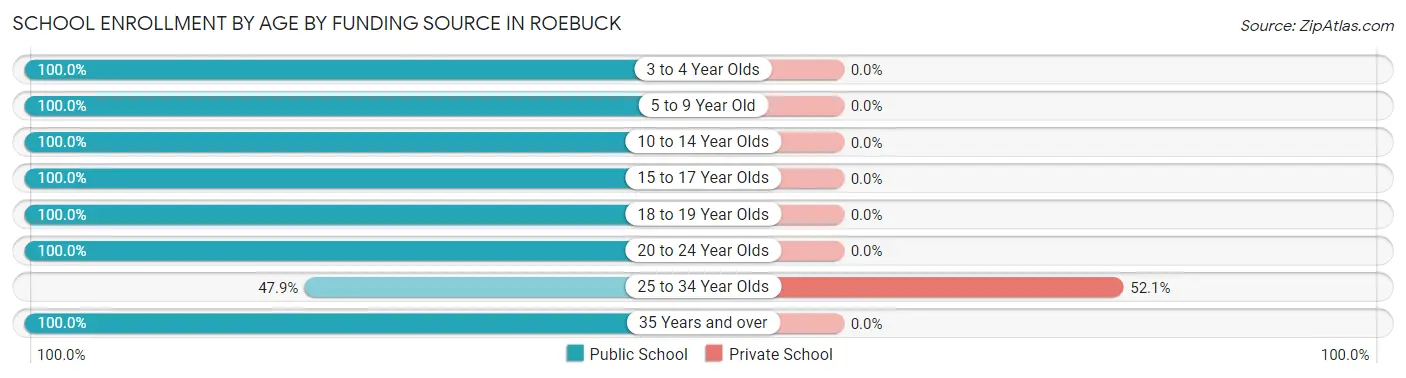
| Age Bracket | Public School | Private School |
| 3 to 4 Year Olds | 14 (100.0%) | 0 (0.0%) |
| 5 to 9 Year Old | 143 (100.0%) | 0 (0.0%) |
| 10 to 14 Year Olds | 214 (100.0%) | 0 (0.0%) |
| 15 to 17 Year Olds | 233 (100.0%) | 0 (0.0%) |
| 18 to 19 Year Olds | 76 (100.0%) | 0 (0.0%) |
| 20 to 24 Year Olds | 29 (100.0%) | 0 (0.0%) |
| 25 to 34 Year Olds | 23 (47.9%) | 25 (52.1%) |
| 35 Years and over | 26 (100.0%) | 0 (0.0%) |
| Total | 758 (96.8%) | 25 (3.2%) |
Educational Attainment by Field of Study in Roebuck
Science & technology (190 | 30.8%), engineering (79 | 12.8%), liberal arts & history (70 | 11.4%), business (60 | 9.7%), and psychology (42 | 6.8%) are the most common fields of study among 616 individuals in Roebuck who have obtained a bachelor's degree or higher.
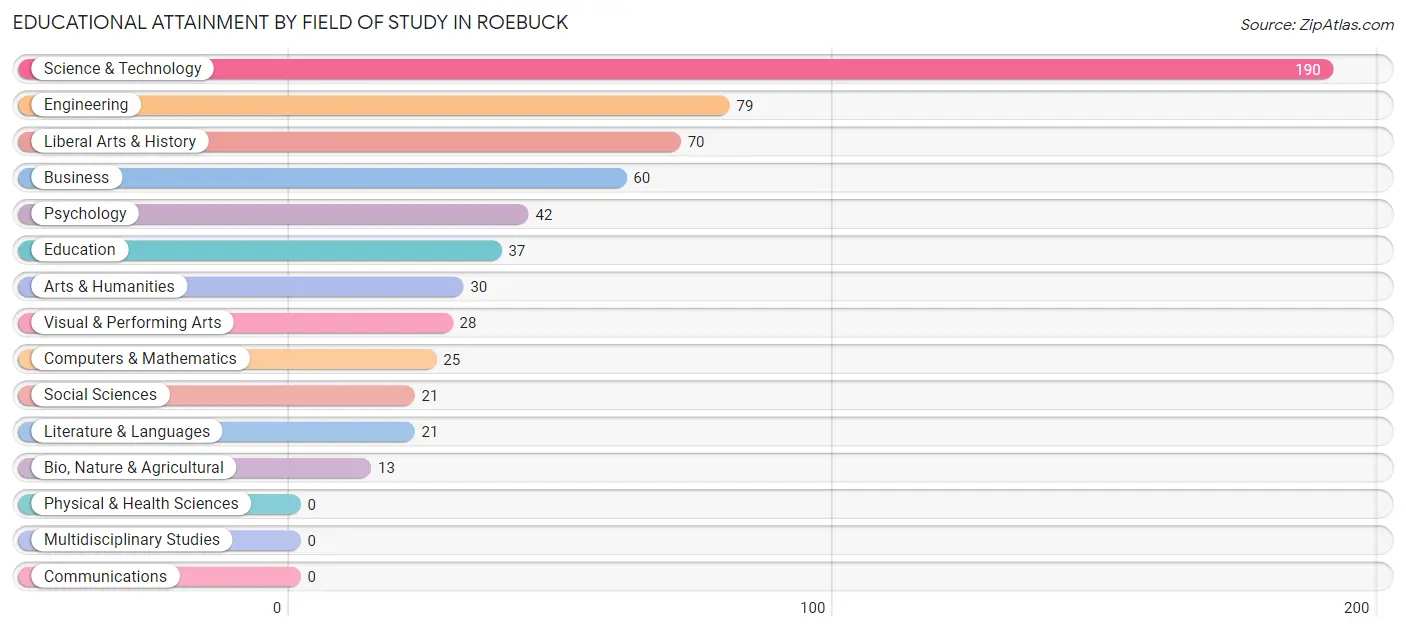
| Field of Study | # Graduates | % Graduates |
| Computers & Mathematics | 25 | 4.1% |
| Bio, Nature & Agricultural | 13 | 2.1% |
| Physical & Health Sciences | 0 | 0.0% |
| Psychology | 42 | 6.8% |
| Social Sciences | 21 | 3.4% |
| Engineering | 79 | 12.8% |
| Multidisciplinary Studies | 0 | 0.0% |
| Science & Technology | 190 | 30.8% |
| Business | 60 | 9.7% |
| Education | 37 | 6.0% |
| Literature & Languages | 21 | 3.4% |
| Liberal Arts & History | 70 | 11.4% |
| Visual & Performing Arts | 28 | 4.5% |
| Communications | 0 | 0.0% |
| Arts & Humanities | 30 | 4.9% |
| Total | 616 | 100.0% |
Transportation & Commute in Roebuck
Vehicle Availability by Sex in Roebuck
The most prevalent vehicle ownership categories in Roebuck are males with 3 vehicles (453, accounting for 38.9%) and females with 3 vehicles (377, making up 42.9%).
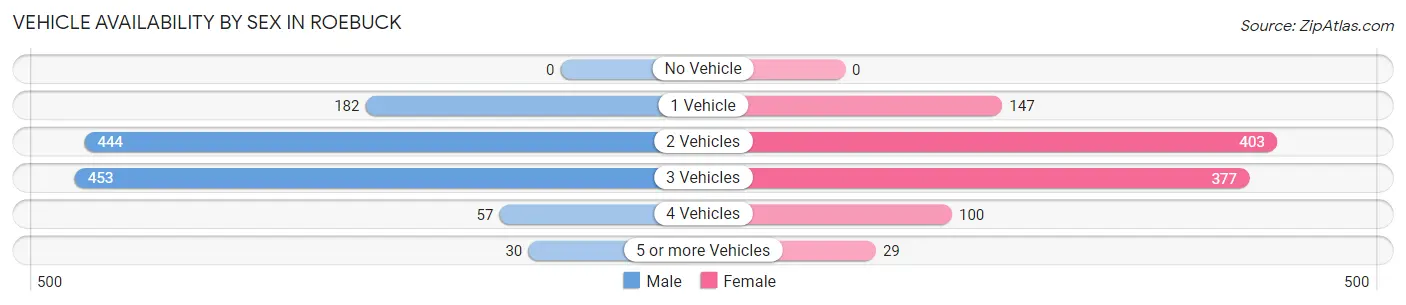
| Vehicles Available | Male | Female |
| No Vehicle | 0 (0.0%) | 0 (0.0%) |
| 1 Vehicle | 182 (15.6%) | 147 (13.9%) |
| 2 Vehicles | 444 (38.1%) | 403 (38.2%) |
| 3 Vehicles | 453 (38.9%) | 377 (35.7%) |
| 4 Vehicles | 57 (4.9%) | 100 (9.5%) |
| 5 or more Vehicles | 30 (2.6%) | 29 (2.8%) |
| Total | 1,166 (100.0%) | 1,056 (100.0%) |
Commute Time in Roebuck
The most frequently occuring commute durations in Roebuck are 15 to 19 minutes (496 commuters, 24.9%), 20 to 24 minutes (360 commuters, 18.1%), and 10 to 14 minutes (314 commuters, 15.8%).
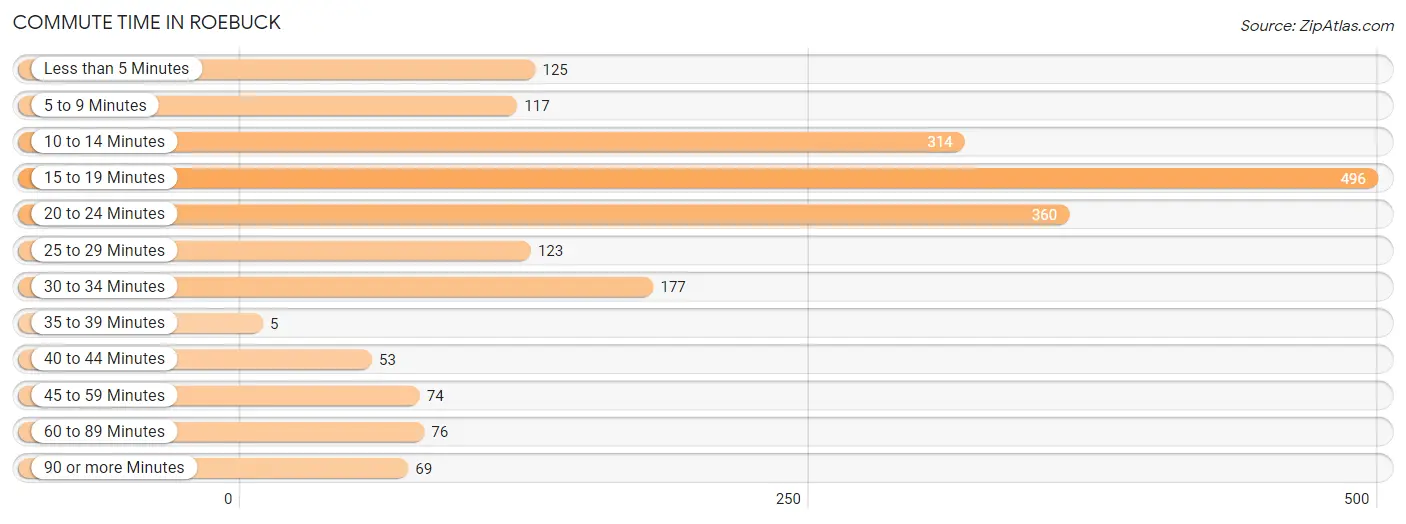
| Commute Time | # Commuters | % Commuters |
| Less than 5 Minutes | 125 | 6.3% |
| 5 to 9 Minutes | 117 | 5.9% |
| 10 to 14 Minutes | 314 | 15.8% |
| 15 to 19 Minutes | 496 | 24.9% |
| 20 to 24 Minutes | 360 | 18.1% |
| 25 to 29 Minutes | 123 | 6.2% |
| 30 to 34 Minutes | 177 | 8.9% |
| 35 to 39 Minutes | 5 | 0.3% |
| 40 to 44 Minutes | 53 | 2.7% |
| 45 to 59 Minutes | 74 | 3.7% |
| 60 to 89 Minutes | 76 | 3.8% |
| 90 or more Minutes | 69 | 3.5% |
Commute Time by Sex in Roebuck
The most common commute times in Roebuck are 15 to 19 minutes (263 commuters, 27.8%) for males and 10 to 14 minutes (242 commuters, 23.2%) for females.
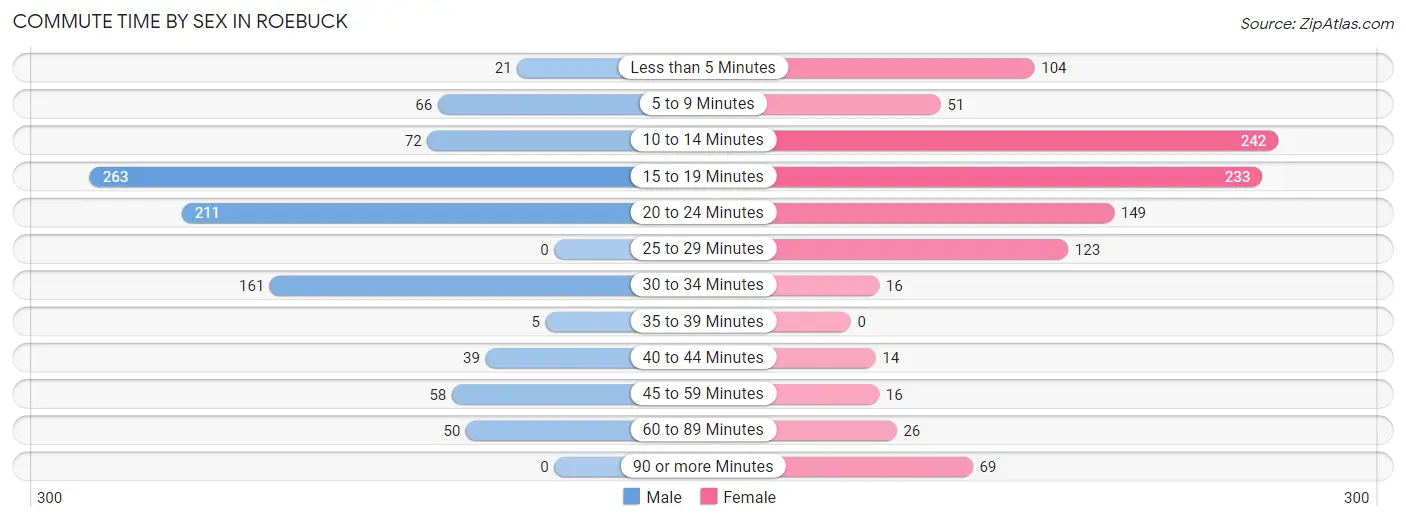
| Commute Time | Male | Female |
| Less than 5 Minutes | 21 (2.2%) | 104 (10.0%) |
| 5 to 9 Minutes | 66 (7.0%) | 51 (4.9%) |
| 10 to 14 Minutes | 72 (7.6%) | 242 (23.2%) |
| 15 to 19 Minutes | 263 (27.8%) | 233 (22.3%) |
| 20 to 24 Minutes | 211 (22.3%) | 149 (14.3%) |
| 25 to 29 Minutes | 0 (0.0%) | 123 (11.8%) |
| 30 to 34 Minutes | 161 (17.0%) | 16 (1.5%) |
| 35 to 39 Minutes | 5 (0.5%) | 0 (0.0%) |
| 40 to 44 Minutes | 39 (4.1%) | 14 (1.3%) |
| 45 to 59 Minutes | 58 (6.1%) | 16 (1.5%) |
| 60 to 89 Minutes | 50 (5.3%) | 26 (2.5%) |
| 90 or more Minutes | 0 (0.0%) | 69 (6.6%) |
Time of Departure to Work by Sex in Roebuck
The most frequent times of departure to work in Roebuck are 4:00 PM to 11:59 PM (300, 31.7%) for males and 7:00 AM to 7:29 AM (301, 28.9%) for females.
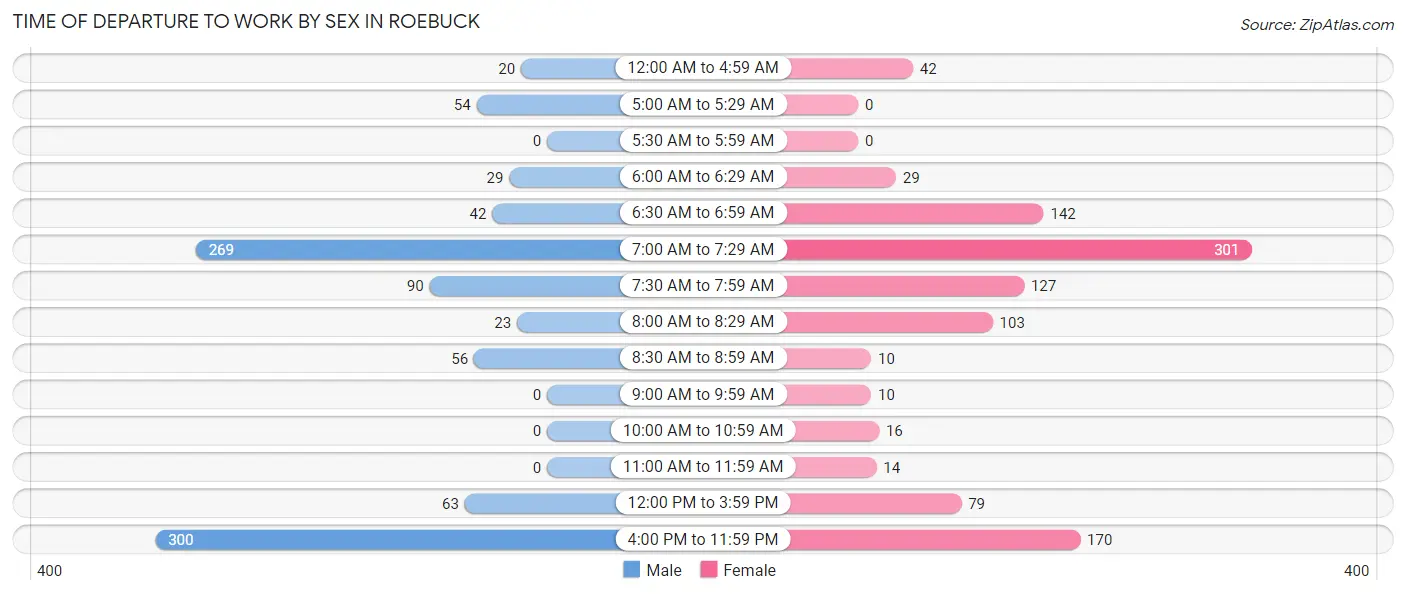
| Time of Departure | Male | Female |
| 12:00 AM to 4:59 AM | 20 (2.1%) | 42 (4.0%) |
| 5:00 AM to 5:29 AM | 54 (5.7%) | 0 (0.0%) |
| 5:30 AM to 5:59 AM | 0 (0.0%) | 0 (0.0%) |
| 6:00 AM to 6:29 AM | 29 (3.1%) | 29 (2.8%) |
| 6:30 AM to 6:59 AM | 42 (4.4%) | 142 (13.6%) |
| 7:00 AM to 7:29 AM | 269 (28.4%) | 301 (28.9%) |
| 7:30 AM to 7:59 AM | 90 (9.5%) | 127 (12.2%) |
| 8:00 AM to 8:29 AM | 23 (2.4%) | 103 (9.9%) |
| 8:30 AM to 8:59 AM | 56 (5.9%) | 10 (1.0%) |
| 9:00 AM to 9:59 AM | 0 (0.0%) | 10 (1.0%) |
| 10:00 AM to 10:59 AM | 0 (0.0%) | 16 (1.5%) |
| 11:00 AM to 11:59 AM | 0 (0.0%) | 14 (1.3%) |
| 12:00 PM to 3:59 PM | 63 (6.7%) | 79 (7.6%) |
| 4:00 PM to 11:59 PM | 300 (31.7%) | 170 (16.3%) |
| Total | 946 (100.0%) | 1,043 (100.0%) |
Housing Occupancy in Roebuck
Occupancy by Ownership in Roebuck
Of the total 1,413 dwellings in Roebuck, owner-occupied units account for 1,128 (79.8%), while renter-occupied units make up 285 (20.2%).
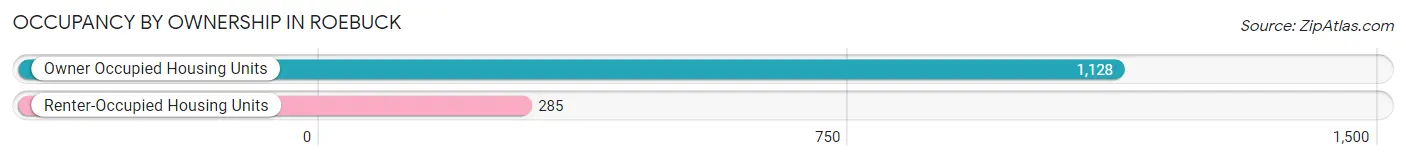
| Occupancy | # Housing Units | % Housing Units |
| Owner Occupied Housing Units | 1,128 | 79.8% |
| Renter-Occupied Housing Units | 285 | 20.2% |
| Total Occupied Housing Units | 1,413 | 100.0% |
Occupancy by Household Size in Roebuck
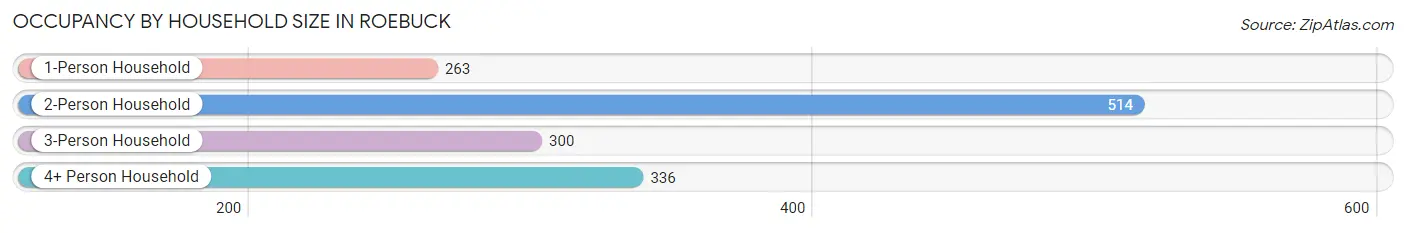
| Household Size | # Housing Units | % Housing Units |
| 1-Person Household | 263 | 18.6% |
| 2-Person Household | 514 | 36.4% |
| 3-Person Household | 300 | 21.2% |
| 4+ Person Household | 336 | 23.8% |
| Total Housing Units | 1,413 | 100.0% |
Occupancy by Ownership by Household Size in Roebuck
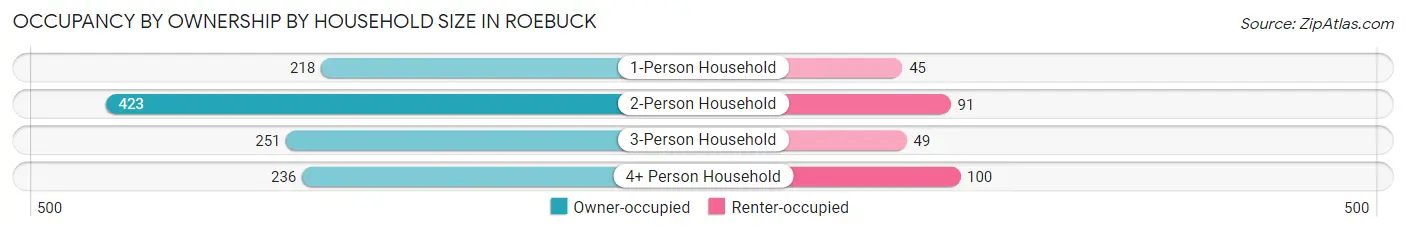
| Household Size | Owner-occupied | Renter-occupied |
| 1-Person Household | 218 (82.9%) | 45 (17.1%) |
| 2-Person Household | 423 (82.3%) | 91 (17.7%) |
| 3-Person Household | 251 (83.7%) | 49 (16.3%) |
| 4+ Person Household | 236 (70.2%) | 100 (29.8%) |
| Total Housing Units | 1,128 (79.8%) | 285 (20.2%) |
Occupancy by Educational Attainment in Roebuck
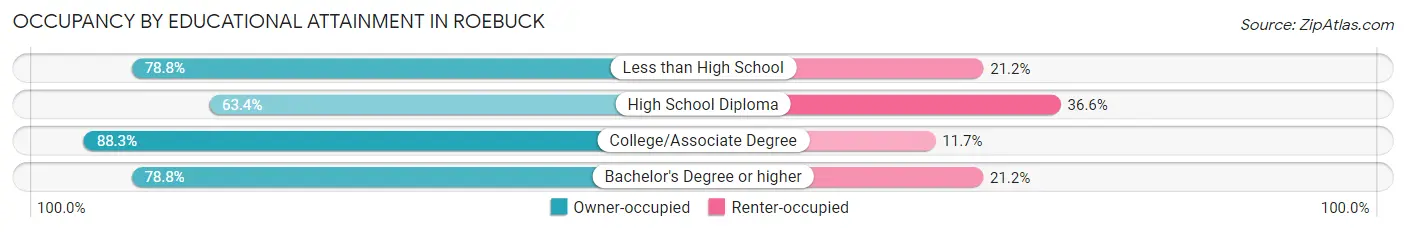
| Household Size | Owner-occupied | Renter-occupied |
| Less than High School | 89 (78.8%) | 24 (21.2%) |
| High School Diploma | 196 (63.4%) | 113 (36.6%) |
| College/Associate Degree | 579 (88.3%) | 77 (11.7%) |
| Bachelor's Degree or higher | 264 (78.8%) | 71 (21.2%) |
Occupancy by Age of Householder in Roebuck
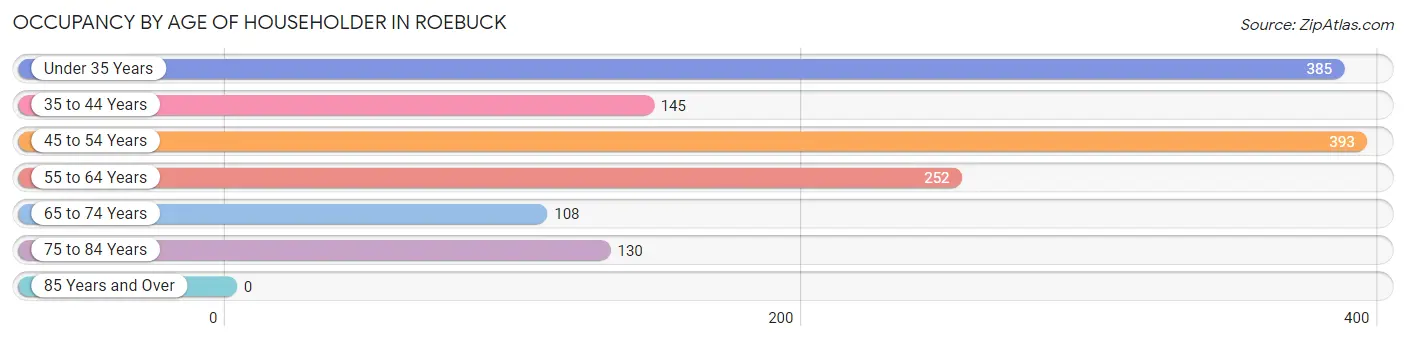
| Age Bracket | # Households | % Households |
| Under 35 Years | 385 | 27.3% |
| 35 to 44 Years | 145 | 10.3% |
| 45 to 54 Years | 393 | 27.8% |
| 55 to 64 Years | 252 | 17.8% |
| 65 to 74 Years | 108 | 7.6% |
| 75 to 84 Years | 130 | 9.2% |
| 85 Years and Over | 0 | 0.0% |
| Total | 1,413 | 100.0% |
Housing Finances in Roebuck
Median Income by Occupancy in Roebuck
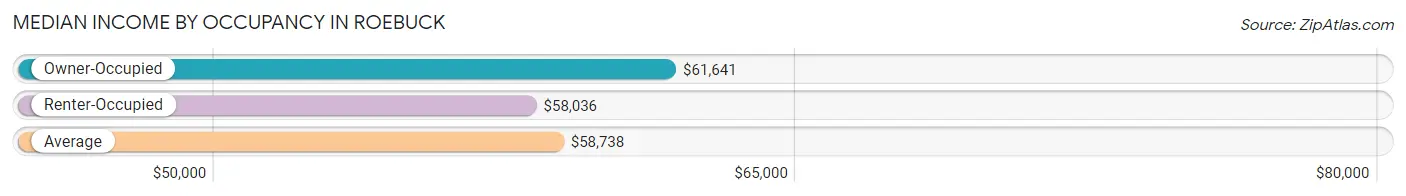
| Occupancy Type | # Households | Median Income |
| Owner-Occupied | 1,128 (79.8%) | $61,641 |
| Renter-Occupied | 285 (20.2%) | $58,036 |
| Average | 1,413 (100.0%) | $58,738 |
Occupancy by Householder Income Bracket in Roebuck
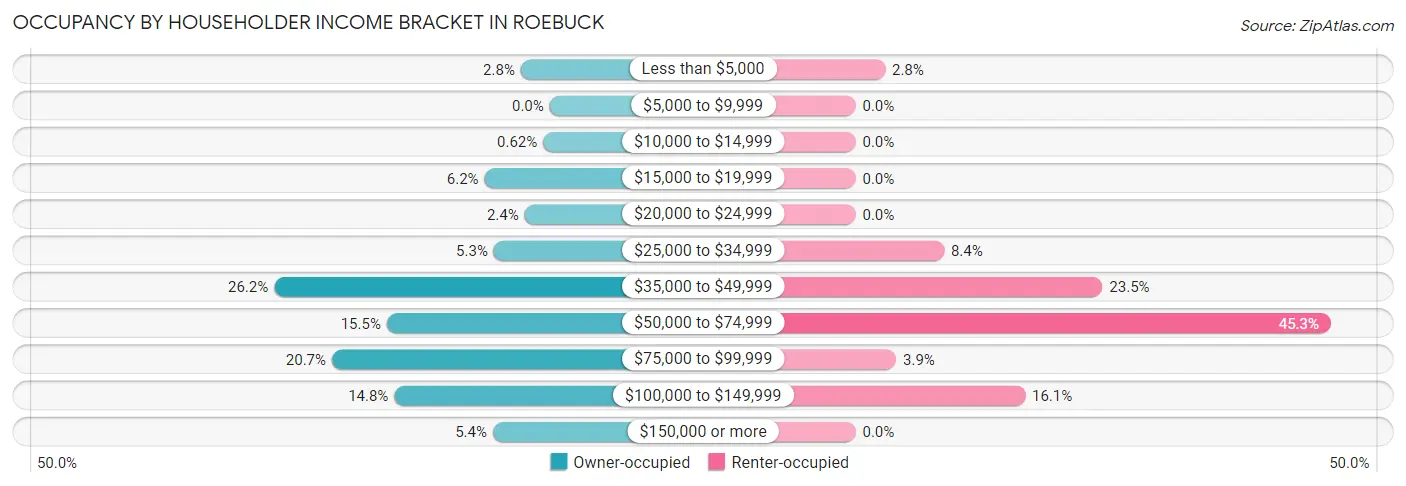
| Income Bracket | Owner-occupied | Renter-occupied |
| Less than $5,000 | 31 (2.8%) | 8 (2.8%) |
| $5,000 to $9,999 | 0 (0.0%) | 0 (0.0%) |
| $10,000 to $14,999 | 7 (0.6%) | 0 (0.0%) |
| $15,000 to $19,999 | 70 (6.2%) | 0 (0.0%) |
| $20,000 to $24,999 | 27 (2.4%) | 0 (0.0%) |
| $25,000 to $34,999 | 60 (5.3%) | 24 (8.4%) |
| $35,000 to $49,999 | 296 (26.2%) | 67 (23.5%) |
| $50,000 to $74,999 | 175 (15.5%) | 129 (45.3%) |
| $75,000 to $99,999 | 234 (20.7%) | 11 (3.9%) |
| $100,000 to $149,999 | 167 (14.8%) | 46 (16.1%) |
| $150,000 or more | 61 (5.4%) | 0 (0.0%) |
| Total | 1,128 (100.0%) | 285 (100.0%) |
Monthly Housing Cost Tiers in Roebuck
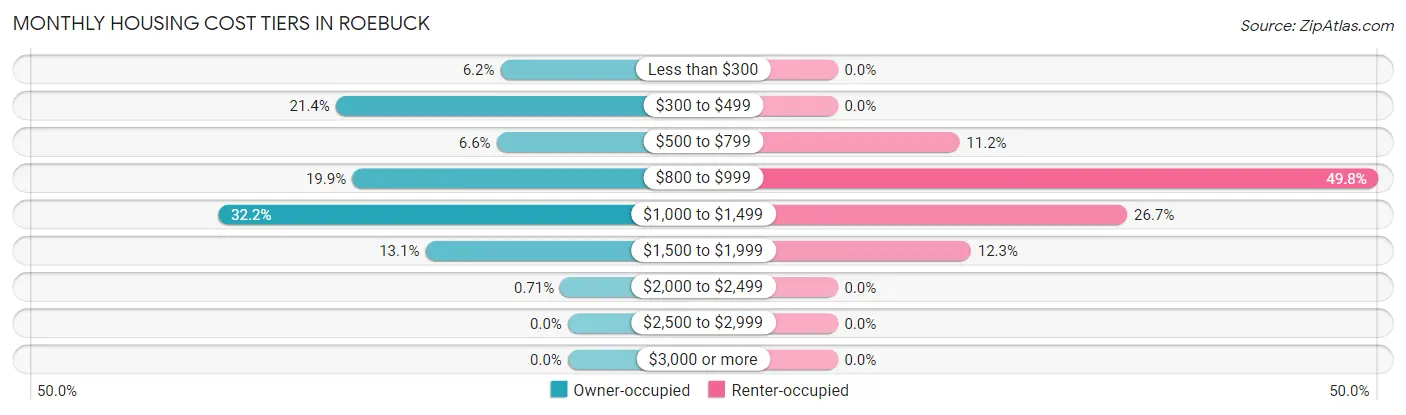
| Monthly Cost | Owner-occupied | Renter-occupied |
| Less than $300 | 70 (6.2%) | 0 (0.0%) |
| $300 to $499 | 241 (21.4%) | 0 (0.0%) |
| $500 to $799 | 74 (6.6%) | 32 (11.2%) |
| $800 to $999 | 224 (19.9%) | 142 (49.8%) |
| $1,000 to $1,499 | 363 (32.2%) | 76 (26.7%) |
| $1,500 to $1,999 | 148 (13.1%) | 35 (12.3%) |
| $2,000 to $2,499 | 8 (0.7%) | 0 (0.0%) |
| $2,500 to $2,999 | 0 (0.0%) | 0 (0.0%) |
| $3,000 or more | 0 (0.0%) | 0 (0.0%) |
| Total | 1,128 (100.0%) | 285 (100.0%) |
Physical Housing Characteristics in Roebuck
Housing Structures in Roebuck
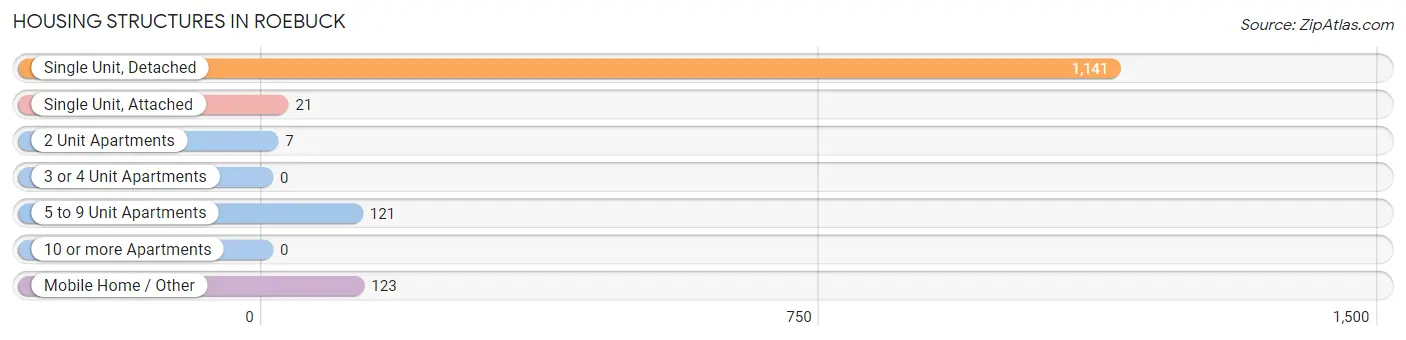
| Structure Type | # Housing Units | % Housing Units |
| Single Unit, Detached | 1,141 | 80.7% |
| Single Unit, Attached | 21 | 1.5% |
| 2 Unit Apartments | 7 | 0.5% |
| 3 or 4 Unit Apartments | 0 | 0.0% |
| 5 to 9 Unit Apartments | 121 | 8.6% |
| 10 or more Apartments | 0 | 0.0% |
| Mobile Home / Other | 123 | 8.7% |
| Total | 1,413 | 100.0% |
Housing Structures by Occupancy in Roebuck
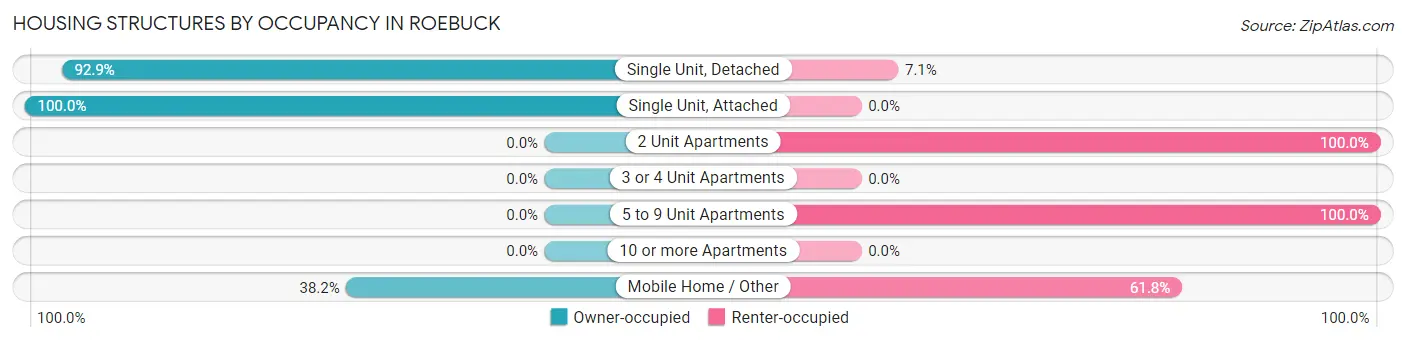
| Structure Type | Owner-occupied | Renter-occupied |
| Single Unit, Detached | 1,060 (92.9%) | 81 (7.1%) |
| Single Unit, Attached | 21 (100.0%) | 0 (0.0%) |
| 2 Unit Apartments | 0 (0.0%) | 7 (100.0%) |
| 3 or 4 Unit Apartments | 0 (0.0%) | 0 (0.0%) |
| 5 to 9 Unit Apartments | 0 (0.0%) | 121 (100.0%) |
| 10 or more Apartments | 0 (0.0%) | 0 (0.0%) |
| Mobile Home / Other | 47 (38.2%) | 76 (61.8%) |
| Total | 1,128 (79.8%) | 285 (20.2%) |
Housing Structures by Number of Rooms in Roebuck
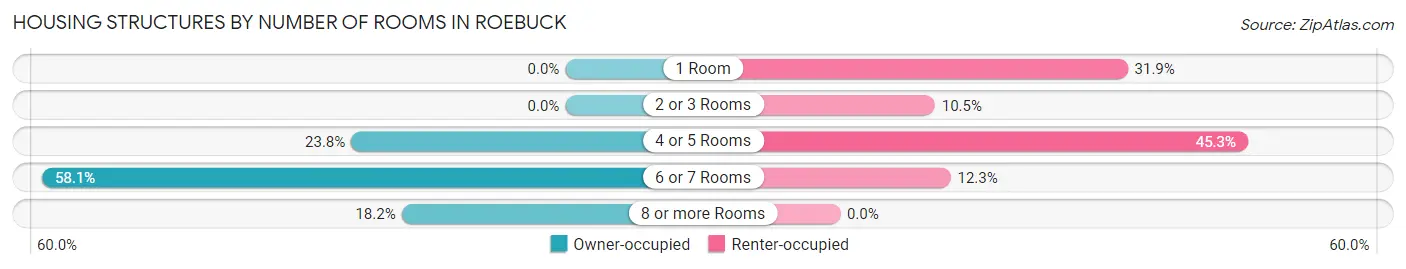
| Number of Rooms | Owner-occupied | Renter-occupied |
| 1 Room | 0 (0.0%) | 91 (31.9%) |
| 2 or 3 Rooms | 0 (0.0%) | 30 (10.5%) |
| 4 or 5 Rooms | 268 (23.8%) | 129 (45.3%) |
| 6 or 7 Rooms | 655 (58.1%) | 35 (12.3%) |
| 8 or more Rooms | 205 (18.2%) | 0 (0.0%) |
| Total | 1,128 (100.0%) | 285 (100.0%) |
Housing Structure by Heating Type in Roebuck
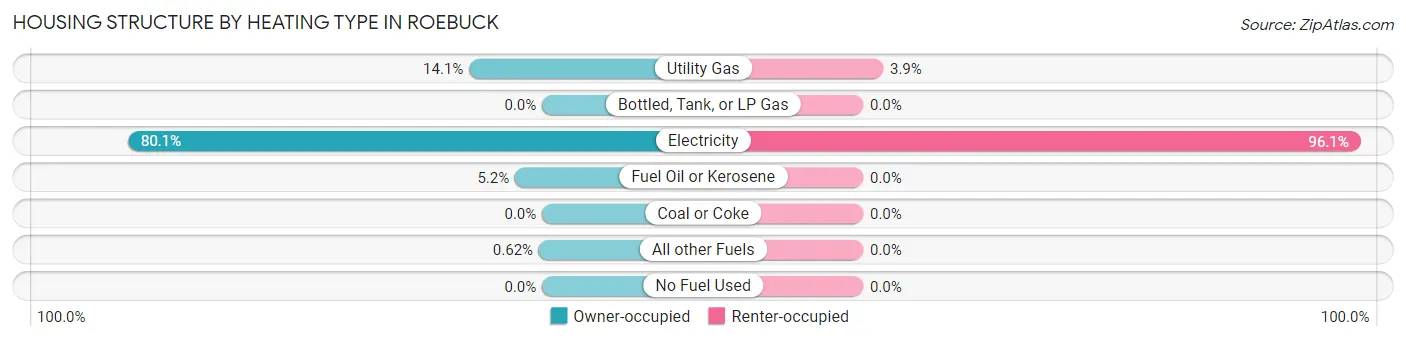
| Heating Type | Owner-occupied | Renter-occupied |
| Utility Gas | 159 (14.1%) | 11 (3.9%) |
| Bottled, Tank, or LP Gas | 0 (0.0%) | 0 (0.0%) |
| Electricity | 903 (80.0%) | 274 (96.1%) |
| Fuel Oil or Kerosene | 59 (5.2%) | 0 (0.0%) |
| Coal or Coke | 0 (0.0%) | 0 (0.0%) |
| All other Fuels | 7 (0.6%) | 0 (0.0%) |
| No Fuel Used | 0 (0.0%) | 0 (0.0%) |
| Total | 1,128 (100.0%) | 285 (100.0%) |
Household Vehicle Usage in Roebuck
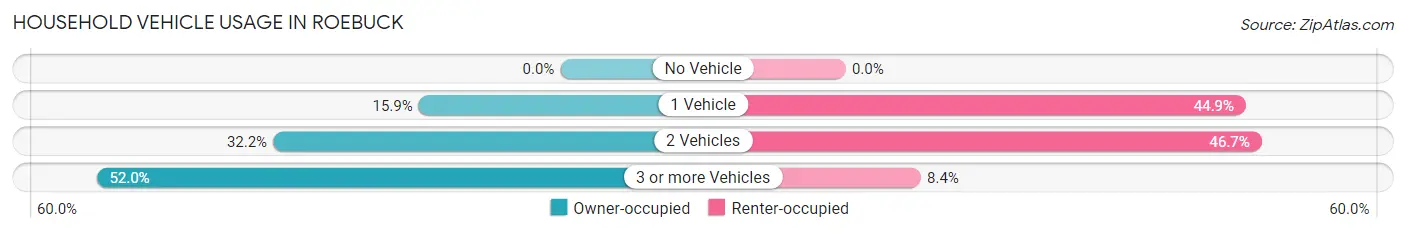
| Vehicles per Household | Owner-occupied | Renter-occupied |
| No Vehicle | 0 (0.0%) | 0 (0.0%) |
| 1 Vehicle | 179 (15.9%) | 128 (44.9%) |
| 2 Vehicles | 363 (32.2%) | 133 (46.7%) |
| 3 or more Vehicles | 586 (51.9%) | 24 (8.4%) |
| Total | 1,128 (100.0%) | 285 (100.0%) |
Real Estate & Mortgages in Roebuck
Real Estate and Mortgage Overview in Roebuck
| Characteristic | Without Mortgage | With Mortgage |
| Housing Units | 355 | 773 |
| Median Property Value | $192,100 | $183,400 |
| Median Household Income | $48,675 | $46 |
| Monthly Housing Costs | $378 | $0 |
| Real Estate Taxes | $638 | $0 |
Property Value by Mortgage Status in Roebuck
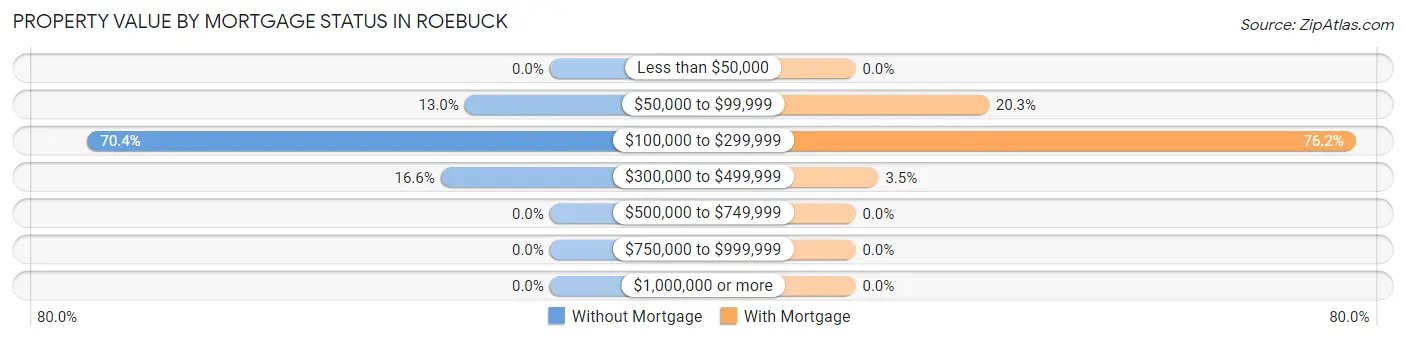
| Property Value | Without Mortgage | With Mortgage |
| Less than $50,000 | 0 (0.0%) | 0 (0.0%) |
| $50,000 to $99,999 | 46 (13.0%) | 157 (20.3%) |
| $100,000 to $299,999 | 250 (70.4%) | 589 (76.2%) |
| $300,000 to $499,999 | 59 (16.6%) | 27 (3.5%) |
| $500,000 to $749,999 | 0 (0.0%) | 0 (0.0%) |
| $750,000 to $999,999 | 0 (0.0%) | 0 (0.0%) |
| $1,000,000 or more | 0 (0.0%) | 0 (0.0%) |
| Total | 355 (100.0%) | 773 (100.0%) |
Household Income by Mortgage Status in Roebuck
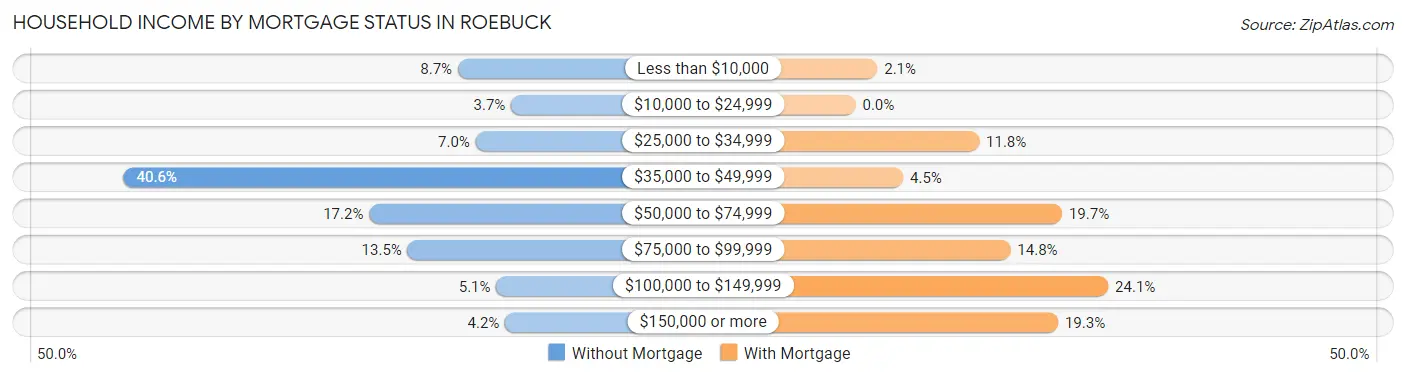
| Household Income | Without Mortgage | With Mortgage |
| Less than $10,000 | 31 (8.7%) | 16 (2.1%) |
| $10,000 to $24,999 | 13 (3.7%) | 0 (0.0%) |
| $25,000 to $34,999 | 25 (7.0%) | 91 (11.8%) |
| $35,000 to $49,999 | 144 (40.6%) | 35 (4.5%) |
| $50,000 to $74,999 | 61 (17.2%) | 152 (19.7%) |
| $75,000 to $99,999 | 48 (13.5%) | 114 (14.7%) |
| $100,000 to $149,999 | 18 (5.1%) | 186 (24.1%) |
| $150,000 or more | 15 (4.2%) | 149 (19.3%) |
| Total | 355 (100.0%) | 773 (100.0%) |
Property Value to Household Income Ratio in Roebuck
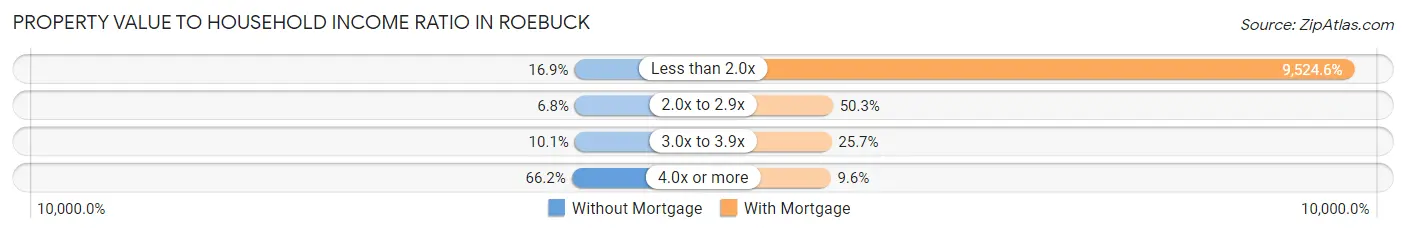
| Value-to-Income Ratio | Without Mortgage | With Mortgage |
| Less than 2.0x | 60 (16.9%) | 73,625 (9,524.6%) |
| 2.0x to 2.9x | 24 (6.8%) | 389 (50.3%) |
| 3.0x to 3.9x | 36 (10.1%) | 199 (25.7%) |
| 4.0x or more | 235 (66.2%) | 74 (9.6%) |
| Total | 355 (100.0%) | 773 (100.0%) |
Real Estate Taxes by Mortgage Status in Roebuck
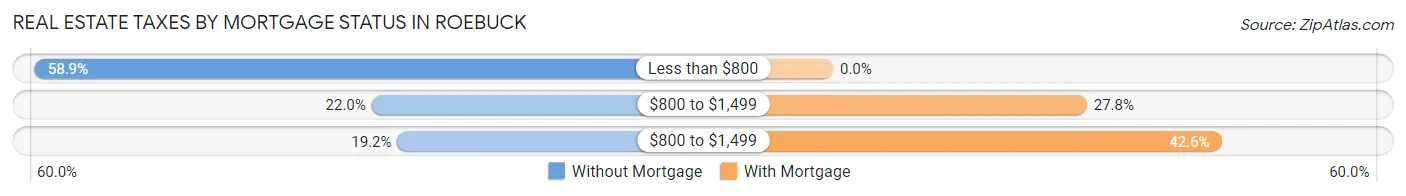
| Property Taxes | Without Mortgage | With Mortgage |
| Less than $800 | 209 (58.9%) | 0 (0.0%) |
| $800 to $1,499 | 78 (22.0%) | 215 (27.8%) |
| $800 to $1,499 | 68 (19.2%) | 329 (42.6%) |
| Total | 355 (100.0%) | 773 (100.0%) |
Health & Disability in Roebuck
Health Insurance Coverage by Age in Roebuck
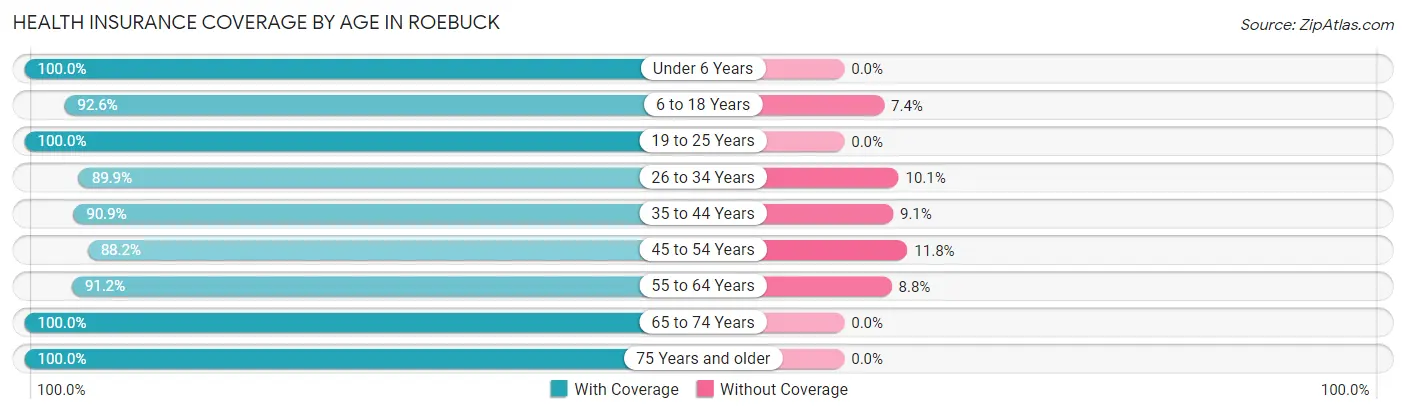
| Age Bracket | With Coverage | Without Coverage |
| Under 6 Years | 224 (100.0%) | 0 (0.0%) |
| 6 to 18 Years | 598 (92.6%) | 48 (7.4%) |
| 19 to 25 Years | 155 (100.0%) | 0 (0.0%) |
| 26 to 34 Years | 773 (89.9%) | 87 (10.1%) |
| 35 to 44 Years | 410 (90.9%) | 41 (9.1%) |
| 45 to 54 Years | 652 (88.2%) | 87 (11.8%) |
| 55 to 64 Years | 310 (91.2%) | 30 (8.8%) |
| 65 to 74 Years | 230 (100.0%) | 0 (0.0%) |
| 75 Years and older | 192 (100.0%) | 0 (0.0%) |
| Total | 3,544 (92.4%) | 293 (7.6%) |
Health Insurance Coverage by Citizenship Status in Roebuck
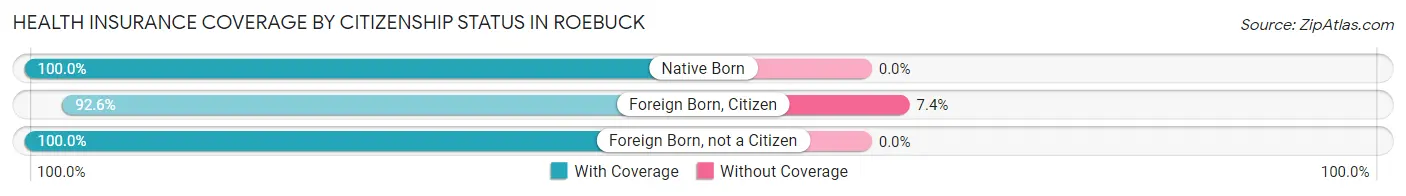
| Citizenship Status | With Coverage | Without Coverage |
| Native Born | 224 (100.0%) | 0 (0.0%) |
| Foreign Born, Citizen | 598 (92.6%) | 48 (7.4%) |
| Foreign Born, not a Citizen | 155 (100.0%) | 0 (0.0%) |
Health Insurance Coverage by Household Income in Roebuck
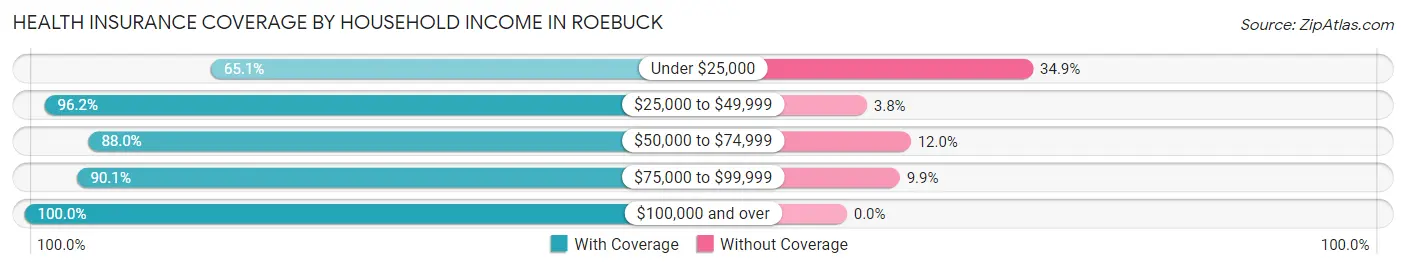
| Household Income | With Coverage | Without Coverage |
| Under $25,000 | 151 (65.1%) | 81 (34.9%) |
| $25,000 to $49,999 | 947 (96.2%) | 37 (3.8%) |
| $50,000 to $74,999 | 772 (88.0%) | 105 (12.0%) |
| $75,000 to $99,999 | 636 (90.1%) | 70 (9.9%) |
| $100,000 and over | 1,038 (100.0%) | 0 (0.0%) |
Public vs Private Health Insurance Coverage by Age in Roebuck
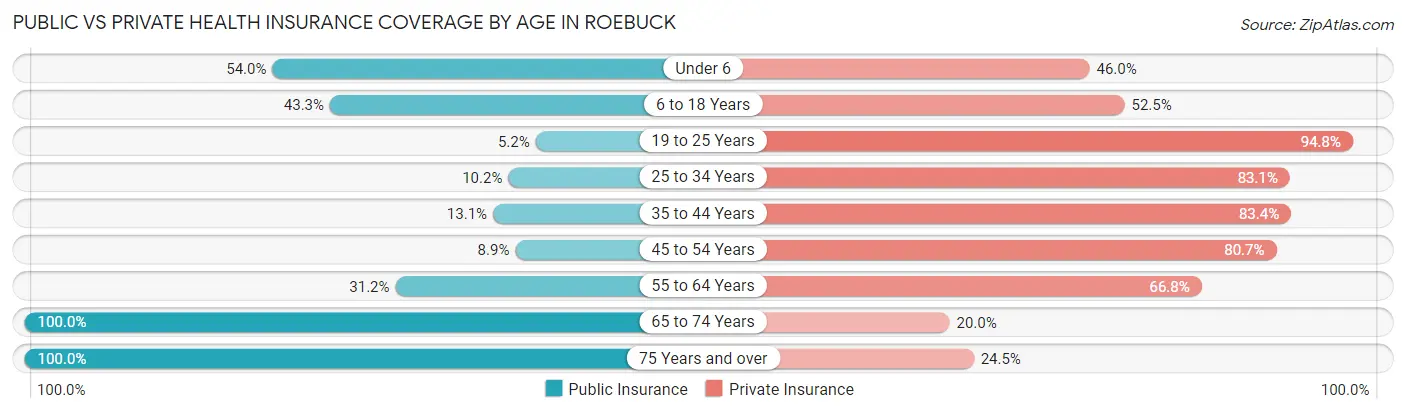
| Age Bracket | Public Insurance | Private Insurance |
| Under 6 | 121 (54.0%) | 103 (46.0%) |
| 6 to 18 Years | 280 (43.3%) | 339 (52.5%) |
| 19 to 25 Years | 8 (5.2%) | 147 (94.8%) |
| 25 to 34 Years | 88 (10.2%) | 715 (83.1%) |
| 35 to 44 Years | 59 (13.1%) | 376 (83.4%) |
| 45 to 54 Years | 66 (8.9%) | 596 (80.6%) |
| 55 to 64 Years | 106 (31.2%) | 227 (66.8%) |
| 65 to 74 Years | 230 (100.0%) | 46 (20.0%) |
| 75 Years and over | 192 (100.0%) | 47 (24.5%) |
| Total | 1,150 (30.0%) | 2,596 (67.7%) |
Disability Status by Sex by Age in Roebuck
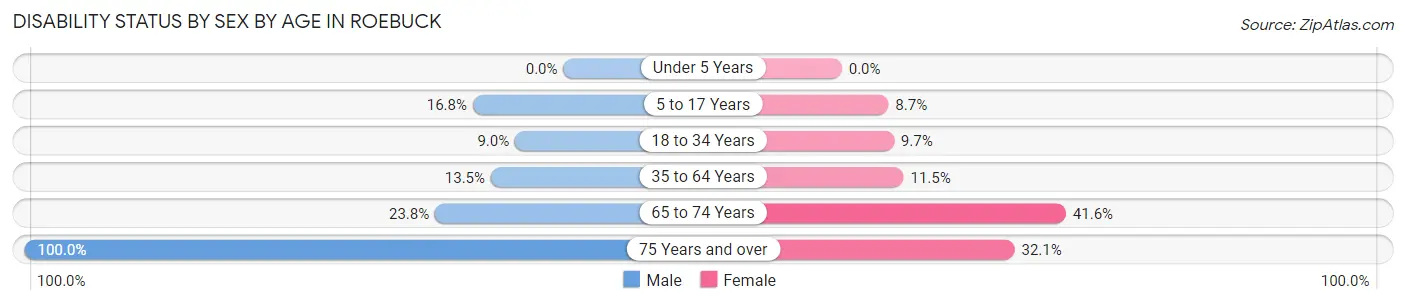
| Age Bracket | Male | Female |
| Under 5 Years | 0 (0.0%) | 0 (0.0%) |
| 5 to 17 Years | 65 (16.8%) | 18 (8.6%) |
| 18 to 34 Years | 48 (9.0%) | 52 (9.7%) |
| 35 to 64 Years | 106 (13.5%) | 85 (11.5%) |
| 65 to 74 Years | 25 (23.8%) | 52 (41.6%) |
| 75 Years and over | 61 (100.0%) | 42 (32.1%) |
Disability Class by Sex by Age in Roebuck
Disability Class: Hearing Difficulty
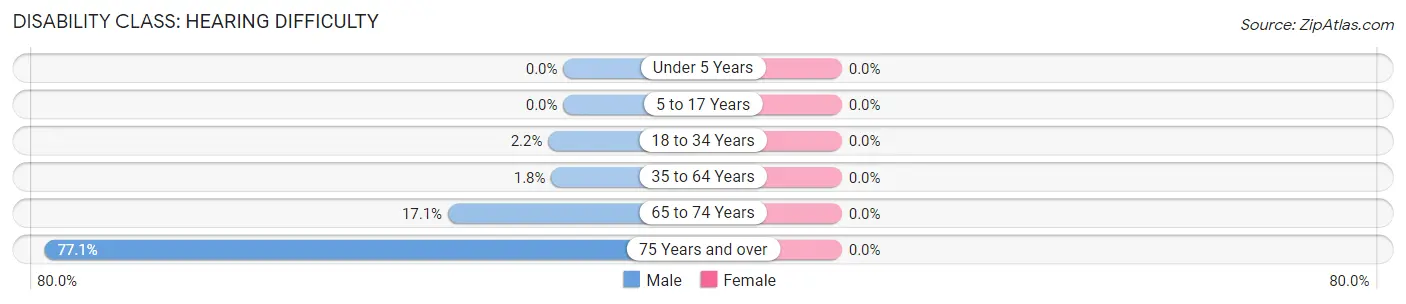
| Age Bracket | Male | Female |
| Under 5 Years | 0 (0.0%) | 0 (0.0%) |
| 5 to 17 Years | 0 (0.0%) | 0 (0.0%) |
| 18 to 34 Years | 12 (2.2%) | 0 (0.0%) |
| 35 to 64 Years | 14 (1.8%) | 0 (0.0%) |
| 65 to 74 Years | 18 (17.1%) | 0 (0.0%) |
| 75 Years and over | 47 (77.0%) | 0 (0.0%) |
Disability Class: Vision Difficulty
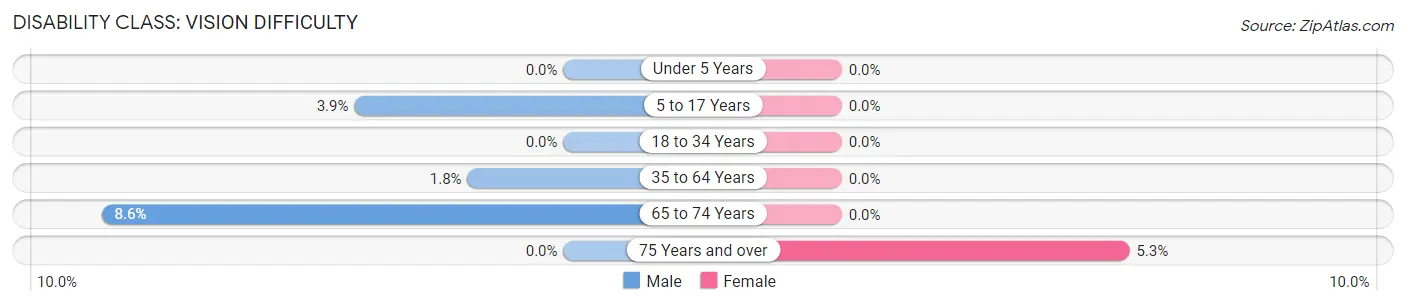
| Age Bracket | Male | Female |
| Under 5 Years | 0 (0.0%) | 0 (0.0%) |
| 5 to 17 Years | 15 (3.9%) | 0 (0.0%) |
| 18 to 34 Years | 0 (0.0%) | 0 (0.0%) |
| 35 to 64 Years | 14 (1.8%) | 0 (0.0%) |
| 65 to 74 Years | 9 (8.6%) | 0 (0.0%) |
| 75 Years and over | 0 (0.0%) | 7 (5.3%) |
Disability Class: Cognitive Difficulty
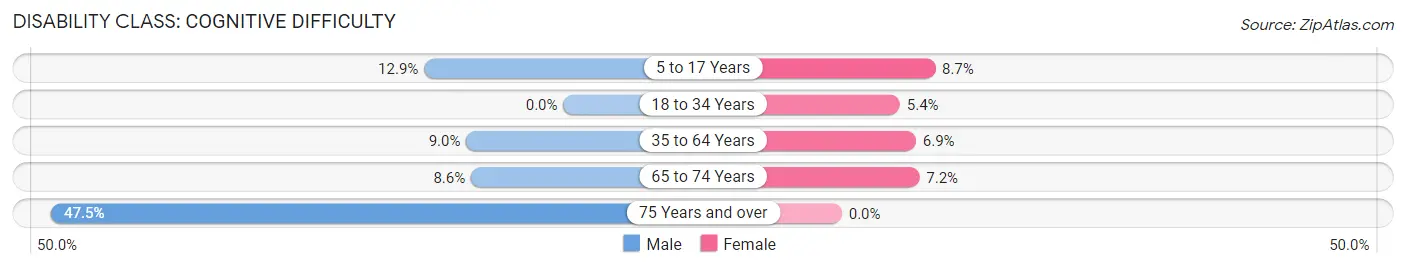
| Age Bracket | Male | Female |
| 5 to 17 Years | 50 (12.9%) | 18 (8.6%) |
| 18 to 34 Years | 0 (0.0%) | 29 (5.4%) |
| 35 to 64 Years | 71 (9.0%) | 51 (6.9%) |
| 65 to 74 Years | 9 (8.6%) | 9 (7.2%) |
| 75 Years and over | 29 (47.5%) | 0 (0.0%) |
Disability Class: Ambulatory Difficulty
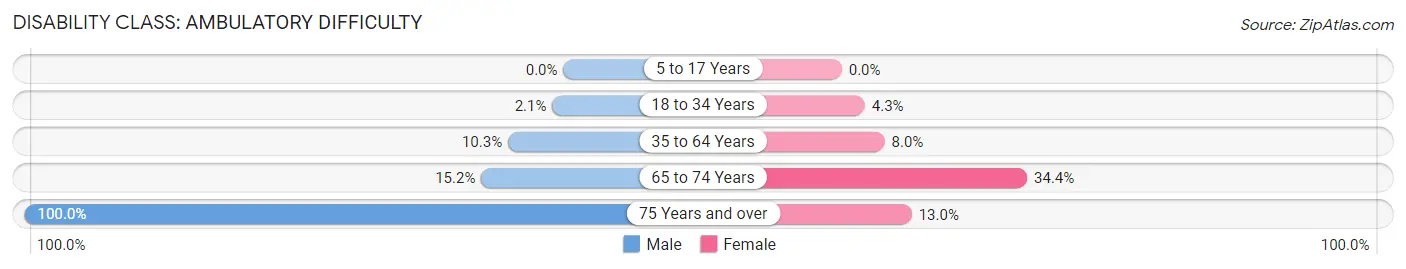
| Age Bracket | Male | Female |
| 5 to 17 Years | 0 (0.0%) | 0 (0.0%) |
| 18 to 34 Years | 11 (2.1%) | 23 (4.3%) |
| 35 to 64 Years | 81 (10.3%) | 59 (8.0%) |
| 65 to 74 Years | 16 (15.2%) | 43 (34.4%) |
| 75 Years and over | 61 (100.0%) | 17 (13.0%) |
Disability Class: Self-Care Difficulty
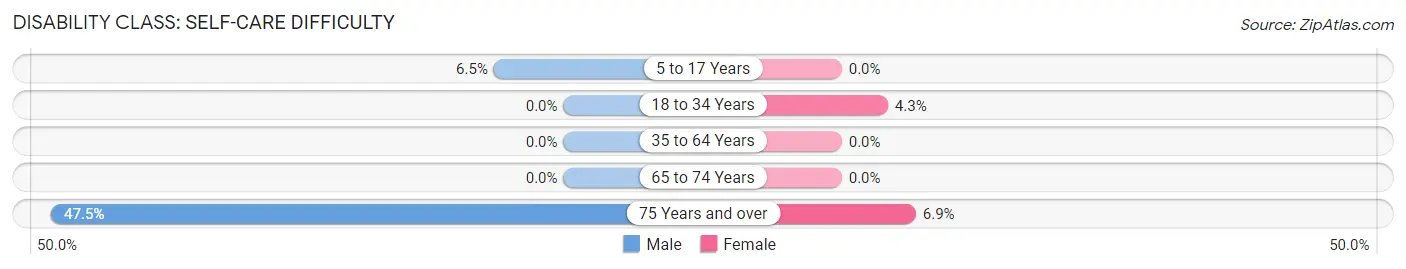
| Age Bracket | Male | Female |
| 5 to 17 Years | 25 (6.5%) | 0 (0.0%) |
| 18 to 34 Years | 0 (0.0%) | 23 (4.3%) |
| 35 to 64 Years | 0 (0.0%) | 0 (0.0%) |
| 65 to 74 Years | 0 (0.0%) | 0 (0.0%) |
| 75 Years and over | 29 (47.5%) | 9 (6.9%) |
Technology Access in Roebuck
Computing Device Access in Roebuck
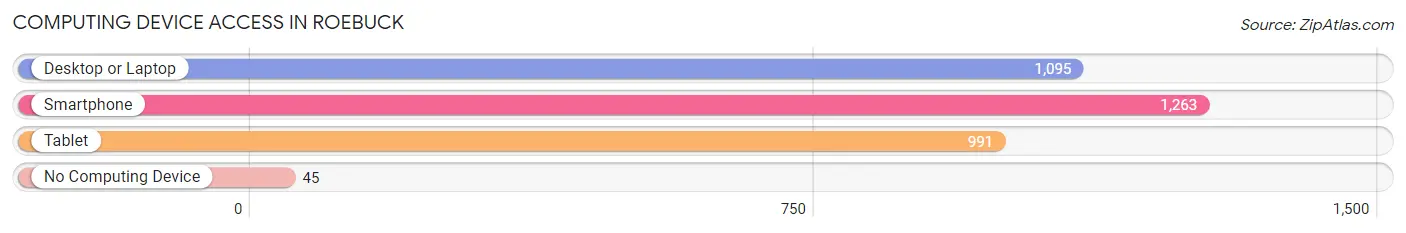
| Device Type | # Households | % Households |
| Desktop or Laptop | 1,095 | 77.5% |
| Smartphone | 1,263 | 89.4% |
| Tablet | 991 | 70.1% |
| No Computing Device | 45 | 3.2% |
| Total | 1,413 | 100.0% |
Internet Access in Roebuck
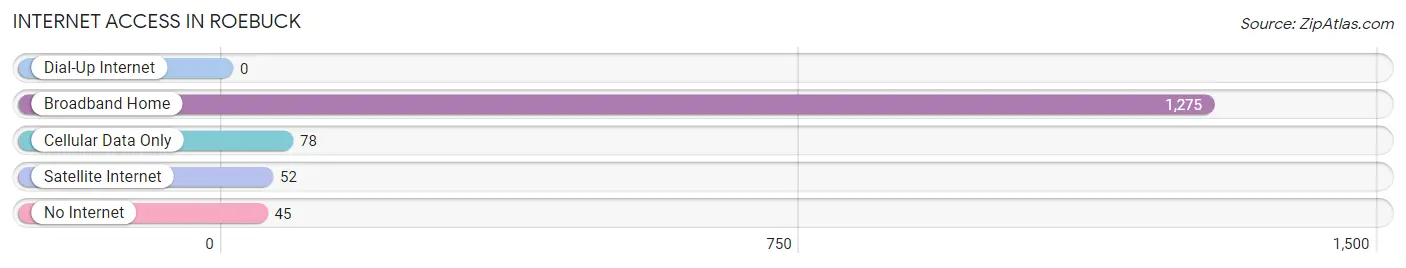
| Internet Type | # Households | % Households |
| Dial-Up Internet | 0 | 0.0% |
| Broadband Home | 1,275 | 90.2% |
| Cellular Data Only | 78 | 5.5% |
| Satellite Internet | 52 | 3.7% |
| No Internet | 45 | 3.2% |
| Total | 1,413 | 100.0% |
Roebuck Summary
Roebuck is a small unincorporated community located in Spartanburg County, South Carolina. It is situated in the foothills of the Blue Ridge Mountains, approximately 15 miles northwest of Spartanburg. Roebuck is a rural community with a population of approximately 2,000 people.
History
The area that is now Roebuck was first settled in the late 1700s by a group of Scotch-Irish immigrants. The settlement was originally known as “Cross Roads” due to its location at the intersection of two major roads. In 1820, the settlement was renamed Roebuck after a local family who owned a large amount of land in the area.
In the late 1800s, the town began to grow and develop. The first post office was established in 1887 and the first school was built in 1895. The town also had a cotton mill, a grist mill, and a sawmill.
In the early 1900s, Roebuck began to experience a period of growth and prosperity. The town was incorporated in 1912 and the first mayor was elected in 1913. The town also had a bank, a hotel, and several stores.
Geography
Roebuck is located in the foothills of the Blue Ridge Mountains in Spartanburg County, South Carolina. The town is situated at an elevation of 890 feet above sea level. The town is located approximately 15 miles northwest of Spartanburg and is bordered by the towns of Reidville, Moore, and Inman.
The town is located in a rural area and is surrounded by rolling hills and farmland. The town is also located near several lakes, including Lake Bowen, Lake Blalock, and Lake Cooley.
Economy
The economy of Roebuck is largely based on agriculture. The town is home to several farms that produce a variety of crops, including corn, soybeans, and cotton. The town also has several small businesses, including restaurants, convenience stores, and auto repair shops.
Demographics
As of the 2010 census, the population of Roebuck was 2,039. The racial makeup of the town was 94.3% White, 3.2% African American, 0.7% Native American, 0.3% Asian, and 1.5% from other races. The median household income was $37,917 and the median family income was $45,938.
Roebuck is a small, rural community with a rich history and a strong sense of community. The town is home to a diverse population and is a great place to live and work.
Common Questions
What is Per Capita Income in Roebuck?
Per Capita income in Roebuck is $27,227.
What is the Median Family Income in Roebuck?
Median Family Income in Roebuck is $58,900.
What is the Median Household income in Roebuck?
Median Household Income in Roebuck is $58,738.
What is Income or Wage Gap in Roebuck?
Income or Wage Gap in Roebuck is 0.8%.
Women in Roebuck earn 99.2 cents for every dollar earned by a man.
What is Inequality or Gini Index in Roebuck?
Inequality or Gini Index in Roebuck is 0.33.
What is the Total Population of Roebuck?
Total Population of Roebuck is 3,837.
What is the Total Male Population of Roebuck?
Total Male Population of Roebuck is 2,002.
What is the Total Female Population of Roebuck?
Total Female Population of Roebuck is 1,835.
What is the Ratio of Males per 100 Females in Roebuck?
There are 109.10 Males per 100 Females in Roebuck.
What is the Ratio of Females per 100 Males in Roebuck?
There are 91.66 Females per 100 Males in Roebuck.
What is the Median Population Age in Roebuck?
Median Population Age in Roebuck is 35.6 Years.
What is the Average Family Size in Roebuck
Average Family Size in Roebuck is 3.0 People.
What is the Average Household Size in Roebuck
Average Household Size in Roebuck is 2.7 People.
How Large is the Labor Force in Roebuck?
There are 2,297 People in the Labor Forcein in Roebuck.
What is the Percentage of People in the Labor Force in Roebuck?
72.2% of People are in the Labor Force in Roebuck.
What is the Unemployment Rate in Roebuck?
Unemployment Rate in Roebuck is 1.9%.