Union, SC Map & Demographics
Union Map
Union Overview
$25,672
PER CAPITA INCOME
$56,818
AVG FAMILY INCOME
$32,548
AVG HOUSEHOLD INCOME
28.4%
WAGE / INCOME GAP [ % ]
71.6¢/ $1
WAGE / INCOME GAP [ $ ]
0.50
INEQUALITY / GINI INDEX
8,099
TOTAL POPULATION
3,602
MALE POPULATION
4,497
FEMALE POPULATION
80.10
MALES / 100 FEMALES
124.85
FEMALES / 100 MALES
45.5
MEDIAN AGE
2.9
AVG FAMILY SIZE
2.1
AVG HOUSEHOLD SIZE
3,725
LABOR FORCE [ PEOPLE ]
55.7%
PERCENT IN LABOR FORCE
15.3%
UNEMPLOYMENT RATE
Union Zip Codes
Union Area Codes
Income in Union
Income Overview in Union
Per Capita Income in Union is $25,672, while median incomes of families and households are $56,818 and $32,548 respectively.
| Characteristic | Number | Measure |
| Per Capita Income | 8,099 | $25,672 |
| Median Family Income | 2,060 | $56,818 |
| Mean Family Income | 2,060 | $69,892 |
| Median Household Income | 3,793 | $32,548 |
| Mean Household Income | 3,793 | $53,624 |
| Income Deficit | 2,060 | $0 |
| Wage / Income Gap (%) | 8,099 | 28.36% |
| Wage / Income Gap ($) | 8,099 | 71.64¢ per $1 |
| Gini / Inequality Index | 8,099 | 0.50 |
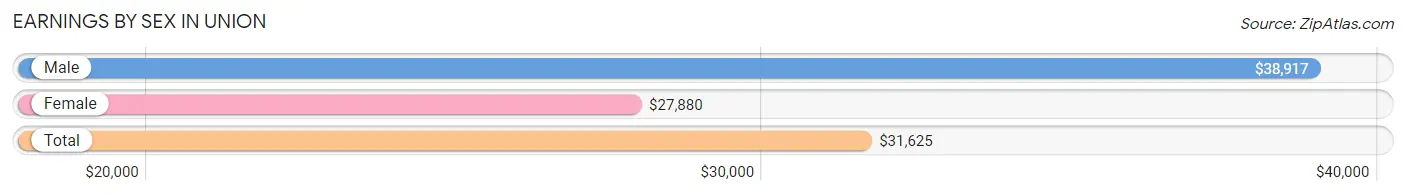
Earnings by Sex in Union
Average Earnings in Union are $31,625, $38,917 for men and $27,880 for women, a difference of 28.4%.
| Sex | Number | Average Earnings |
| Male | 1,627 (43.5%) | $38,917 |
| Female | 2,110 (56.5%) | $27,880 |
| Total | 3,737 (100.0%) | $31,625 |
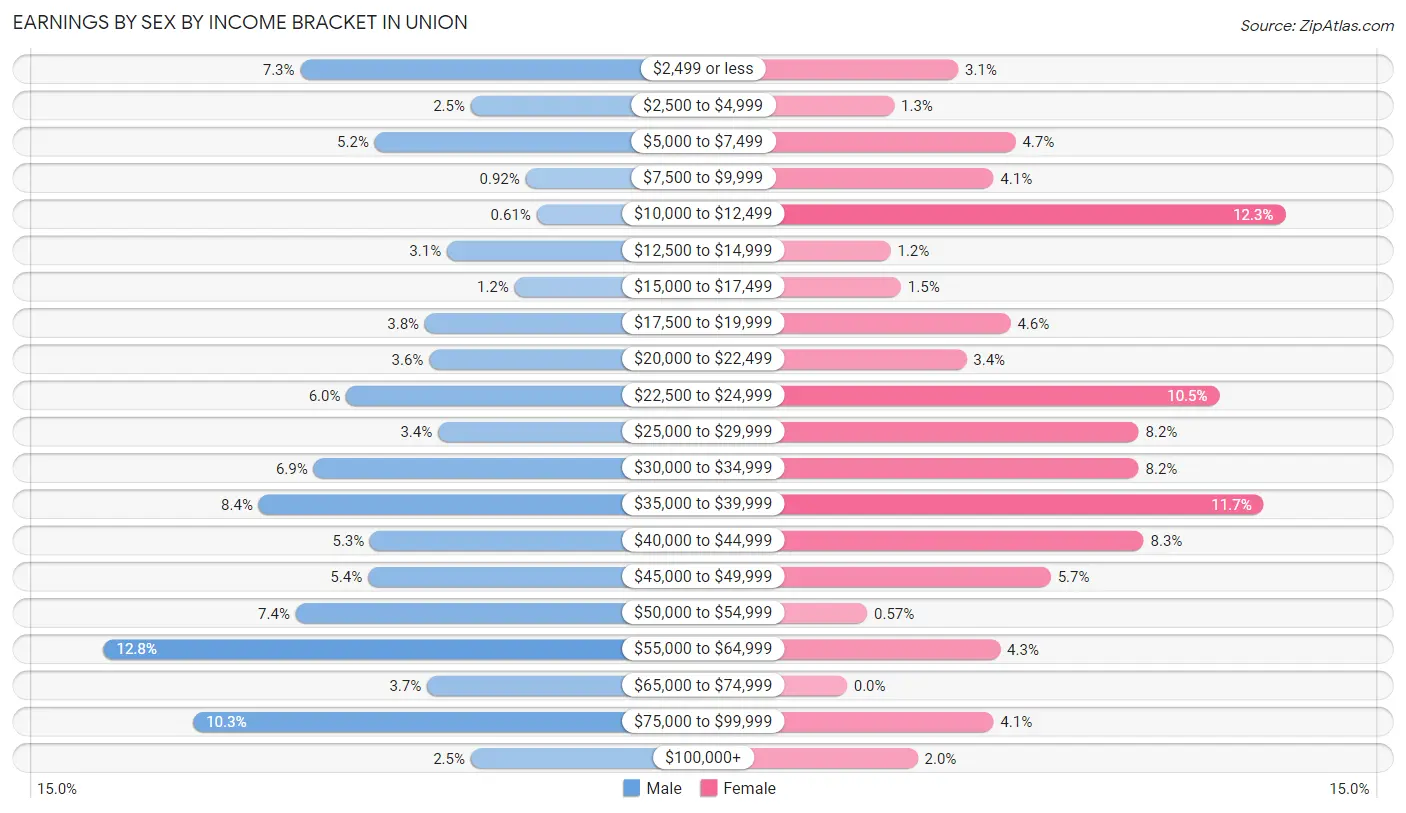
Earnings by Sex by Income Bracket in Union
The most common earnings brackets in Union are $55,000 to $64,999 for men (208 | 12.8%) and $10,000 to $12,499 for women (260 | 12.3%).
| Income | Male | Female |
| $2,499 or less | 118 (7.2%) | 66 (3.1%) |
| $2,500 to $4,999 | 40 (2.5%) | 28 (1.3%) |
| $5,000 to $7,499 | 84 (5.2%) | 100 (4.7%) |
| $7,500 to $9,999 | 15 (0.9%) | 87 (4.1%) |
| $10,000 to $12,499 | 10 (0.6%) | 260 (12.3%) |
| $12,500 to $14,999 | 51 (3.1%) | 26 (1.2%) |
| $15,000 to $17,499 | 20 (1.2%) | 32 (1.5%) |
| $17,500 to $19,999 | 61 (3.7%) | 97 (4.6%) |
| $20,000 to $22,499 | 59 (3.6%) | 71 (3.4%) |
| $22,500 to $24,999 | 97 (6.0%) | 221 (10.5%) |
| $25,000 to $29,999 | 55 (3.4%) | 173 (8.2%) |
| $30,000 to $34,999 | 112 (6.9%) | 173 (8.2%) |
| $35,000 to $39,999 | 137 (8.4%) | 247 (11.7%) |
| $40,000 to $44,999 | 86 (5.3%) | 176 (8.3%) |
| $45,000 to $49,999 | 87 (5.3%) | 121 (5.7%) |
| $50,000 to $54,999 | 120 (7.4%) | 12 (0.6%) |
| $55,000 to $64,999 | 208 (12.8%) | 91 (4.3%) |
| $65,000 to $74,999 | 60 (3.7%) | 0 (0.0%) |
| $75,000 to $99,999 | 167 (10.3%) | 87 (4.1%) |
| $100,000+ | 40 (2.5%) | 42 (2.0%) |
| Total | 1,627 (100.0%) | 2,110 (100.0%) |
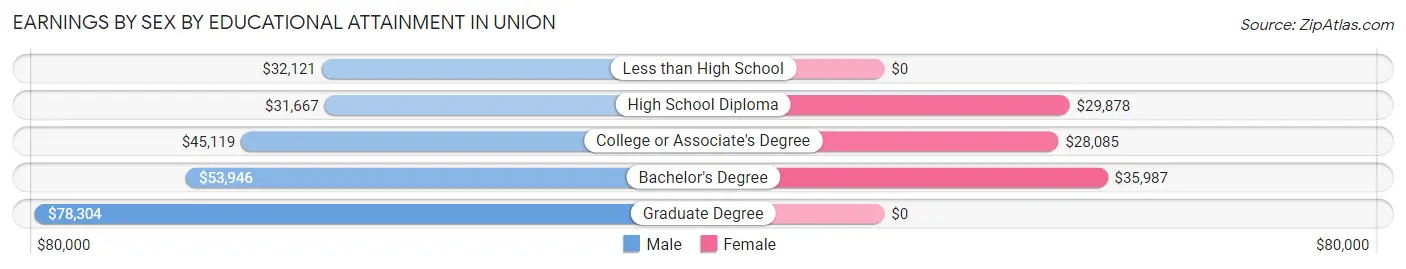
Earnings by Sex by Educational Attainment in Union
Average earnings in Union are $40,389 for men and $29,920 for women, a difference of 25.9%. Men with an educational attainment of graduate degree enjoy the highest average annual earnings of $78,304, while those with high school diploma education earn the least with $31,667. Women with an educational attainment of bachelor's degree earn the most with the average annual earnings of $35,987, while those with college or associate's degree education have the smallest earnings of $28,085.
| Educational Attainment | Male Income | Female Income |
| Less than High School | $32,121 | $0 |
| High School Diploma | $31,667 | $29,878 |
| College or Associate's Degree | $45,119 | $28,085 |
| Bachelor's Degree | $53,946 | $35,987 |
| Graduate Degree | $78,304 | $0 |
| Total | $40,389 | $29,920 |
Family Income in Union
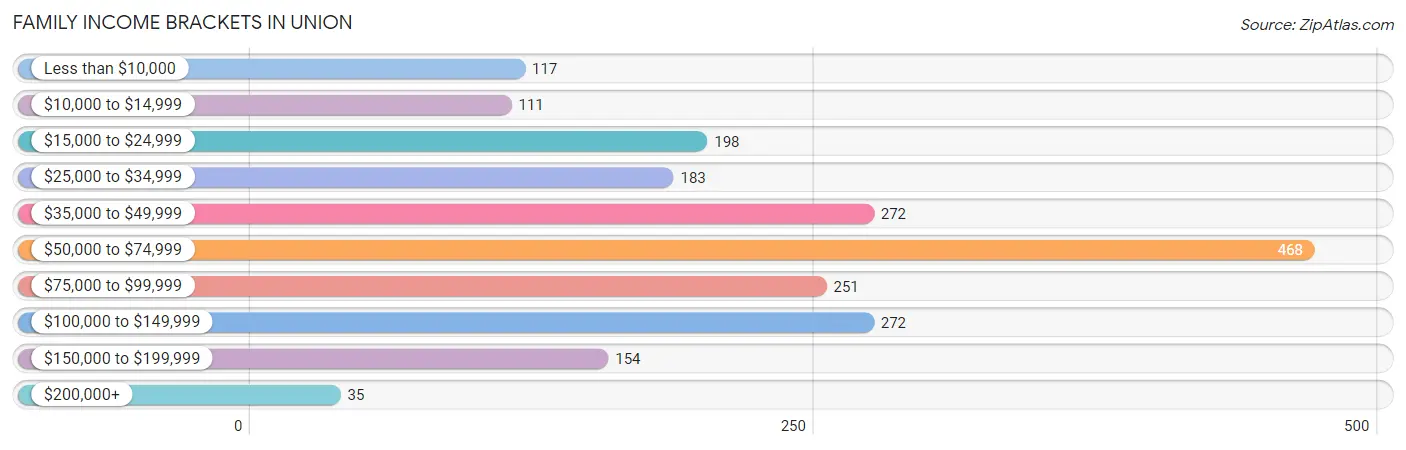
Family Income Brackets in Union
According to the Union family income data, there are 468 families falling into the $50,000 to $74,999 income range, which is the most common income bracket and makes up 22.7% of all families. Conversely, the $200,000+ income bracket is the least frequent group with only 35 families (1.7%) belonging to this category.
| Income Bracket | # Families | % Families |
| Less than $10,000 | 117 | 5.7% |
| $10,000 to $14,999 | 111 | 5.4% |
| $15,000 to $24,999 | 198 | 9.6% |
| $25,000 to $34,999 | 183 | 8.9% |
| $35,000 to $49,999 | 272 | 13.2% |
| $50,000 to $74,999 | 468 | 22.7% |
| $75,000 to $99,999 | 251 | 12.2% |
| $100,000 to $149,999 | 272 | 13.2% |
| $150,000 to $199,999 | 154 | 7.5% |
| $200,000+ | 35 | 1.7% |
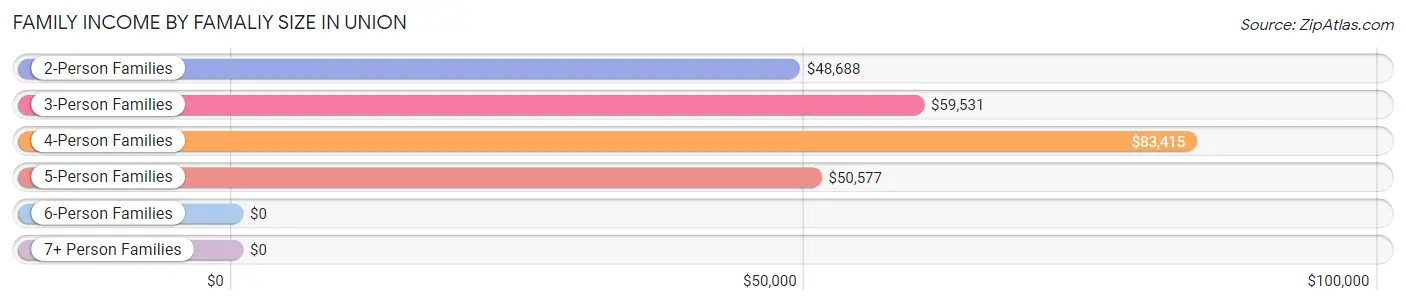
Family Income by Famaliy Size in Union
4-person families (288 | 14.0%) account for the highest median family income in Union with $83,415 per family, while 2-person families (981 | 47.6%) have the highest median income of $24,344 per family member.
| Income Bracket | # Families | Median Income |
| 2-Person Families | 981 (47.6%) | $48,688 |
| 3-Person Families | 570 (27.7%) | $59,531 |
| 4-Person Families | 288 (14.0%) | $83,415 |
| 5-Person Families | 198 (9.6%) | $50,577 |
| 6-Person Families | 13 (0.6%) | $0 |
| 7+ Person Families | 10 (0.5%) | $0 |
| Total | 2,060 (100.0%) | $56,818 |
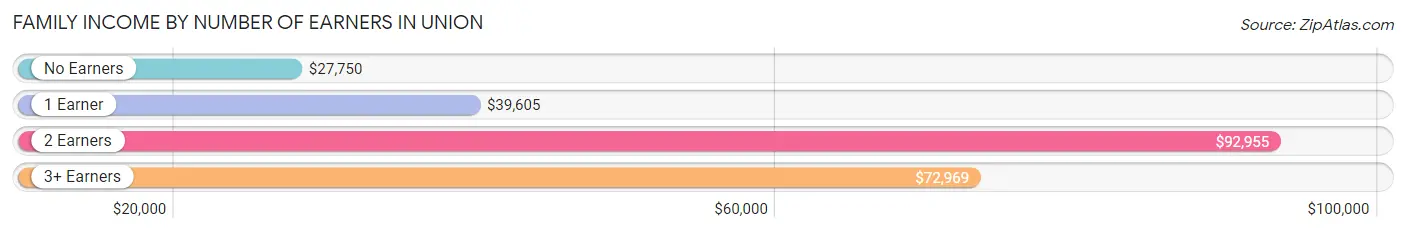
Family Income by Number of Earners in Union
The median family income in Union is $56,818, with families comprising 2 earners (728) having the highest median family income of $92,955, while families with no earners (349) have the lowest median family income of $27,750, accounting for 35.3% and 16.9% of families, respectively.
| Number of Earners | # Families | Median Income |
| No Earners | 349 (16.9%) | $27,750 |
| 1 Earner | 824 (40.0%) | $39,605 |
| 2 Earners | 728 (35.3%) | $92,955 |
| 3+ Earners | 159 (7.7%) | $72,969 |
| Total | 2,060 (100.0%) | $56,818 |
Household Income in Union
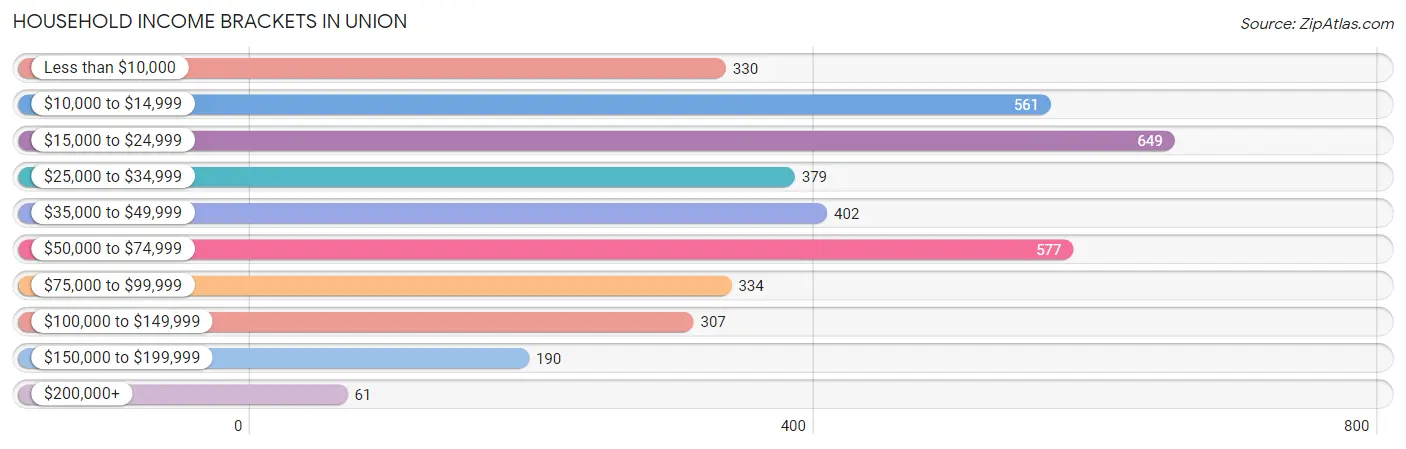
Household Income Brackets in Union
With 649 households falling in the category, the $15,000 to $24,999 income range is the most frequent in Union, accounting for 17.1% of all households. In contrast, only 61 households (1.6%) fall into the $200,000+ income bracket, making it the least populous group.
| Income Bracket | # Households | % Households |
| Less than $10,000 | 330 | 8.7% |
| $10,000 to $14,999 | 561 | 14.8% |
| $15,000 to $24,999 | 649 | 17.1% |
| $25,000 to $34,999 | 379 | 10.0% |
| $35,000 to $49,999 | 402 | 10.6% |
| $50,000 to $74,999 | 577 | 15.2% |
| $75,000 to $99,999 | 334 | 8.8% |
| $100,000 to $149,999 | 307 | 8.1% |
| $150,000 to $199,999 | 190 | 5.0% |
| $200,000+ | 61 | 1.6% |
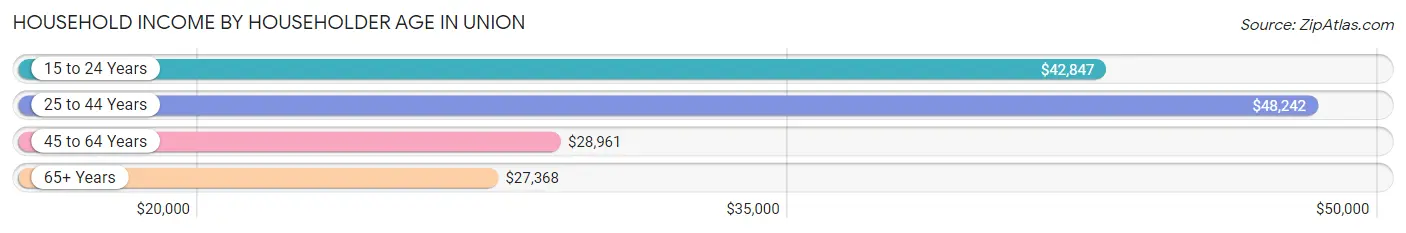
Household Income by Householder Age in Union
The median household income in Union is $32,548, with the highest median household income of $48,242 found in the 25 to 44 years age bracket for the primary householder. A total of 837 households (22.1%) fall into this category. Meanwhile, the 65+ years age bracket for the primary householder has the lowest median household income of $27,368, with 1,186 households (31.3%) in this group.
| Income Bracket | # Households | Median Income |
| 15 to 24 Years | 140 (3.7%) | $42,847 |
| 25 to 44 Years | 837 (22.1%) | $48,242 |
| 45 to 64 Years | 1,630 (43.0%) | $28,961 |
| 65+ Years | 1,186 (31.3%) | $27,368 |
| Total | 3,793 (100.0%) | $32,548 |
Poverty in Union
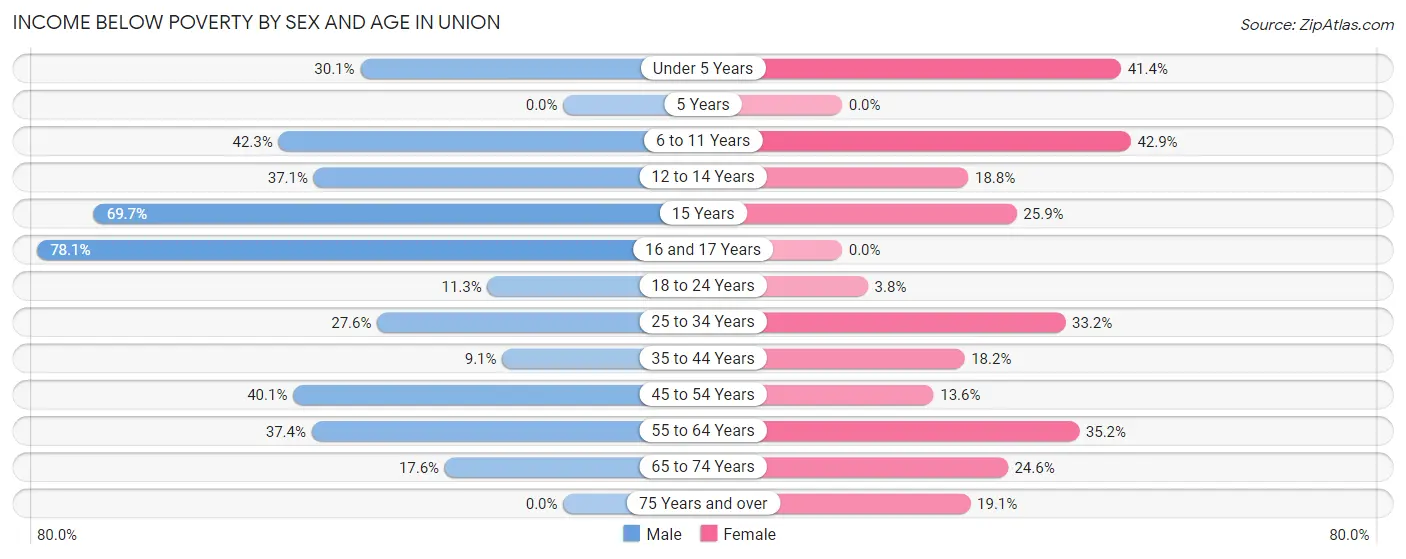
Income Below Poverty by Sex and Age in Union
With 27.9% poverty level for males and 23.4% for females among the residents of Union, 16 and 17 year old males and 6 to 11 year old females are the most vulnerable to poverty, with 25 males (78.1%) and 111 females (42.9%) in their respective age groups living below the poverty level.
| Age Bracket | Male | Female |
| Under 5 Years | 88 (30.1%) | 70 (41.4%) |
| 5 Years | 0 (0.0%) | 0 (0.0%) |
| 6 to 11 Years | 107 (42.3%) | 111 (42.9%) |
| 12 to 14 Years | 53 (37.1%) | 18 (18.8%) |
| 15 Years | 76 (69.7%) | 14 (25.9%) |
| 16 and 17 Years | 25 (78.1%) | 0 (0.0%) |
| 18 to 24 Years | 33 (11.3%) | 17 (3.8%) |
| 25 to 34 Years | 118 (27.6%) | 182 (33.2%) |
| 35 to 44 Years | 27 (9.1%) | 76 (18.2%) |
| 45 to 54 Years | 225 (40.1%) | 106 (13.6%) |
| 55 to 64 Years | 170 (37.4%) | 233 (35.2%) |
| 65 to 74 Years | 64 (17.6%) | 139 (24.6%) |
| 75 Years and over | 0 (0.0%) | 76 (19.1%) |
| Total | 986 (27.9%) | 1,042 (23.4%) |
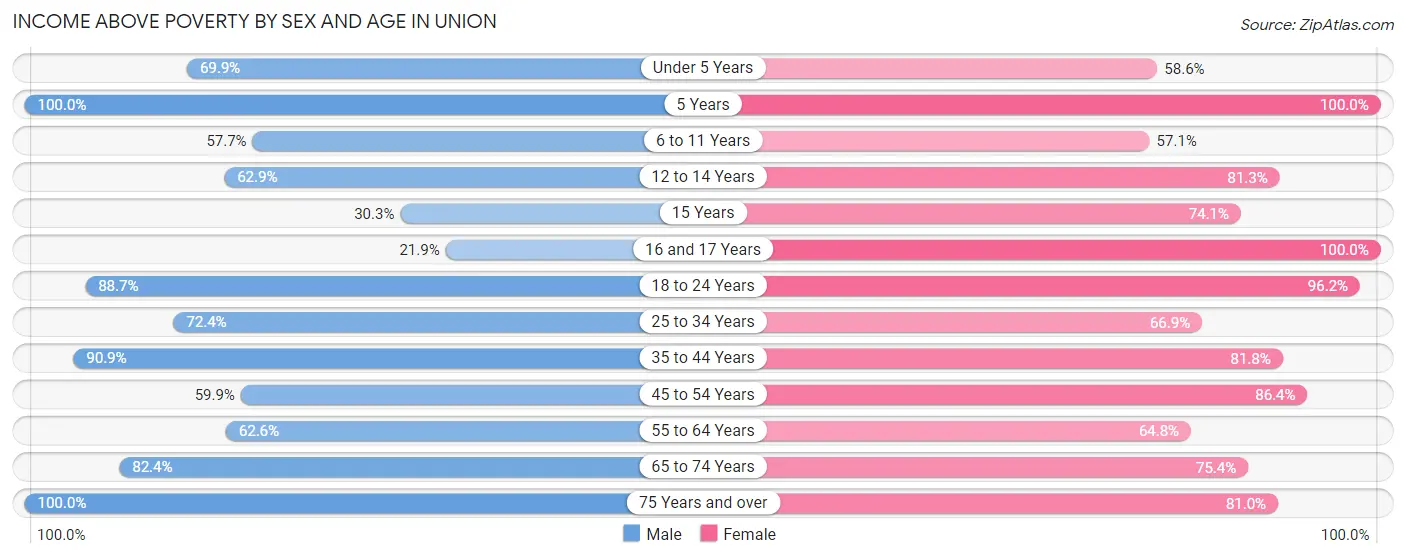
Income Above Poverty by Sex and Age in Union
According to the poverty statistics in Union, males aged 5 years and females aged 5 years are the age groups that are most secure financially, with 100.0% of males and 100.0% of females in these age groups living above the poverty line.
| Age Bracket | Male | Female |
| Under 5 Years | 204 (69.9%) | 99 (58.6%) |
| 5 Years | 7 (100.0%) | 27 (100.0%) |
| 6 to 11 Years | 146 (57.7%) | 148 (57.1%) |
| 12 to 14 Years | 90 (62.9%) | 78 (81.2%) |
| 15 Years | 33 (30.3%) | 40 (74.1%) |
| 16 and 17 Years | 7 (21.9%) | 30 (100.0%) |
| 18 to 24 Years | 260 (88.7%) | 426 (96.2%) |
| 25 to 34 Years | 309 (72.4%) | 367 (66.8%) |
| 35 to 44 Years | 271 (90.9%) | 342 (81.8%) |
| 45 to 54 Years | 336 (59.9%) | 674 (86.4%) |
| 55 to 64 Years | 285 (62.6%) | 429 (64.8%) |
| 65 to 74 Years | 300 (82.4%) | 426 (75.4%) |
| 75 Years and over | 300 (100.0%) | 323 (80.9%) |
| Total | 2,548 (72.1%) | 3,409 (76.6%) |
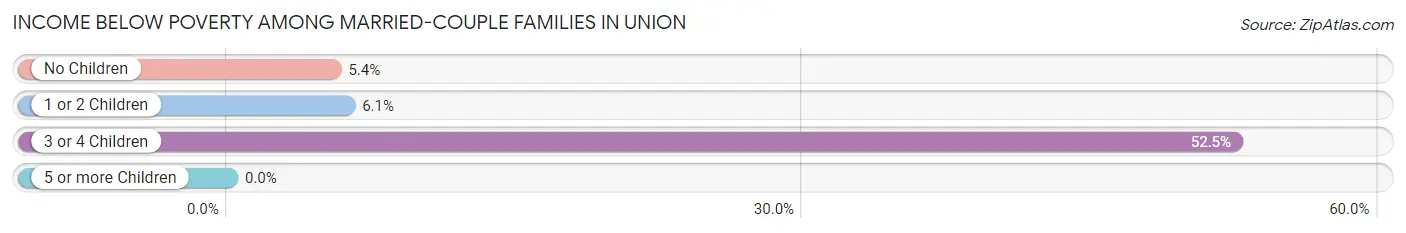
Income Below Poverty Among Married-Couple Families in Union
The poverty statistics for married-couple families in Union show that 11.2% or 132 of the total 1,178 families live below the poverty line. Families with 3 or 4 children have the highest poverty rate of 52.5%, comprising of 74 families. On the other hand, families with no children have the lowest poverty rate of 5.4%, which includes 41 families.
| Children | Above Poverty | Below Poverty |
| No Children | 718 (94.6%) | 41 (5.4%) |
| 1 or 2 Children | 261 (93.9%) | 17 (6.1%) |
| 3 or 4 Children | 67 (47.5%) | 74 (52.5%) |
| 5 or more Children | 0 (0.0%) | 0 (0.0%) |
| Total | 1,046 (88.8%) | 132 (11.2%) |
Income Below Poverty Among Single-Parent Households in Union
According to the poverty data in Union, 25.0% or 12 single-father households and 23.6% or 197 single-mother households are living below the poverty line. Among single-father households, those with 1 or 2 children have the highest poverty rate, with 12 households (40.0%) experiencing poverty. Likewise, among single-mother households, those with 1 or 2 children have the highest poverty rate, with 146 households (29.4%) falling below the poverty line.
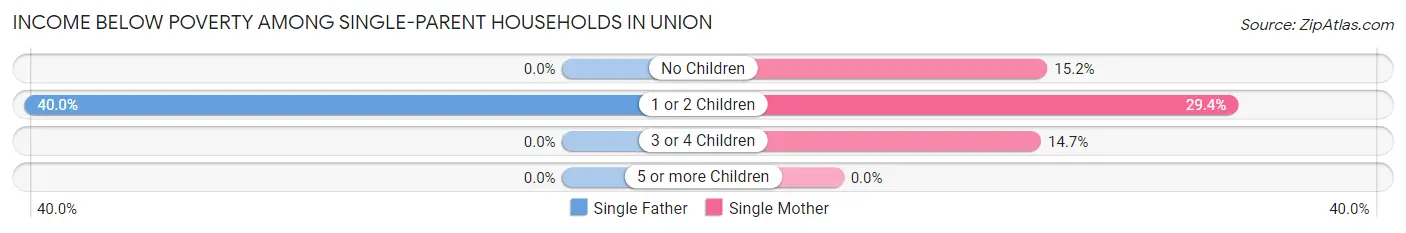
| Children | Single Father | Single Mother |
| No Children | 0 (0.0%) | 46 (15.2%) |
| 1 or 2 Children | 12 (40.0%) | 146 (29.4%) |
| 3 or 4 Children | 0 (0.0%) | 5 (14.7%) |
| 5 or more Children | 0 (0.0%) | 0 (0.0%) |
| Total | 12 (25.0%) | 197 (23.6%) |
Income Below Poverty Among Married-Couple vs Single-Parent Households in Union
The poverty data for Union shows that 132 of the married-couple family households (11.2%) and 209 of the single-parent households (23.7%) are living below the poverty level. Within the married-couple family households, those with 3 or 4 children have the highest poverty rate, with 74 households (52.5%) falling below the poverty line. Among the single-parent households, those with 1 or 2 children have the highest poverty rate, with 158 household (30.0%) living below poverty.
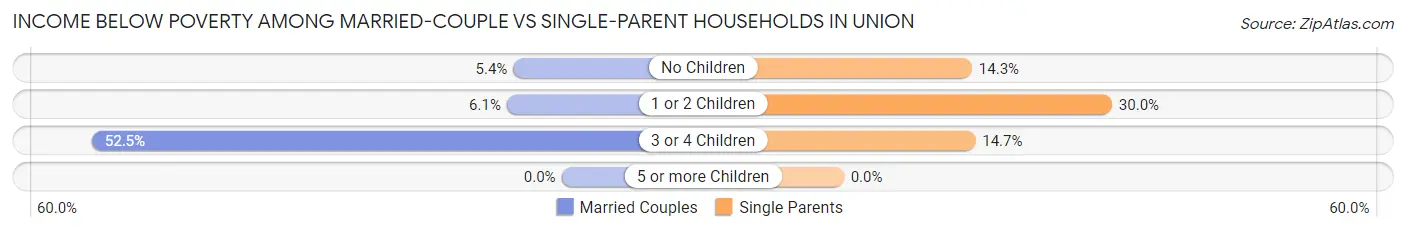
| Children | Married-Couple Families | Single-Parent Households |
| No Children | 41 (5.4%) | 46 (14.3%) |
| 1 or 2 Children | 17 (6.1%) | 158 (30.0%) |
| 3 or 4 Children | 74 (52.5%) | 5 (14.7%) |
| 5 or more Children | 0 (0.0%) | 0 (0.0%) |
| Total | 132 (11.2%) | 209 (23.7%) |
Race in Union
The most populous races in Union are White / Caucasian (4,138 | 51.1%), Black / African American (3,624 | 44.8%), and Two or more Races (324 | 4.0%).
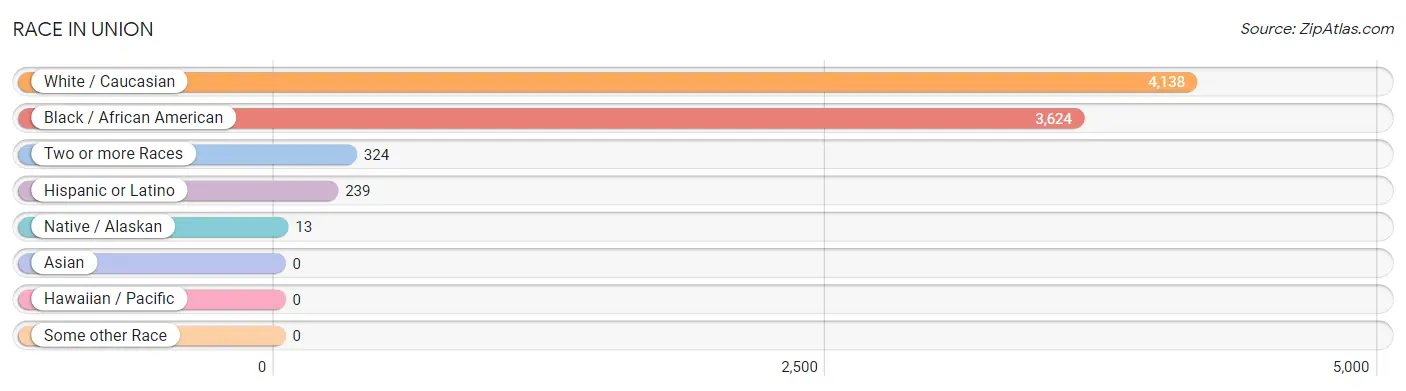
| Race | # Population | % Population |
| Asian | 0 | 0.0% |
| Black / African American | 3,624 | 44.8% |
| Hawaiian / Pacific | 0 | 0.0% |
| Hispanic or Latino | 239 | 2.9% |
| Native / Alaskan | 13 | 0.2% |
| White / Caucasian | 4,138 | 51.1% |
| Two or more Races | 324 | 4.0% |
| Some other Race | 0 | 0.0% |
| Total | 8,099 | 100.0% |
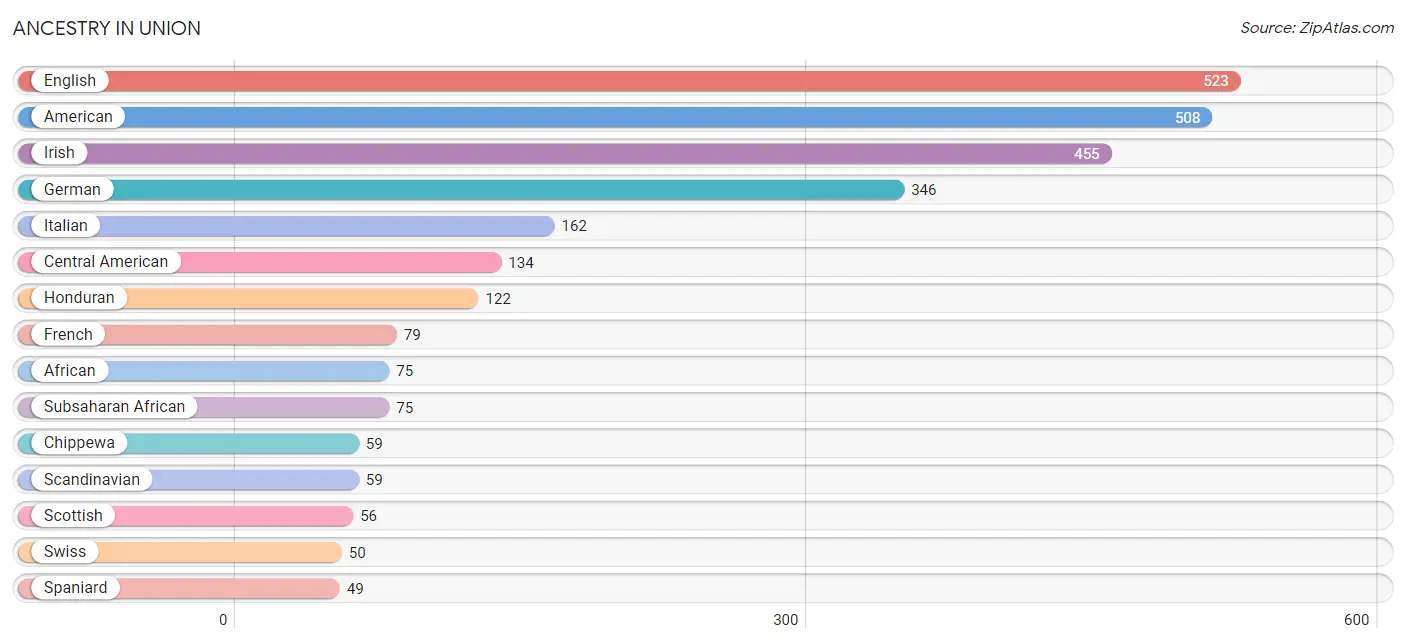
Ancestry in Union
The most populous ancestries reported in Union are English (523 | 6.5%), American (508 | 6.3%), Irish (455 | 5.6%), German (346 | 4.3%), and Italian (162 | 2.0%), together accounting for 24.6% of all Union residents.
| Ancestry | # Population | % Population |
| African | 75 | 0.9% |
| American | 508 | 6.3% |
| Austrian | 11 | 0.1% |
| British | 27 | 0.3% |
| Central American | 134 | 1.7% |
| Cherokee | 19 | 0.2% |
| Chippewa | 59 | 0.7% |
| Choctaw | 5 | 0.1% |
| Dutch | 33 | 0.4% |
| English | 523 | 6.5% |
| European | 20 | 0.3% |
| French | 79 | 1.0% |
| German | 346 | 4.3% |
| Greek | 41 | 0.5% |
| Honduran | 122 | 1.5% |
| Hungarian | 11 | 0.1% |
| Irish | 455 | 5.6% |
| Italian | 162 | 2.0% |
| Jamaican | 48 | 0.6% |
| Northern European | 5 | 0.1% |
| Panamanian | 12 | 0.2% |
| Polish | 15 | 0.2% |
| Puerto Rican | 38 | 0.5% |
| Scandinavian | 59 | 0.7% |
| Scotch-Irish | 33 | 0.4% |
| Scottish | 56 | 0.7% |
| Spaniard | 49 | 0.6% |
| Sri Lankan | 36 | 0.4% |
| Subsaharan African | 75 | 0.9% |
| Swiss | 50 | 0.6% |
| Welsh | 3 | 0.0% | View All 31 Rows |
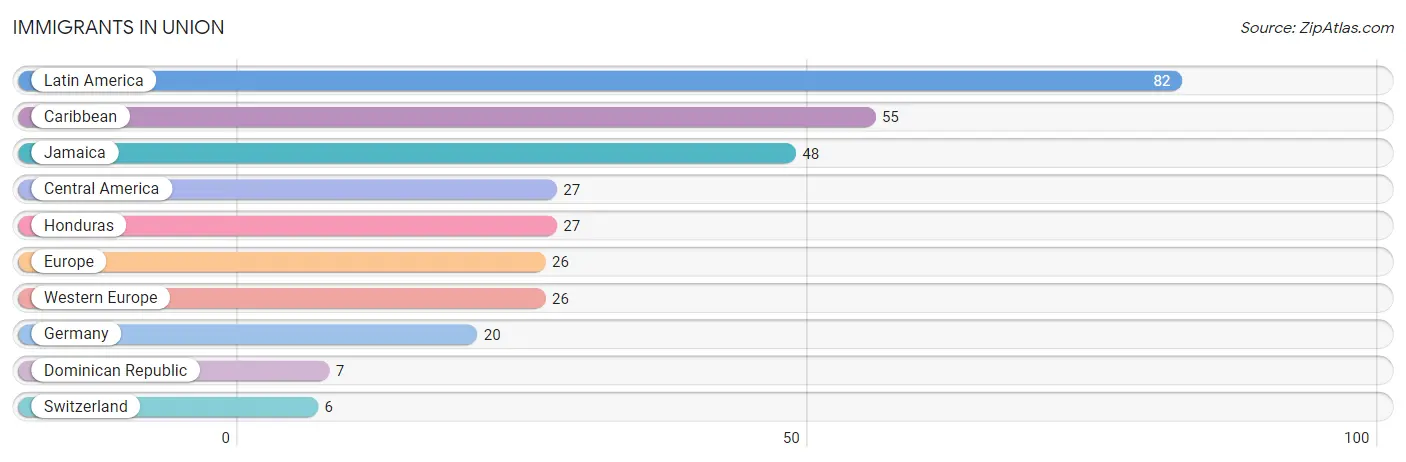
Immigrants in Union
The most numerous immigrant groups reported in Union came from Latin America (82 | 1.0%), Caribbean (55 | 0.7%), Jamaica (48 | 0.6%), Central America (27 | 0.3%), and Honduras (27 | 0.3%), together accounting for 2.9% of all Union residents.
| Immigration Origin | # Population | % Population |
| Caribbean | 55 | 0.7% |
| Central America | 27 | 0.3% |
| Dominican Republic | 7 | 0.1% |
| Europe | 26 | 0.3% |
| Germany | 20 | 0.3% |
| Honduras | 27 | 0.3% |
| Jamaica | 48 | 0.6% |
| Latin America | 82 | 1.0% |
| Switzerland | 6 | 0.1% |
| Western Europe | 26 | 0.3% | View All 10 Rows |
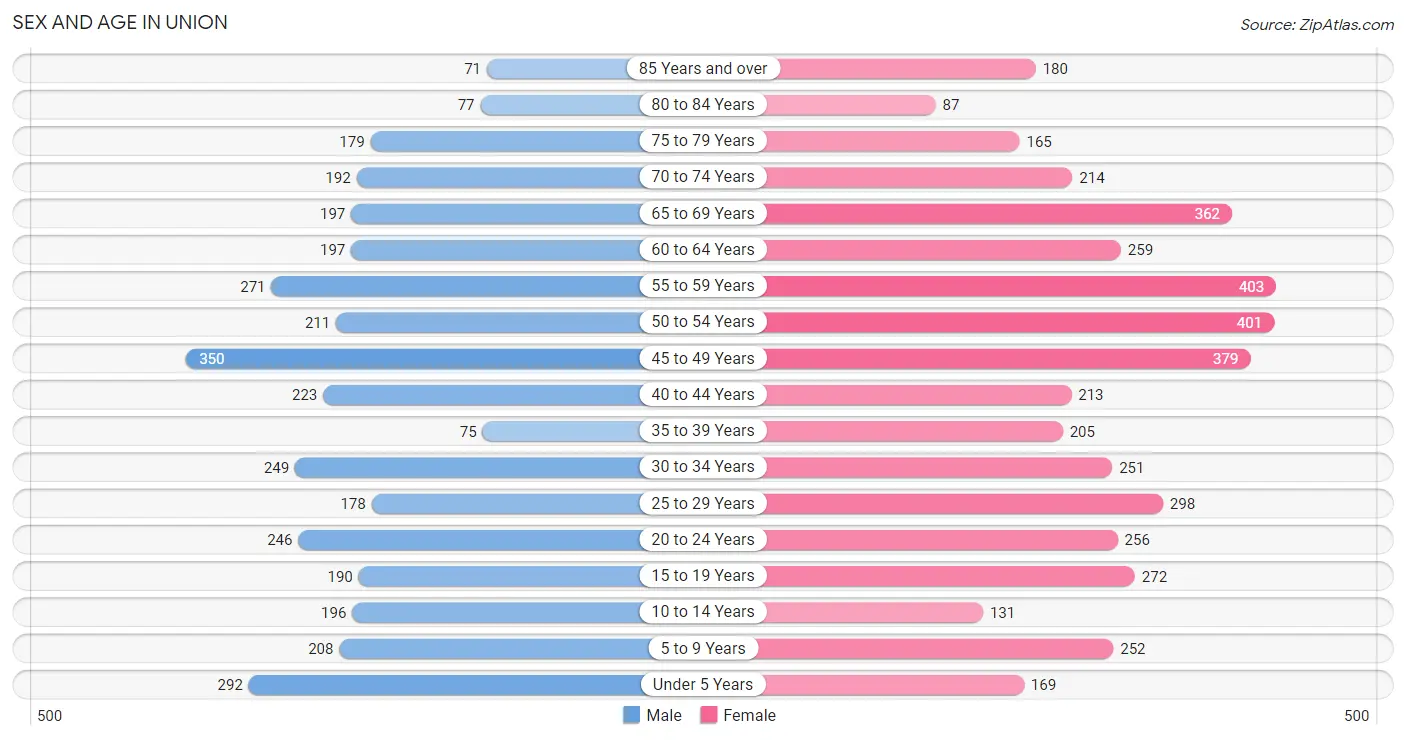
Sex and Age in Union
Sex and Age in Union
The most populous age groups in Union are 45 to 49 Years (350 | 9.7%) for men and 55 to 59 Years (403 | 9.0%) for women.
| Age Bracket | Male | Female |
| Under 5 Years | 292 (8.1%) | 169 (3.8%) |
| 5 to 9 Years | 208 (5.8%) | 252 (5.6%) |
| 10 to 14 Years | 196 (5.4%) | 131 (2.9%) |
| 15 to 19 Years | 190 (5.3%) | 272 (6.0%) |
| 20 to 24 Years | 246 (6.8%) | 256 (5.7%) |
| 25 to 29 Years | 178 (4.9%) | 298 (6.6%) |
| 30 to 34 Years | 249 (6.9%) | 251 (5.6%) |
| 35 to 39 Years | 75 (2.1%) | 205 (4.6%) |
| 40 to 44 Years | 223 (6.2%) | 213 (4.7%) |
| 45 to 49 Years | 350 (9.7%) | 379 (8.4%) |
| 50 to 54 Years | 211 (5.9%) | 401 (8.9%) |
| 55 to 59 Years | 271 (7.5%) | 403 (9.0%) |
| 60 to 64 Years | 197 (5.5%) | 259 (5.8%) |
| 65 to 69 Years | 197 (5.5%) | 362 (8.1%) |
| 70 to 74 Years | 192 (5.3%) | 214 (4.8%) |
| 75 to 79 Years | 179 (5.0%) | 165 (3.7%) |
| 80 to 84 Years | 77 (2.1%) | 87 (1.9%) |
| 85 Years and over | 71 (2.0%) | 180 (4.0%) |
| Total | 3,602 (100.0%) | 4,497 (100.0%) |
Families and Households in Union
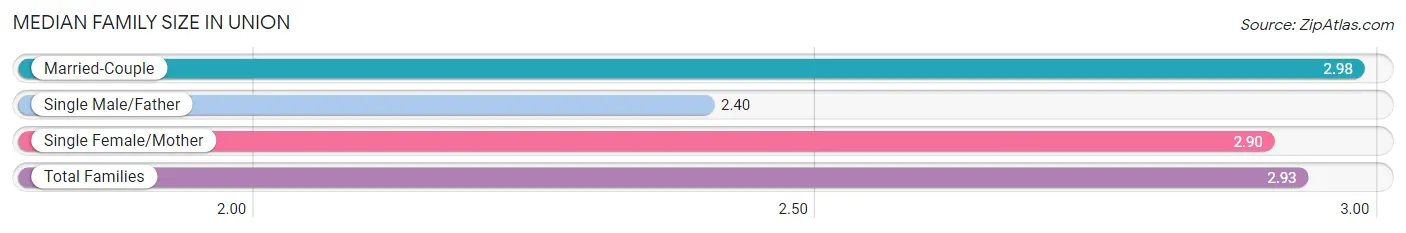
Median Family Size in Union
The median family size in Union is 2.93 persons per family, with married-couple families (1,178 | 57.2%) accounting for the largest median family size of 2.98 persons per family. On the other hand, single male/father families (48 | 2.3%) represent the smallest median family size with 2.40 persons per family.
| Family Type | # Families | Family Size |
| Married-Couple | 1,178 (57.2%) | 2.98 |
| Single Male/Father | 48 (2.3%) | 2.40 |
| Single Female/Mother | 834 (40.5%) | 2.90 |
| Total Families | 2,060 (100.0%) | 2.93 |
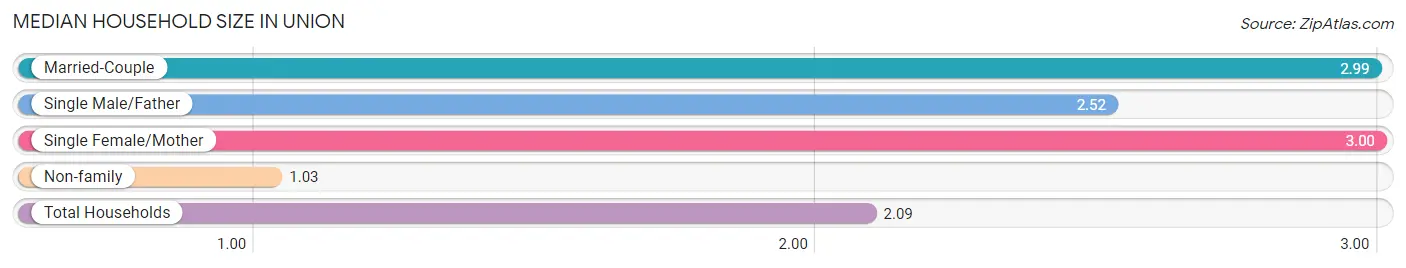
Median Household Size in Union
The median household size in Union is 2.09 persons per household, with single female/mother households (834 | 22.0%) accounting for the largest median household size of 3 persons per household. non-family households (1,733 | 45.7%) represent the smallest median household size with 1.03 persons per household.
| Household Type | # Households | Household Size |
| Married-Couple | 1,178 (31.1%) | 2.99 |
| Single Male/Father | 48 (1.3%) | 2.52 |
| Single Female/Mother | 834 (22.0%) | 3.00 |
| Non-family | 1,733 (45.7%) | 1.03 |
| Total Households | 3,793 (100.0%) | 2.09 |
Household Size by Marriage Status in Union
Out of a total of 3,793 households in Union, 2,060 (54.3%) are family households, while 1,733 (45.7%) are nonfamily households. The most numerous type of family households are 2-person households, comprising 958, and the most common type of nonfamily households are 1-person households, comprising 1,671.
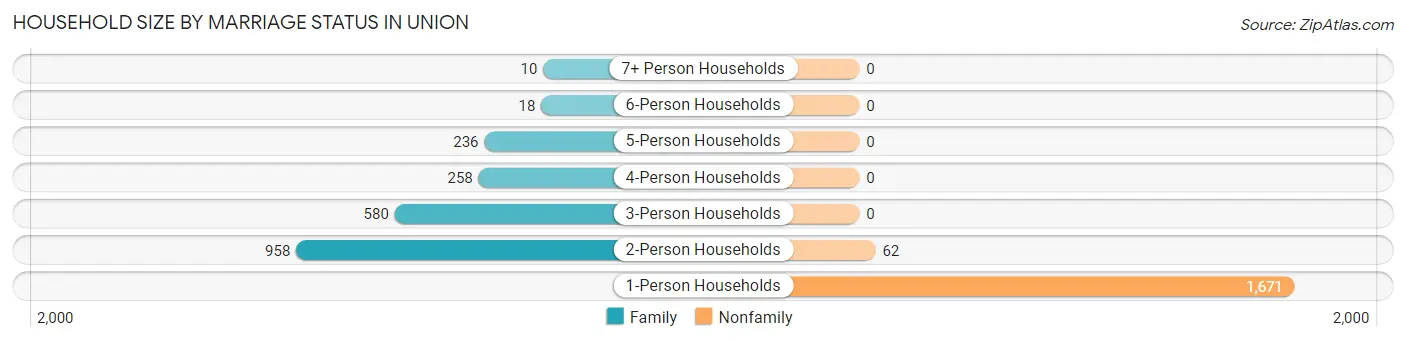
| Household Size | Family Households | Nonfamily Households |
| 1-Person Households | - | 1,671 (44.1%) |
| 2-Person Households | 958 (25.3%) | 62 (1.6%) |
| 3-Person Households | 580 (15.3%) | 0 (0.0%) |
| 4-Person Households | 258 (6.8%) | 0 (0.0%) |
| 5-Person Households | 236 (6.2%) | 0 (0.0%) |
| 6-Person Households | 18 (0.5%) | 0 (0.0%) |
| 7+ Person Households | 10 (0.3%) | 0 (0.0%) |
| Total | 2,060 (54.3%) | 1,733 (45.7%) |
Female Fertility in Union
Fertility by Age in Union
Average fertility rate in Union is 56.0 births per 1,000 women. Women in the age bracket of 20 to 34 years have the highest fertility rate with 137.0 births per 1,000 women. Women in the age bracket of 20 to 34 years acount for 100.0% of all women with births.
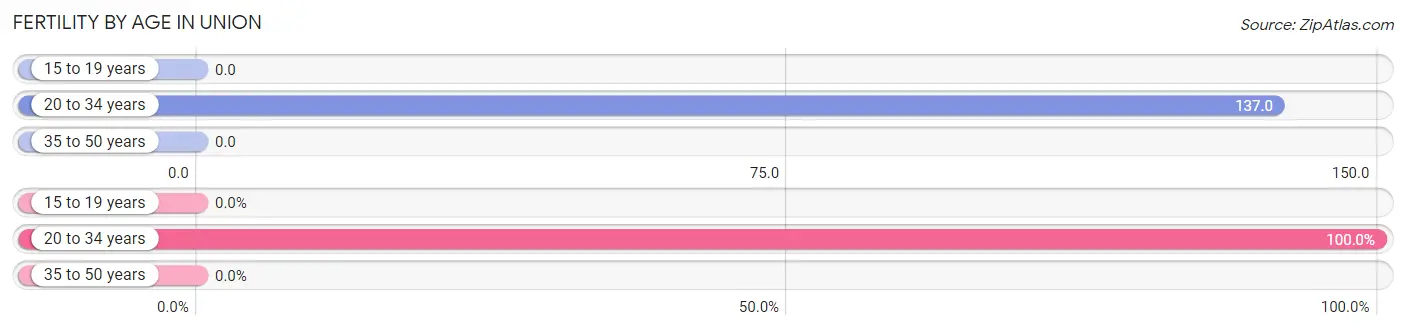
| Age Bracket | Women with Births | Births / 1,000 Women |
| 15 to 19 years | 0 (0.0%) | 0.0 |
| 20 to 34 years | 110 (100.0%) | 137.0 |
| 35 to 50 years | 0 (0.0%) | 0.0 |
| Total | 110 (100.0%) | 56.0 |
Fertility by Age by Marriage Status in Union
39.1% of women with births (110) in Union are married. The highest percentage of unmarried women with births falls into 20 to 34 years age bracket with 60.9% of them unmarried at the time of birth, while the lowest percentage of unmarried women with births belong to 20 to 34 years age bracket with 60.9% of them unmarried.
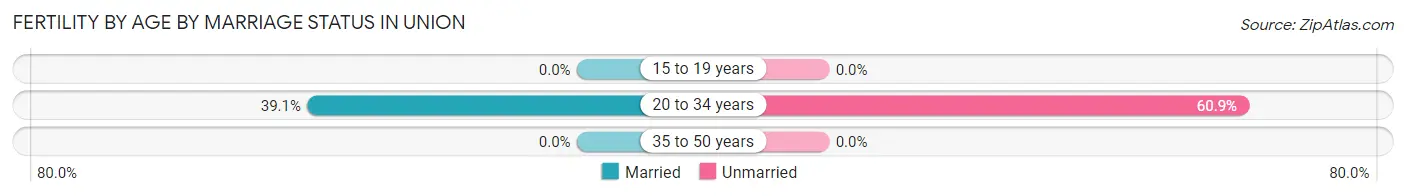
| Age Bracket | Married | Unmarried |
| 15 to 19 years | 0 (0.0%) | 0 (0.0%) |
| 20 to 34 years | 43 (39.1%) | 67 (60.9%) |
| 35 to 50 years | 0 (0.0%) | 0 (0.0%) |
| Total | 43 (39.1%) | 67 (60.9%) |
Fertility by Education in Union
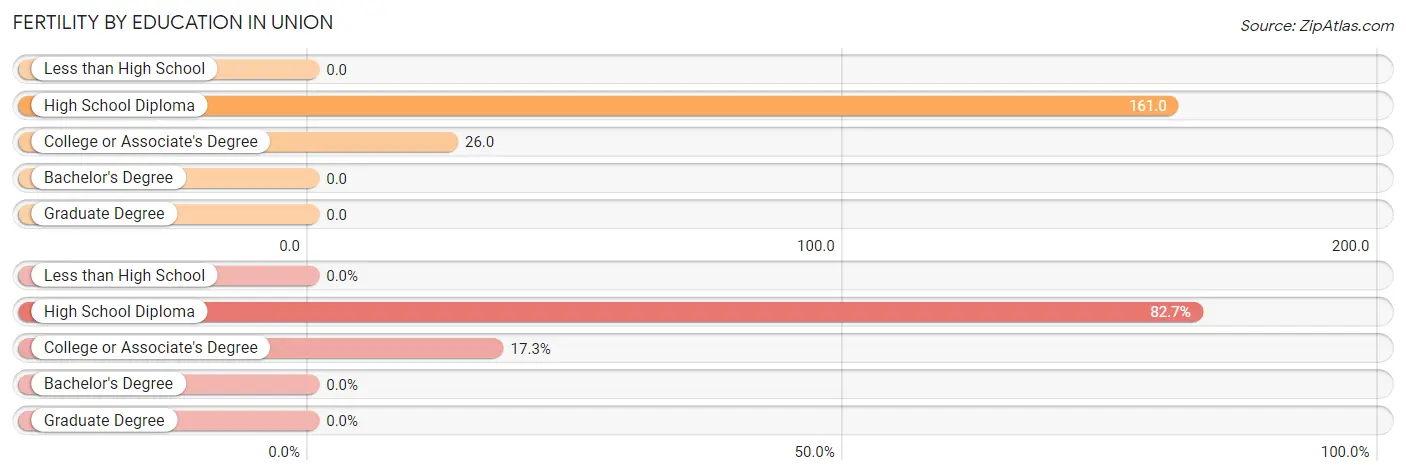
| Educational Attainment | Women with Births | Births / 1,000 Women |
| Less than High School | 0 (0.0%) | 0.0 |
| High School Diploma | 91 (82.7%) | 161.0 |
| College or Associate's Degree | 19 (17.3%) | 26.0 |
| Bachelor's Degree | 0 (0.0%) | 0.0 |
| Graduate Degree | 0 (0.0%) | 0.0 |
| Total | 110 (100.0%) | 56.0 |
Fertility by Education by Marriage Status in Union
60.9% of women with births in Union are unmarried. Women with the educational attainment of high school diploma are most likely to be married with 47.2% of them married at childbirth, while women with the educational attainment of college or associate's degree are least likely to be married with 100.0% of them unmarried at childbirth.
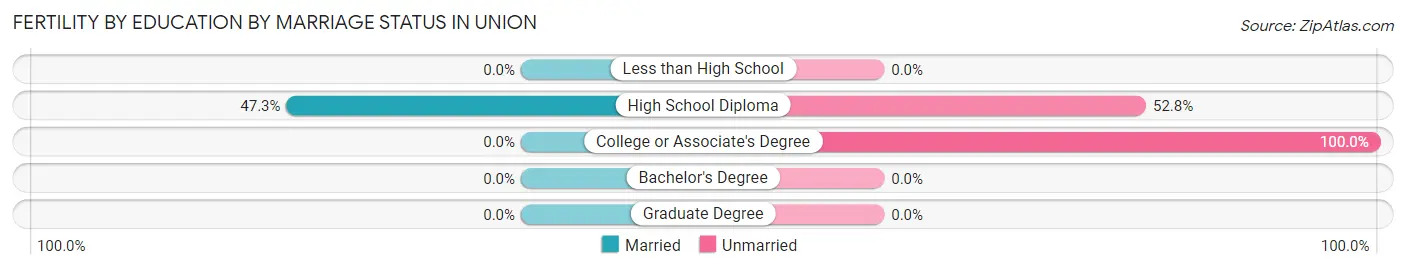
| Educational Attainment | Married | Unmarried |
| Less than High School | 0 (0.0%) | 0 (0.0%) |
| High School Diploma | 43 (47.2%) | 48 (52.7%) |
| College or Associate's Degree | 0 (0.0%) | 19 (100.0%) |
| Bachelor's Degree | 0 (0.0%) | 0 (0.0%) |
| Graduate Degree | 0 (0.0%) | 0 (0.0%) |
| Total | 43 (39.1%) | 67 (60.9%) |
Employment Characteristics in Union
Employment by Class of Employer in Union
Among the 3,020 employed individuals in Union, private company employees (2,220 | 73.5%), not-for-profit organizations (217 | 7.2%), and local government employees (184 | 6.1%) make up the most common classes of employment.
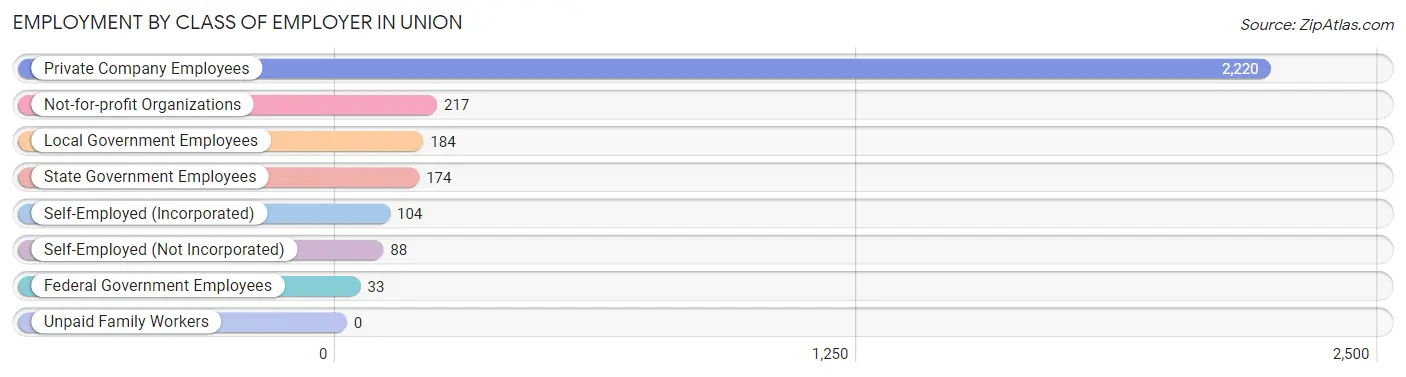
| Employer Class | # Employees | % Employees |
| Private Company Employees | 2,220 | 73.5% |
| Self-Employed (Incorporated) | 104 | 3.4% |
| Self-Employed (Not Incorporated) | 88 | 2.9% |
| Not-for-profit Organizations | 217 | 7.2% |
| Local Government Employees | 184 | 6.1% |
| State Government Employees | 174 | 5.8% |
| Federal Government Employees | 33 | 1.1% |
| Unpaid Family Workers | 0 | 0.0% |
| Total | 3,020 | 100.0% |
Employment Status by Age in Union
According to the labor force statistics for Union, out of the total population over 16 years of age (6,687), 55.7% or 3,725 individuals are in the labor force, with 15.3% or 570 of them unemployed. The age group with the highest labor force participation rate is 30 to 34 years, with 88.2% or 441 individuals in the labor force. Within the labor force, the 25 to 29 years age range has the highest percentage of unemployed individuals, with 37.9% or 154 of them being unemployed.
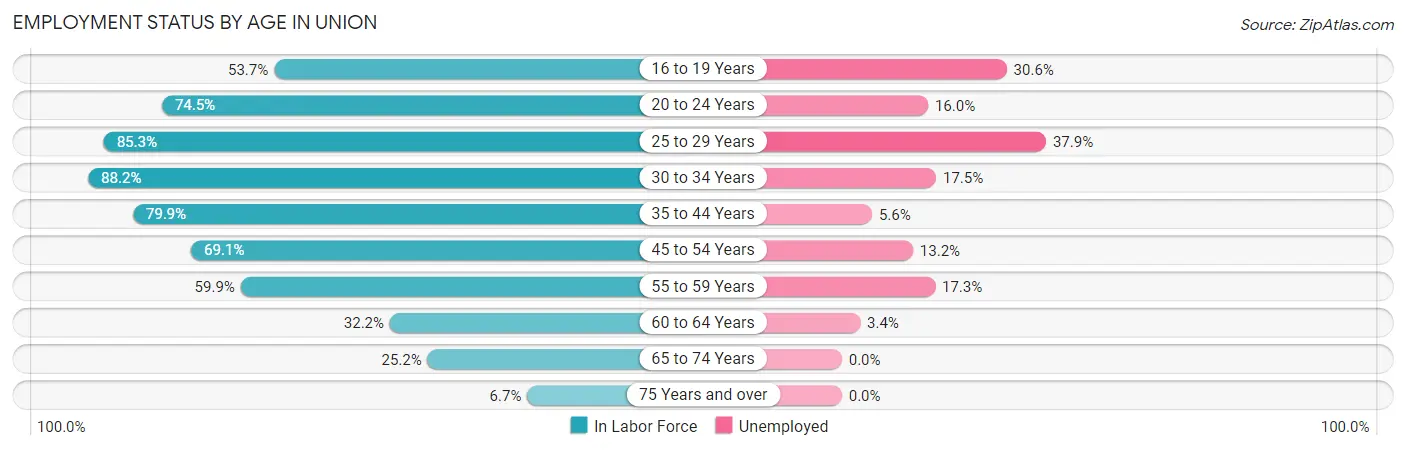
| Age Bracket | In Labor Force | Unemployed |
| 16 to 19 Years | 160 (53.7%) | 49 (30.6%) |
| 20 to 24 Years | 374 (74.5%) | 60 (16.0%) |
| 25 to 29 Years | 406 (85.3%) | 154 (37.9%) |
| 30 to 34 Years | 441 (88.2%) | 77 (17.5%) |
| 35 to 44 Years | 572 (79.9%) | 32 (5.6%) |
| 45 to 54 Years | 927 (69.1%) | 122 (13.2%) |
| 55 to 59 Years | 404 (59.9%) | 70 (17.3%) |
| 60 to 64 Years | 147 (32.2%) | 5 (3.4%) |
| 65 to 74 Years | 243 (25.2%) | 0 (0.0%) |
| 75 Years and over | 51 (6.7%) | 0 (0.0%) |
| Total | 3,725 (55.7%) | 570 (15.3%) |
Employment Status by Educational Attainment in Union
According to labor force statistics for Union, 69.6% of individuals (2,897) out of the total population between 25 and 64 years of age (4,163) are in the labor force, with 15.9% or 461 of them being unemployed. The group with the highest labor force participation rate are those with the educational attainment of bachelor's degree or higher, with 82.6% or 569 individuals in the labor force. Within the labor force, individuals with high school diploma education have the highest percentage of unemployment, with 23.6% or 237 of them being unemployed.
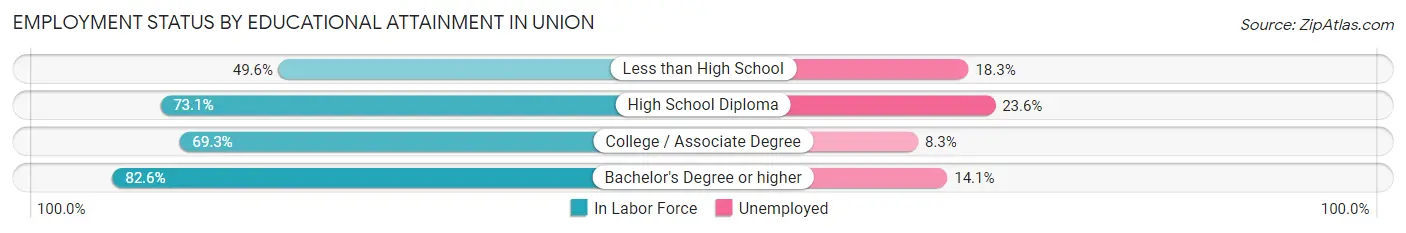
| Educational Attainment | In Labor Force | Unemployed |
| Less than High School | 334 (49.6%) | 123 (18.3%) |
| High School Diploma | 1,004 (73.1%) | 324 (23.6%) |
| College / Associate Degree | 990 (69.3%) | 119 (8.3%) |
| Bachelor's Degree or higher | 569 (82.6%) | 97 (14.1%) |
| Total | 2,897 (69.6%) | 662 (15.9%) |
Employment Occupations by Sex in Union
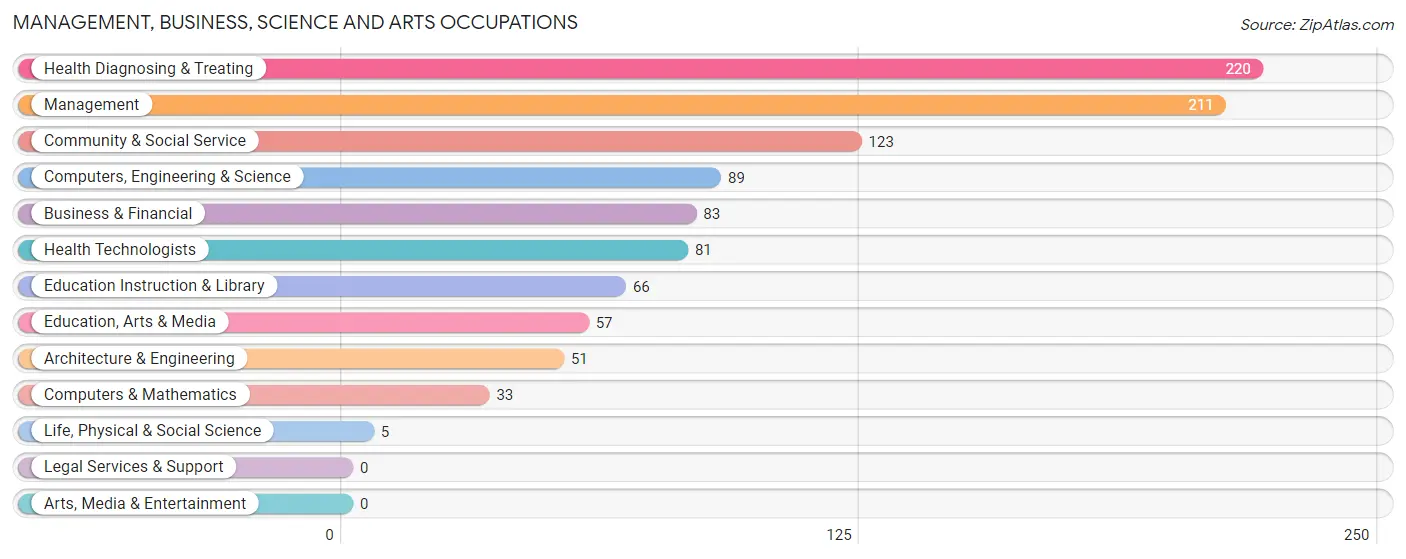
Management, Business, Science and Arts Occupations
The most common Management, Business, Science and Arts occupations in Union are Health Diagnosing & Treating (220 | 7.0%), Management (211 | 6.7%), Community & Social Service (123 | 3.9%), Computers, Engineering & Science (89 | 2.8%), and Business & Financial (83 | 2.6%).
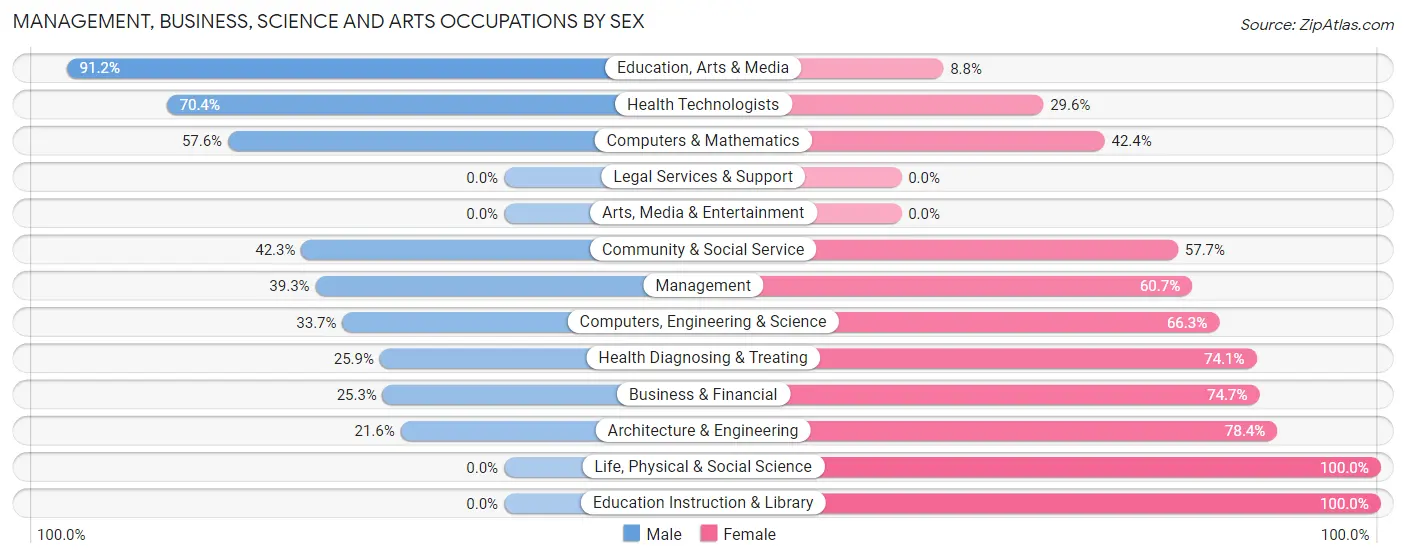
Management, Business, Science and Arts Occupations by Sex
Within the Management, Business, Science and Arts occupations in Union, the most male-oriented occupations are Education, Arts & Media (91.2%), Health Technologists (70.4%), and Computers & Mathematics (57.6%), while the most female-oriented occupations are Life, Physical & Social Science (100.0%), Education Instruction & Library (100.0%), and Architecture & Engineering (78.4%).
| Occupation | Male | Female |
| Management | 83 (39.3%) | 128 (60.7%) |
| Business & Financial | 21 (25.3%) | 62 (74.7%) |
| Computers, Engineering & Science | 30 (33.7%) | 59 (66.3%) |
| Computers & Mathematics | 19 (57.6%) | 14 (42.4%) |
| Architecture & Engineering | 11 (21.6%) | 40 (78.4%) |
| Life, Physical & Social Science | 0 (0.0%) | 5 (100.0%) |
| Community & Social Service | 52 (42.3%) | 71 (57.7%) |
| Education, Arts & Media | 52 (91.2%) | 5 (8.8%) |
| Legal Services & Support | 0 (0.0%) | 0 (0.0%) |
| Education Instruction & Library | 0 (0.0%) | 66 (100.0%) |
| Arts, Media & Entertainment | 0 (0.0%) | 0 (0.0%) |
| Health Diagnosing & Treating | 57 (25.9%) | 163 (74.1%) |
| Health Technologists | 57 (70.4%) | 24 (29.6%) |
| Total (Category) | 243 (33.5%) | 483 (66.5%) |
| Total (Overall) | 1,399 (44.3%) | 1,756 (55.7%) |
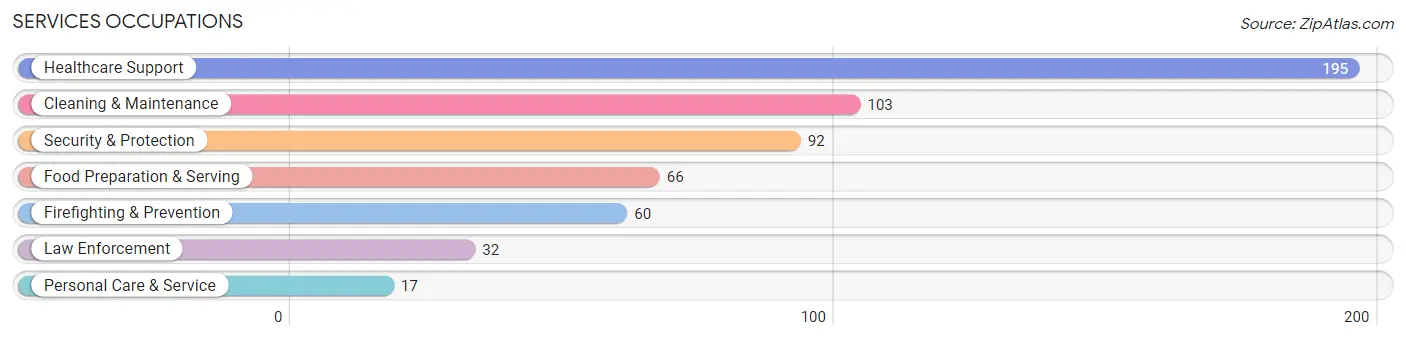
Services Occupations
The most common Services occupations in Union are Healthcare Support (195 | 6.2%), Cleaning & Maintenance (103 | 3.3%), Security & Protection (92 | 2.9%), Food Preparation & Serving (66 | 2.1%), and Firefighting & Prevention (60 | 1.9%).
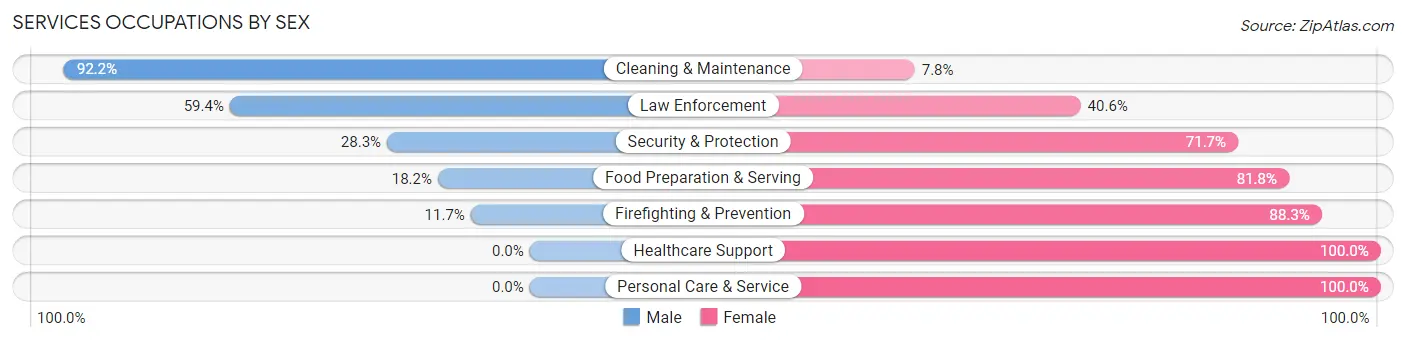
Services Occupations by Sex
Within the Services occupations in Union, the most male-oriented occupations are Cleaning & Maintenance (92.2%), Law Enforcement (59.4%), and Security & Protection (28.3%), while the most female-oriented occupations are Healthcare Support (100.0%), Personal Care & Service (100.0%), and Firefighting & Prevention (88.3%).
| Occupation | Male | Female |
| Healthcare Support | 0 (0.0%) | 195 (100.0%) |
| Security & Protection | 26 (28.3%) | 66 (71.7%) |
| Firefighting & Prevention | 7 (11.7%) | 53 (88.3%) |
| Law Enforcement | 19 (59.4%) | 13 (40.6%) |
| Food Preparation & Serving | 12 (18.2%) | 54 (81.8%) |
| Cleaning & Maintenance | 95 (92.2%) | 8 (7.8%) |
| Personal Care & Service | 0 (0.0%) | 17 (100.0%) |
| Total (Category) | 133 (28.1%) | 340 (71.9%) |
| Total (Overall) | 1,399 (44.3%) | 1,756 (55.7%) |
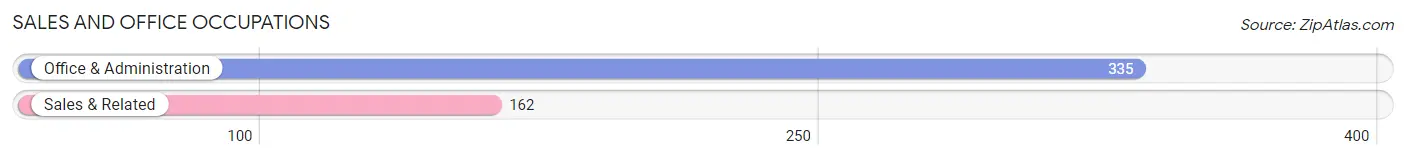
Sales and Office Occupations
The most common Sales and Office occupations in Union are Office & Administration (335 | 10.6%), and Sales & Related (162 | 5.1%).
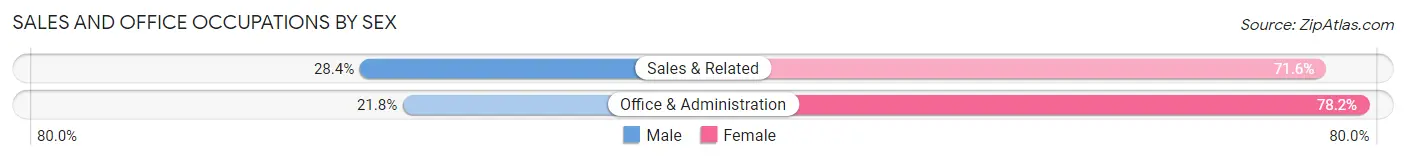
Sales and Office Occupations by Sex
| Occupation | Male | Female |
| Sales & Related | 46 (28.4%) | 116 (71.6%) |
| Office & Administration | 73 (21.8%) | 262 (78.2%) |
| Total (Category) | 119 (23.9%) | 378 (76.1%) |
| Total (Overall) | 1,399 (44.3%) | 1,756 (55.7%) |
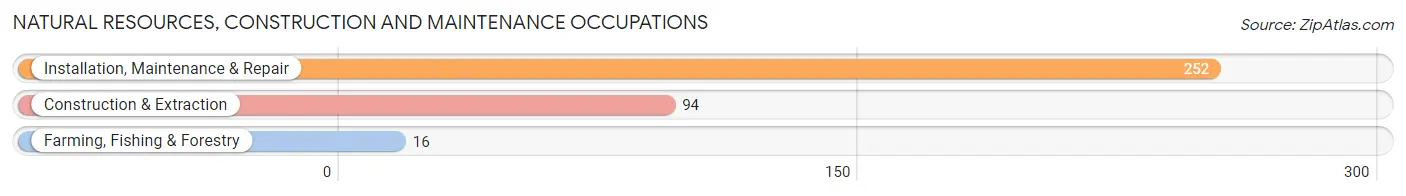
Natural Resources, Construction and Maintenance Occupations
The most common Natural Resources, Construction and Maintenance occupations in Union are Installation, Maintenance & Repair (252 | 8.0%), Construction & Extraction (94 | 3.0%), and Farming, Fishing & Forestry (16 | 0.5%).
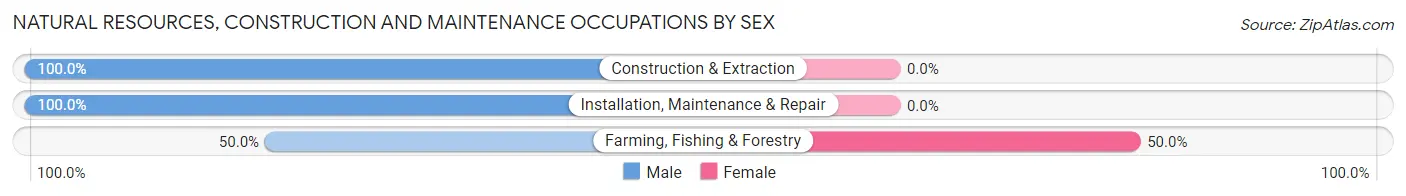
Natural Resources, Construction and Maintenance Occupations by Sex
| Occupation | Male | Female |
| Farming, Fishing & Forestry | 8 (50.0%) | 8 (50.0%) |
| Construction & Extraction | 94 (100.0%) | 0 (0.0%) |
| Installation, Maintenance & Repair | 252 (100.0%) | 0 (0.0%) |
| Total (Category) | 354 (97.8%) | 8 (2.2%) |
| Total (Overall) | 1,399 (44.3%) | 1,756 (55.7%) |
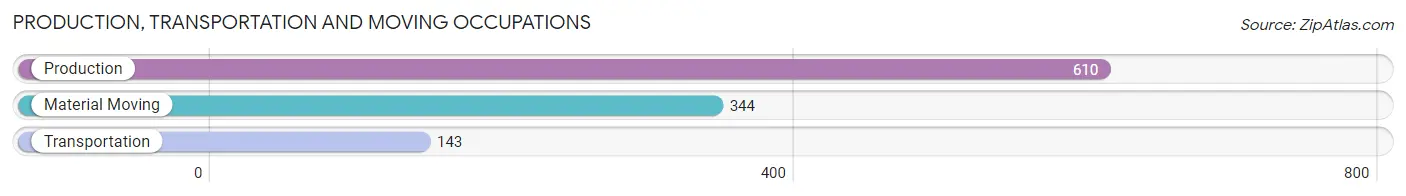
Production, Transportation and Moving Occupations
The most common Production, Transportation and Moving occupations in Union are Production (610 | 19.3%), Material Moving (344 | 10.9%), and Transportation (143 | 4.5%).
Production, Transportation and Moving Occupations by Sex
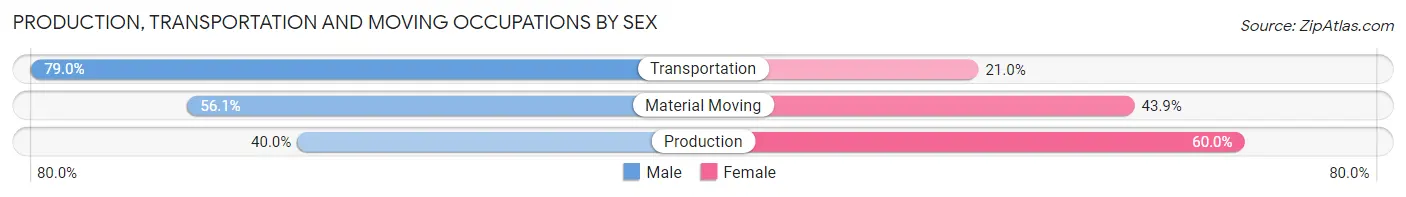
| Occupation | Male | Female |
| Production | 244 (40.0%) | 366 (60.0%) |
| Transportation | 113 (79.0%) | 30 (21.0%) |
| Material Moving | 193 (56.1%) | 151 (43.9%) |
| Total (Category) | 550 (50.1%) | 547 (49.9%) |
| Total (Overall) | 1,399 (44.3%) | 1,756 (55.7%) |
Employment Industries by Sex in Union
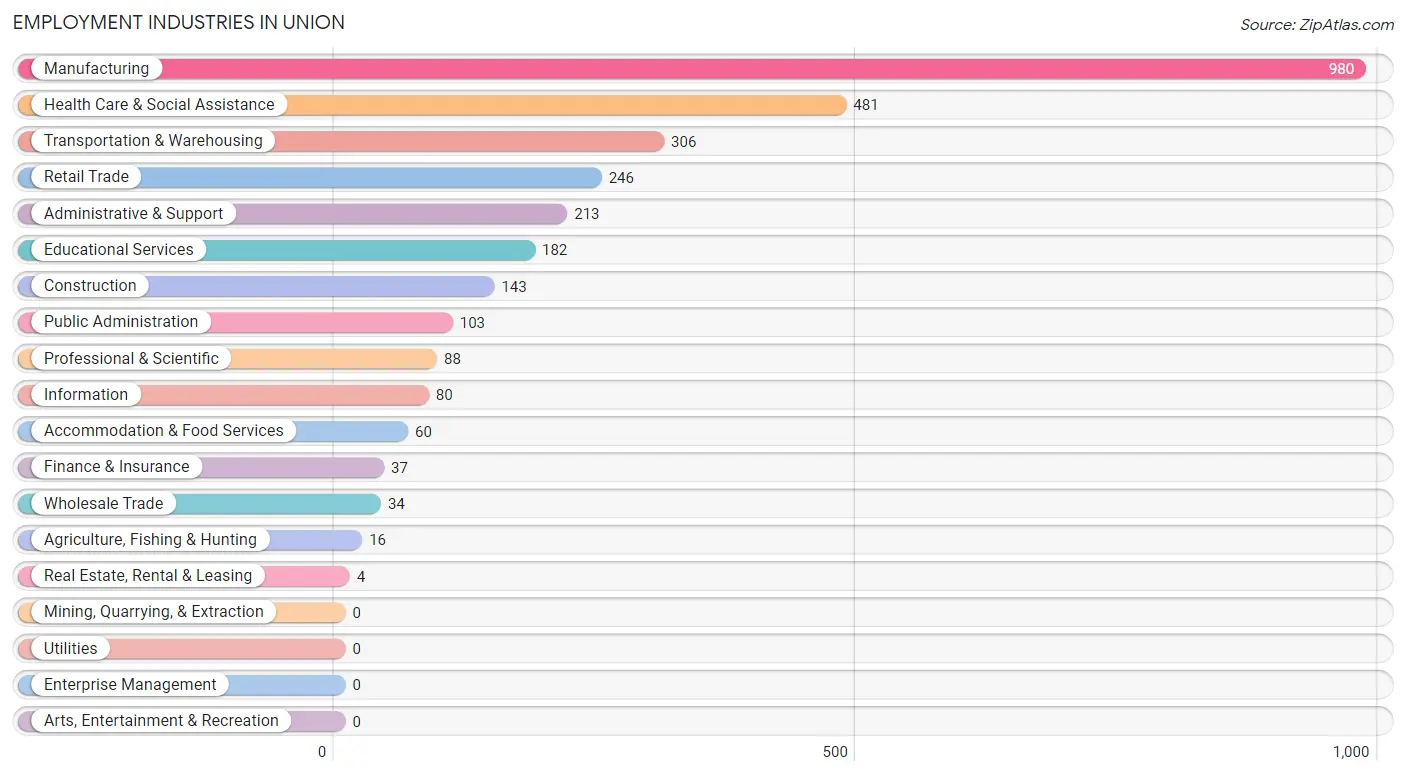
Employment Industries in Union
The major employment industries in Union include Manufacturing (980 | 31.1%), Health Care & Social Assistance (481 | 15.2%), Transportation & Warehousing (306 | 9.7%), Retail Trade (246 | 7.8%), and Administrative & Support (213 | 6.8%).
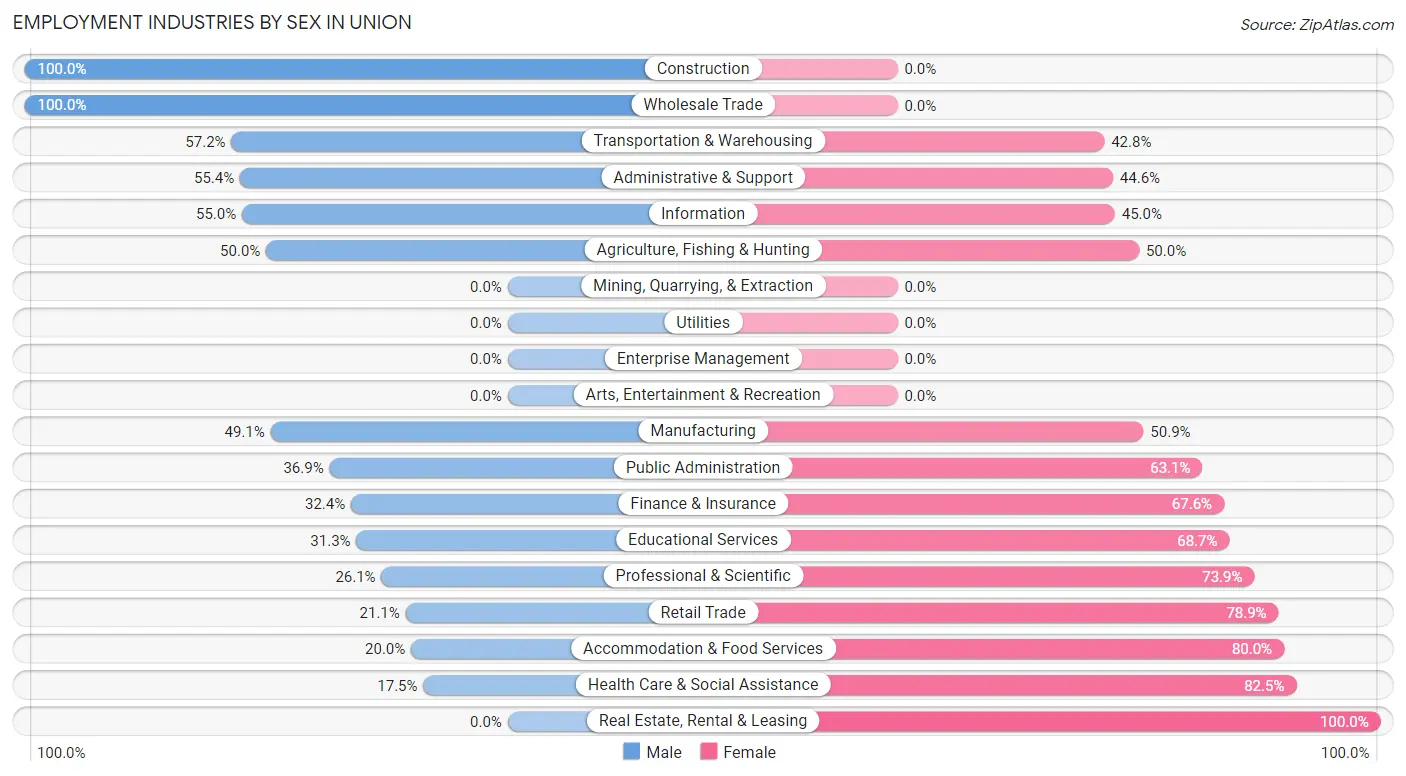
Employment Industries by Sex in Union
The Union industries that see more men than women are Construction (100.0%), Wholesale Trade (100.0%), and Transportation & Warehousing (57.2%), whereas the industries that tend to have a higher number of women are Real Estate, Rental & Leasing (100.0%), Health Care & Social Assistance (82.5%), and Accommodation & Food Services (80.0%).
| Industry | Male | Female |
| Agriculture, Fishing & Hunting | 8 (50.0%) | 8 (50.0%) |
| Mining, Quarrying, & Extraction | 0 (0.0%) | 0 (0.0%) |
| Construction | 143 (100.0%) | 0 (0.0%) |
| Manufacturing | 481 (49.1%) | 499 (50.9%) |
| Wholesale Trade | 34 (100.0%) | 0 (0.0%) |
| Retail Trade | 52 (21.1%) | 194 (78.9%) |
| Transportation & Warehousing | 175 (57.2%) | 131 (42.8%) |
| Utilities | 0 (0.0%) | 0 (0.0%) |
| Information | 44 (55.0%) | 36 (45.0%) |
| Finance & Insurance | 12 (32.4%) | 25 (67.6%) |
| Real Estate, Rental & Leasing | 0 (0.0%) | 4 (100.0%) |
| Professional & Scientific | 23 (26.1%) | 65 (73.9%) |
| Enterprise Management | 0 (0.0%) | 0 (0.0%) |
| Administrative & Support | 118 (55.4%) | 95 (44.6%) |
| Educational Services | 57 (31.3%) | 125 (68.7%) |
| Health Care & Social Assistance | 84 (17.5%) | 397 (82.5%) |
| Arts, Entertainment & Recreation | 0 (0.0%) | 0 (0.0%) |
| Accommodation & Food Services | 12 (20.0%) | 48 (80.0%) |
| Public Administration | 38 (36.9%) | 65 (63.1%) |
| Total | 1,399 (44.3%) | 1,756 (55.7%) |
Education in Union
School Enrollment in Union
The most common levels of schooling among the 1,414 students in Union are high school (344 | 24.3%), elementary school (336 | 23.8%), and middle school (253 | 17.9%).
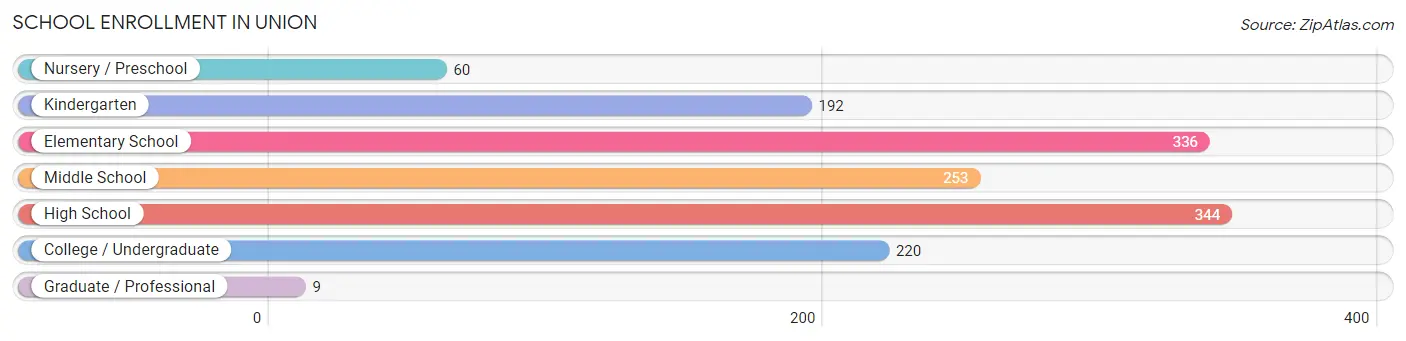
| School Level | # Students | % Students |
| Nursery / Preschool | 60 | 4.2% |
| Kindergarten | 192 | 13.6% |
| Elementary School | 336 | 23.8% |
| Middle School | 253 | 17.9% |
| High School | 344 | 24.3% |
| College / Undergraduate | 220 | 15.6% |
| Graduate / Professional | 9 | 0.6% |
| Total | 1,414 | 100.0% |
School Enrollment by Age by Funding Source in Union
Out of a total of 1,414 students who are enrolled in schools in Union, 48 (3.4%) attend a private institution, while the remaining 1,366 (96.6%) are enrolled in public schools. The age group of 18 to 19 year olds has the highest likelihood of being enrolled in private schools, with 25 (17.4% in the age bracket) enrolled. Conversely, the age group of 5 to 9 year old has the lowest likelihood of being enrolled in a private school, with 456 (100.0% in the age bracket) attending a public institution.
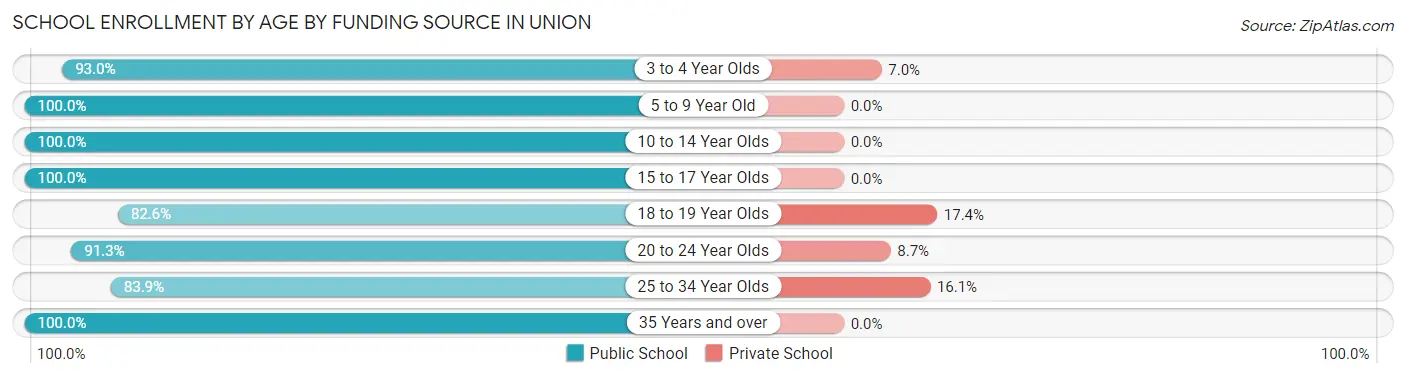
| Age Bracket | Public School | Private School |
| 3 to 4 Year Olds | 106 (93.0%) | 8 (7.0%) |
| 5 to 9 Year Old | 456 (100.0%) | 0 (0.0%) |
| 10 to 14 Year Olds | 327 (100.0%) | 0 (0.0%) |
| 15 to 17 Year Olds | 204 (100.0%) | 0 (0.0%) |
| 18 to 19 Year Olds | 119 (82.6%) | 25 (17.4%) |
| 20 to 24 Year Olds | 63 (91.3%) | 6 (8.7%) |
| 25 to 34 Year Olds | 47 (83.9%) | 9 (16.1%) |
| 35 Years and over | 44 (100.0%) | 0 (0.0%) |
| Total | 1,366 (96.6%) | 48 (3.4%) |
Educational Attainment by Field of Study in Union
Education (188 | 17.8%), business (177 | 16.8%), science & technology (127 | 12.0%), social sciences (106 | 10.0%), and engineering (100 | 9.5%) are the most common fields of study among 1,057 individuals in Union who have obtained a bachelor's degree or higher.
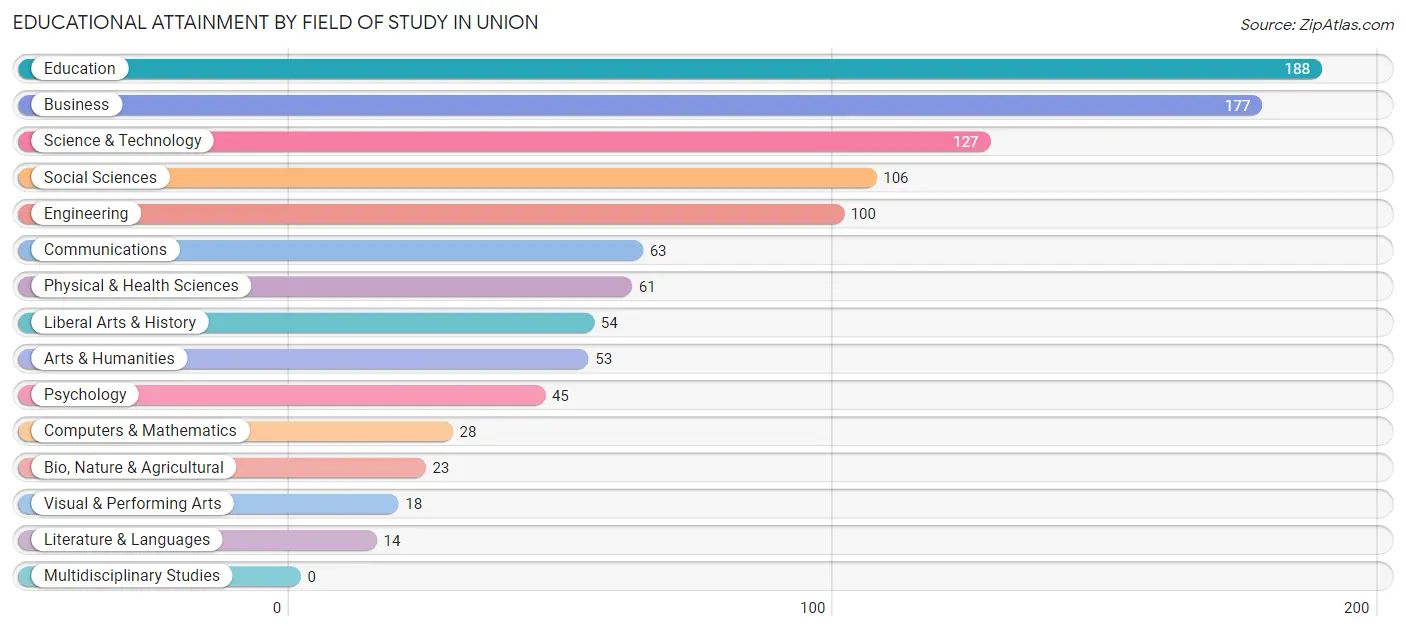
| Field of Study | # Graduates | % Graduates |
| Computers & Mathematics | 28 | 2.6% |
| Bio, Nature & Agricultural | 23 | 2.2% |
| Physical & Health Sciences | 61 | 5.8% |
| Psychology | 45 | 4.3% |
| Social Sciences | 106 | 10.0% |
| Engineering | 100 | 9.5% |
| Multidisciplinary Studies | 0 | 0.0% |
| Science & Technology | 127 | 12.0% |
| Business | 177 | 16.8% |
| Education | 188 | 17.8% |
| Literature & Languages | 14 | 1.3% |
| Liberal Arts & History | 54 | 5.1% |
| Visual & Performing Arts | 18 | 1.7% |
| Communications | 63 | 6.0% |
| Arts & Humanities | 53 | 5.0% |
| Total | 1,057 | 100.0% |
Transportation & Commute in Union
Vehicle Availability by Sex in Union
The most prevalent vehicle ownership categories in Union are males with 2 vehicles (528, accounting for 39.9%) and females with 2 vehicles (697, making up 31.1%).
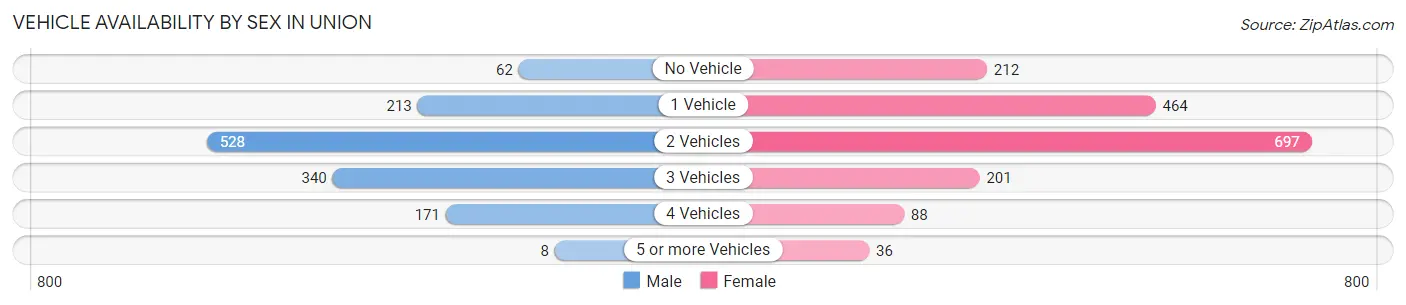
| Vehicles Available | Male | Female |
| No Vehicle | 62 (4.7%) | 212 (12.5%) |
| 1 Vehicle | 213 (16.1%) | 464 (27.3%) |
| 2 Vehicles | 528 (39.9%) | 697 (41.0%) |
| 3 Vehicles | 340 (25.7%) | 201 (11.8%) |
| 4 Vehicles | 171 (12.9%) | 88 (5.2%) |
| 5 or more Vehicles | 8 (0.6%) | 36 (2.1%) |
| Total | 1,322 (100.0%) | 1,698 (100.0%) |
Commute Time in Union
The most frequently occuring commute durations in Union are 5 to 9 minutes (612 commuters, 20.5%), 10 to 14 minutes (546 commuters, 18.2%), and 45 to 59 minutes (498 commuters, 16.7%).
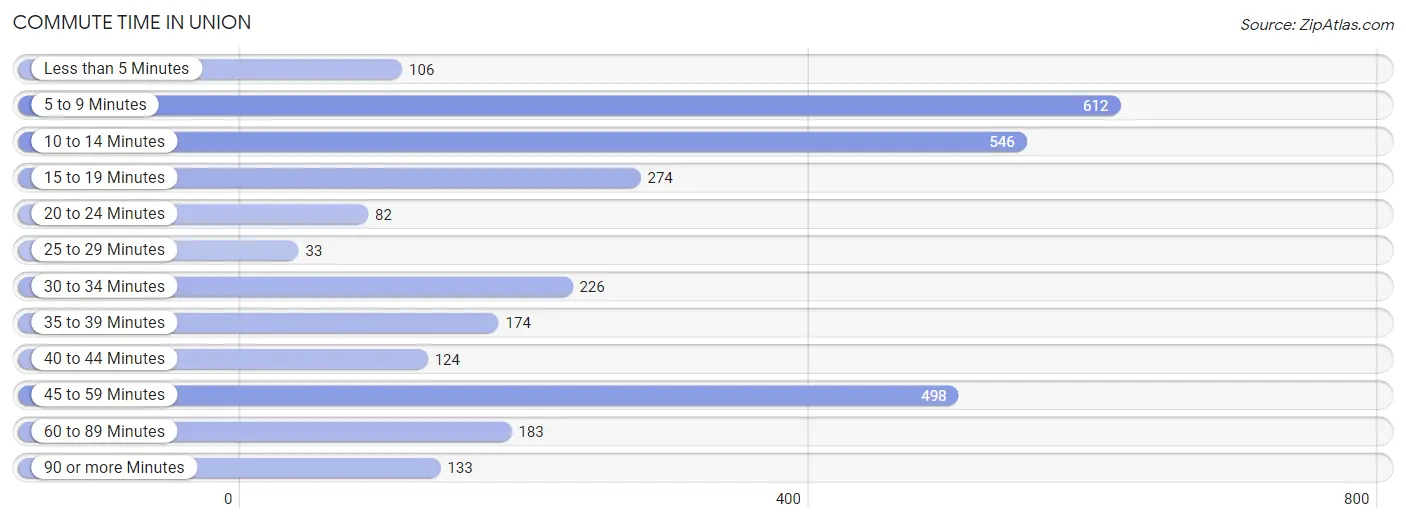
| Commute Time | # Commuters | % Commuters |
| Less than 5 Minutes | 106 | 3.5% |
| 5 to 9 Minutes | 612 | 20.5% |
| 10 to 14 Minutes | 546 | 18.2% |
| 15 to 19 Minutes | 274 | 9.2% |
| 20 to 24 Minutes | 82 | 2.7% |
| 25 to 29 Minutes | 33 | 1.1% |
| 30 to 34 Minutes | 226 | 7.6% |
| 35 to 39 Minutes | 174 | 5.8% |
| 40 to 44 Minutes | 124 | 4.2% |
| 45 to 59 Minutes | 498 | 16.7% |
| 60 to 89 Minutes | 183 | 6.1% |
| 90 or more Minutes | 133 | 4.4% |
Commute Time by Sex in Union
The most common commute times in Union are 10 to 14 minutes (312 commuters, 23.7%) for males and 5 to 9 minutes (429 commuters, 25.6%) for females.
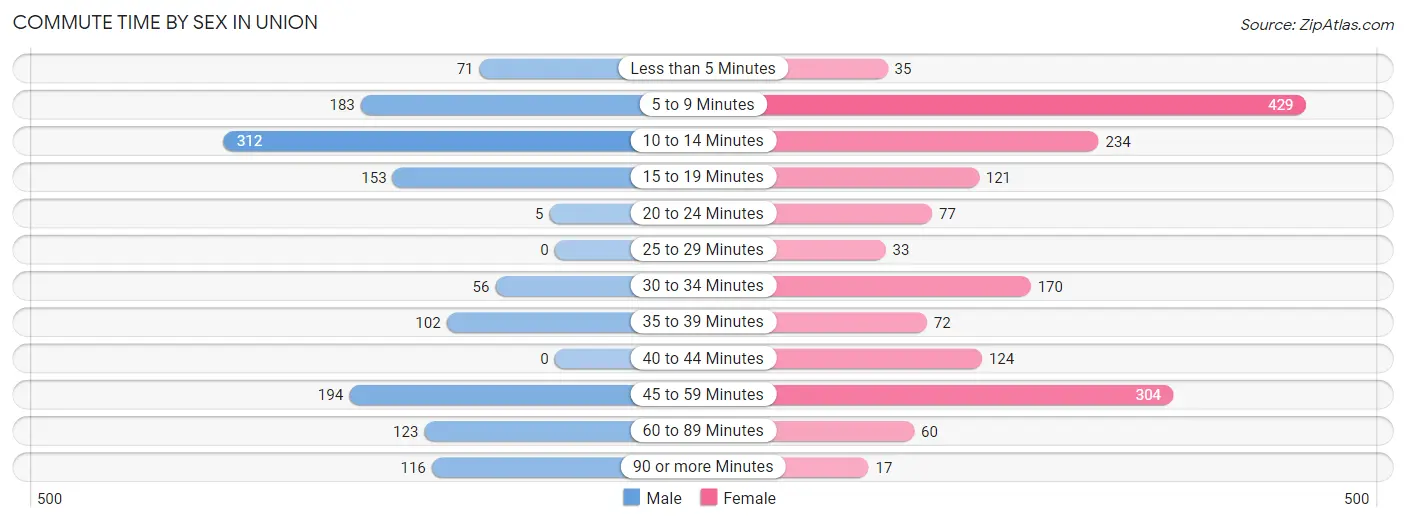
| Commute Time | Male | Female |
| Less than 5 Minutes | 71 (5.4%) | 35 (2.1%) |
| 5 to 9 Minutes | 183 (13.9%) | 429 (25.6%) |
| 10 to 14 Minutes | 312 (23.7%) | 234 (14.0%) |
| 15 to 19 Minutes | 153 (11.6%) | 121 (7.2%) |
| 20 to 24 Minutes | 5 (0.4%) | 77 (4.6%) |
| 25 to 29 Minutes | 0 (0.0%) | 33 (2.0%) |
| 30 to 34 Minutes | 56 (4.3%) | 170 (10.1%) |
| 35 to 39 Minutes | 102 (7.8%) | 72 (4.3%) |
| 40 to 44 Minutes | 0 (0.0%) | 124 (7.4%) |
| 45 to 59 Minutes | 194 (14.7%) | 304 (18.1%) |
| 60 to 89 Minutes | 123 (9.3%) | 60 (3.6%) |
| 90 or more Minutes | 116 (8.8%) | 17 (1.0%) |
Time of Departure to Work by Sex in Union
The most frequent times of departure to work in Union are 4:00 PM to 11:59 PM (223, 17.0%) for males and 4:00 PM to 11:59 PM (306, 18.3%) for females.
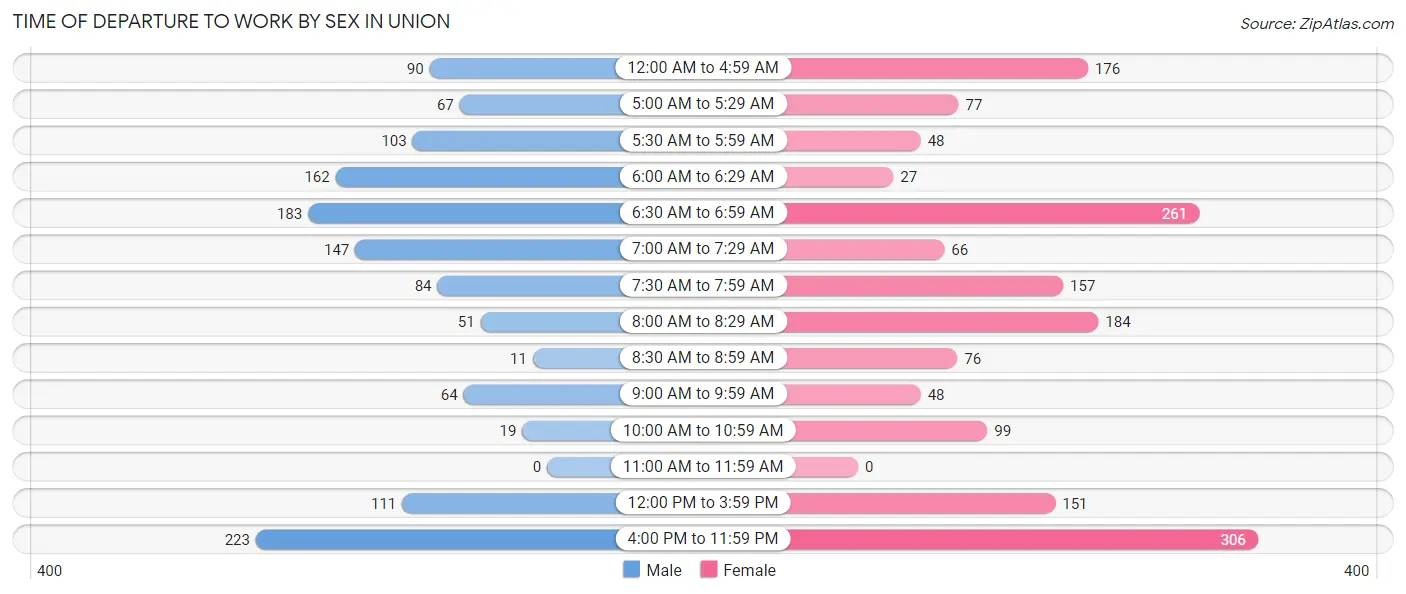
| Time of Departure | Male | Female |
| 12:00 AM to 4:59 AM | 90 (6.8%) | 176 (10.5%) |
| 5:00 AM to 5:29 AM | 67 (5.1%) | 77 (4.6%) |
| 5:30 AM to 5:59 AM | 103 (7.8%) | 48 (2.9%) |
| 6:00 AM to 6:29 AM | 162 (12.3%) | 27 (1.6%) |
| 6:30 AM to 6:59 AM | 183 (13.9%) | 261 (15.6%) |
| 7:00 AM to 7:29 AM | 147 (11.2%) | 66 (3.9%) |
| 7:30 AM to 7:59 AM | 84 (6.4%) | 157 (9.4%) |
| 8:00 AM to 8:29 AM | 51 (3.9%) | 184 (11.0%) |
| 8:30 AM to 8:59 AM | 11 (0.8%) | 76 (4.5%) |
| 9:00 AM to 9:59 AM | 64 (4.9%) | 48 (2.9%) |
| 10:00 AM to 10:59 AM | 19 (1.4%) | 99 (5.9%) |
| 11:00 AM to 11:59 AM | 0 (0.0%) | 0 (0.0%) |
| 12:00 PM to 3:59 PM | 111 (8.4%) | 151 (9.0%) |
| 4:00 PM to 11:59 PM | 223 (17.0%) | 306 (18.3%) |
| Total | 1,315 (100.0%) | 1,676 (100.0%) |
Housing Occupancy in Union
Occupancy by Ownership in Union
Of the total 3,793 dwellings in Union, owner-occupied units account for 1,816 (47.9%), while renter-occupied units make up 1,977 (52.1%).
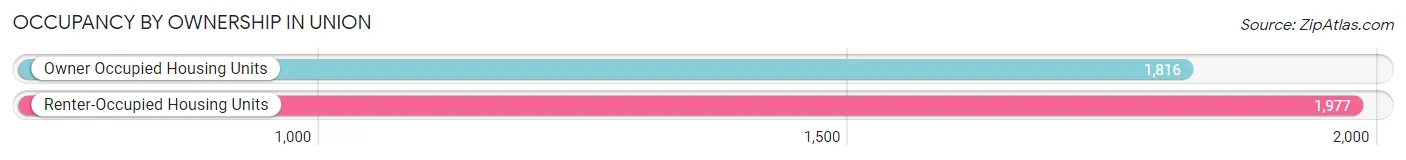
| Occupancy | # Housing Units | % Housing Units |
| Owner Occupied Housing Units | 1,816 | 47.9% |
| Renter-Occupied Housing Units | 1,977 | 52.1% |
| Total Occupied Housing Units | 3,793 | 100.0% |
Occupancy by Household Size in Union
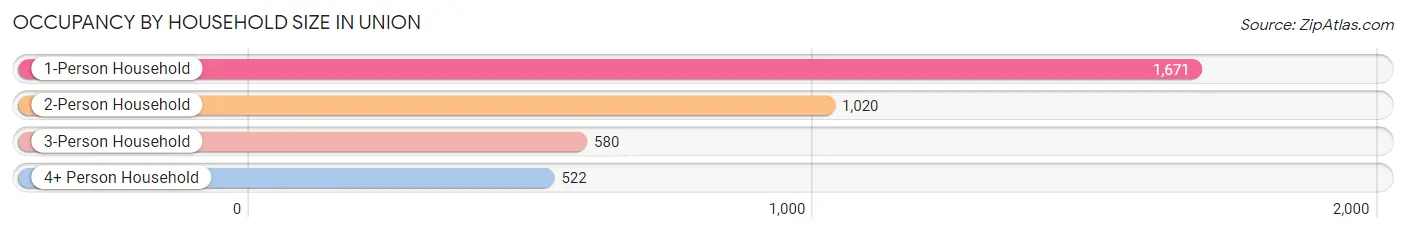
| Household Size | # Housing Units | % Housing Units |
| 1-Person Household | 1,671 | 44.1% |
| 2-Person Household | 1,020 | 26.9% |
| 3-Person Household | 580 | 15.3% |
| 4+ Person Household | 522 | 13.8% |
| Total Housing Units | 3,793 | 100.0% |
Occupancy by Ownership by Household Size in Union
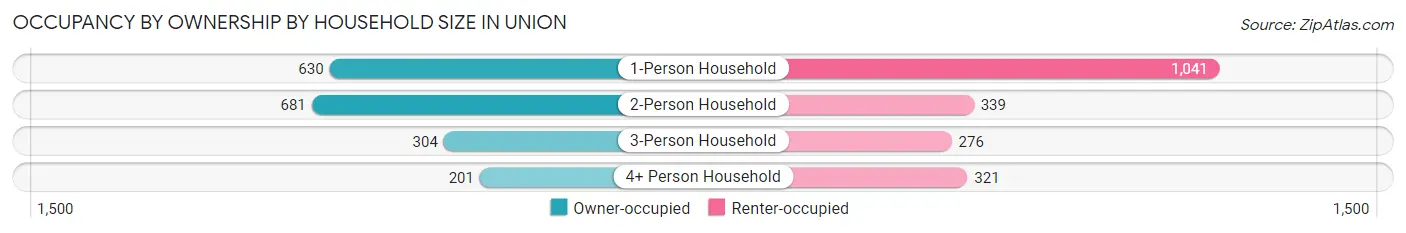
| Household Size | Owner-occupied | Renter-occupied |
| 1-Person Household | 630 (37.7%) | 1,041 (62.3%) |
| 2-Person Household | 681 (66.8%) | 339 (33.2%) |
| 3-Person Household | 304 (52.4%) | 276 (47.6%) |
| 4+ Person Household | 201 (38.5%) | 321 (61.5%) |
| Total Housing Units | 1,816 (47.9%) | 1,977 (52.1%) |
Occupancy by Educational Attainment in Union
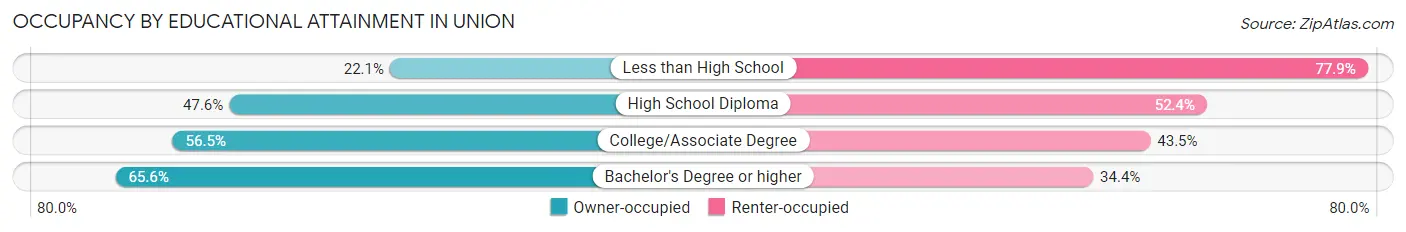
| Household Size | Owner-occupied | Renter-occupied |
| Less than High School | 179 (22.1%) | 632 (77.9%) |
| High School Diploma | 536 (47.6%) | 591 (52.4%) |
| College/Associate Degree | 720 (56.5%) | 554 (43.5%) |
| Bachelor's Degree or higher | 381 (65.6%) | 200 (34.4%) |
Occupancy by Age of Householder in Union
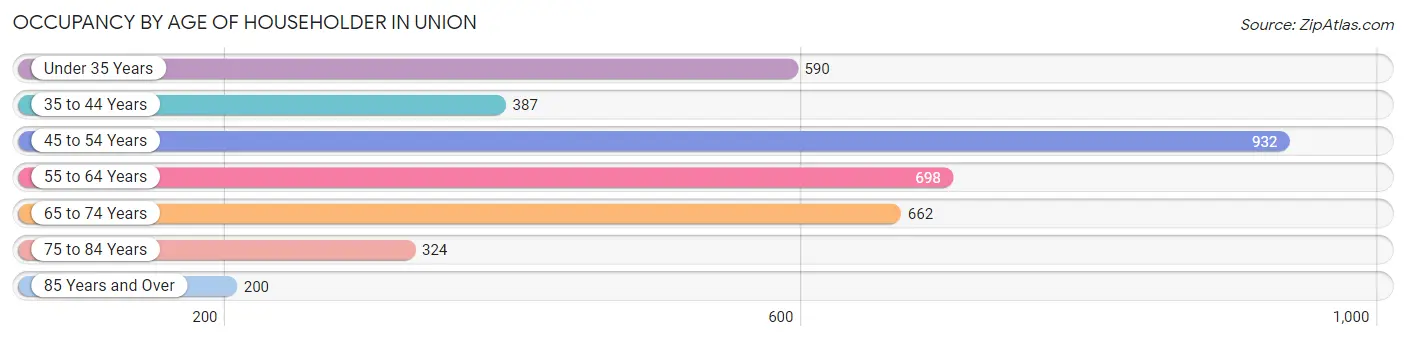
| Age Bracket | # Households | % Households |
| Under 35 Years | 590 | 15.5% |
| 35 to 44 Years | 387 | 10.2% |
| 45 to 54 Years | 932 | 24.6% |
| 55 to 64 Years | 698 | 18.4% |
| 65 to 74 Years | 662 | 17.4% |
| 75 to 84 Years | 324 | 8.5% |
| 85 Years and Over | 200 | 5.3% |
| Total | 3,793 | 100.0% |
Housing Finances in Union
Median Income by Occupancy in Union
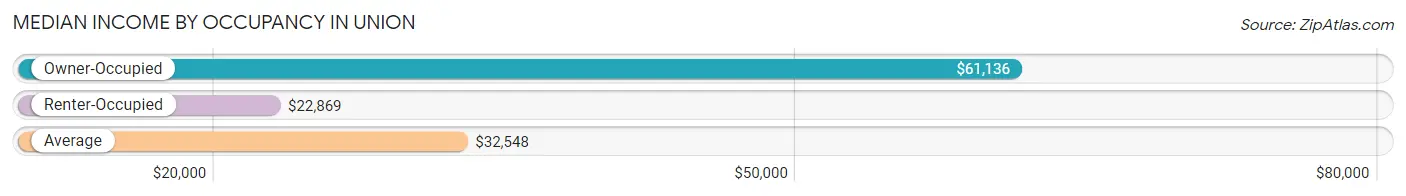
| Occupancy Type | # Households | Median Income |
| Owner-Occupied | 1,816 (47.9%) | $61,136 |
| Renter-Occupied | 1,977 (52.1%) | $22,869 |
| Average | 3,793 (100.0%) | $32,548 |
Occupancy by Householder Income Bracket in Union
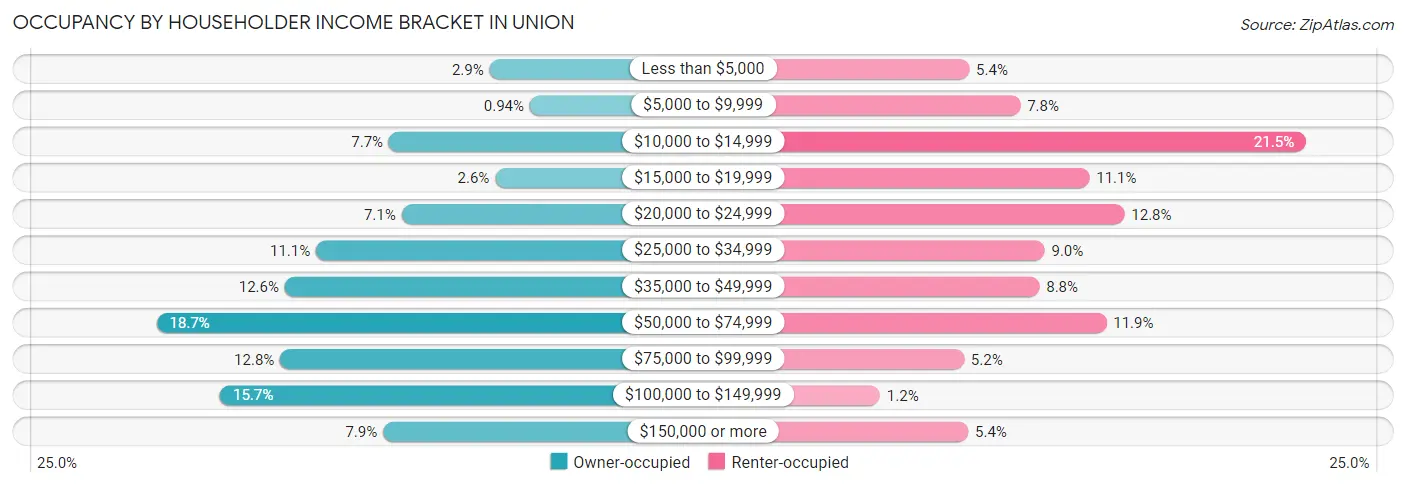
| Income Bracket | Owner-occupied | Renter-occupied |
| Less than $5,000 | 52 (2.9%) | 107 (5.4%) |
| $5,000 to $9,999 | 17 (0.9%) | 155 (7.8%) |
| $10,000 to $14,999 | 139 (7.6%) | 424 (21.4%) |
| $15,000 to $19,999 | 47 (2.6%) | 220 (11.1%) |
| $20,000 to $24,999 | 128 (7.0%) | 253 (12.8%) |
| $25,000 to $34,999 | 202 (11.1%) | 178 (9.0%) |
| $35,000 to $49,999 | 229 (12.6%) | 173 (8.7%) |
| $50,000 to $74,999 | 340 (18.7%) | 236 (11.9%) |
| $75,000 to $99,999 | 233 (12.8%) | 102 (5.2%) |
| $100,000 to $149,999 | 285 (15.7%) | 23 (1.2%) |
| $150,000 or more | 144 (7.9%) | 106 (5.4%) |
| Total | 1,816 (100.0%) | 1,977 (100.0%) |
Monthly Housing Cost Tiers in Union
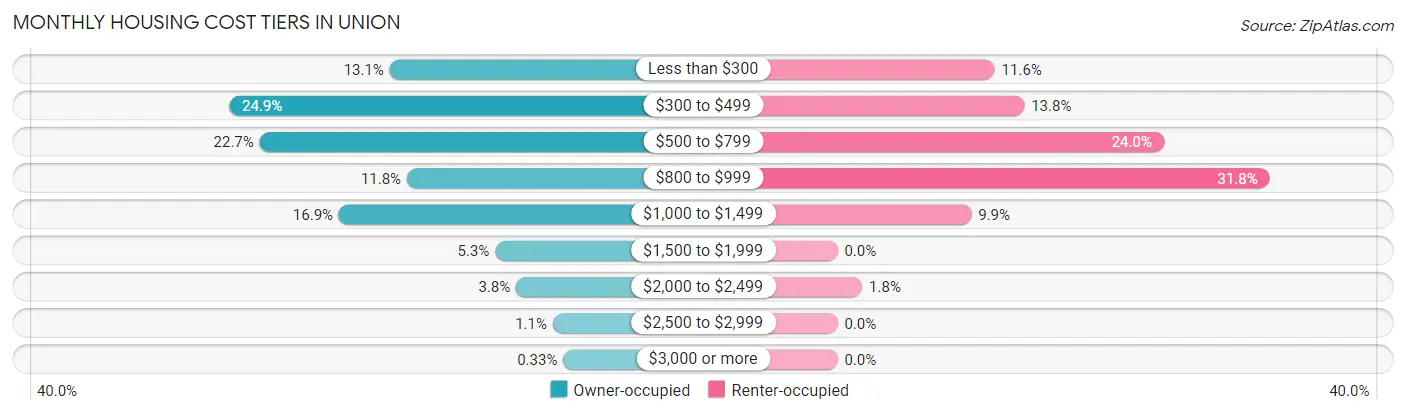
| Monthly Cost | Owner-occupied | Renter-occupied |
| Less than $300 | 238 (13.1%) | 229 (11.6%) |
| $300 to $499 | 453 (24.9%) | 272 (13.8%) |
| $500 to $799 | 412 (22.7%) | 475 (24.0%) |
| $800 to $999 | 215 (11.8%) | 629 (31.8%) |
| $1,000 to $1,499 | 306 (16.9%) | 195 (9.9%) |
| $1,500 to $1,999 | 97 (5.3%) | 0 (0.0%) |
| $2,000 to $2,499 | 69 (3.8%) | 36 (1.8%) |
| $2,500 to $2,999 | 20 (1.1%) | 0 (0.0%) |
| $3,000 or more | 6 (0.3%) | 0 (0.0%) |
| Total | 1,816 (100.0%) | 1,977 (100.0%) |
Physical Housing Characteristics in Union
Housing Structures in Union
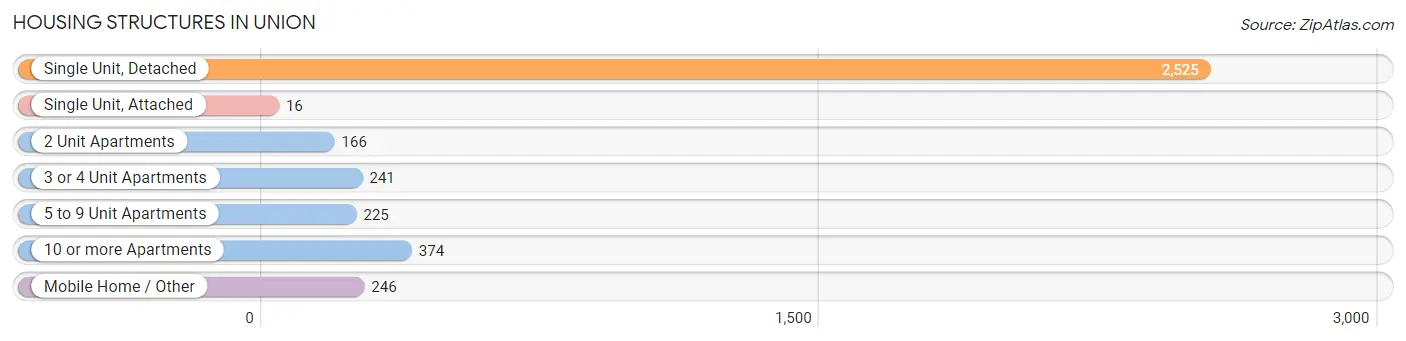
| Structure Type | # Housing Units | % Housing Units |
| Single Unit, Detached | 2,525 | 66.6% |
| Single Unit, Attached | 16 | 0.4% |
| 2 Unit Apartments | 166 | 4.4% |
| 3 or 4 Unit Apartments | 241 | 6.4% |
| 5 to 9 Unit Apartments | 225 | 5.9% |
| 10 or more Apartments | 374 | 9.9% |
| Mobile Home / Other | 246 | 6.5% |
| Total | 3,793 | 100.0% |
Housing Structures by Occupancy in Union
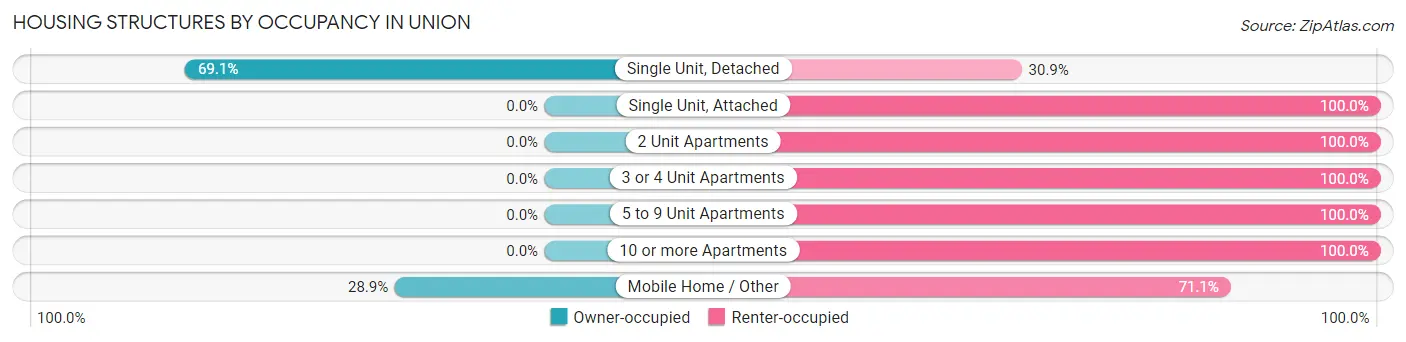
| Structure Type | Owner-occupied | Renter-occupied |
| Single Unit, Detached | 1,745 (69.1%) | 780 (30.9%) |
| Single Unit, Attached | 0 (0.0%) | 16 (100.0%) |
| 2 Unit Apartments | 0 (0.0%) | 166 (100.0%) |
| 3 or 4 Unit Apartments | 0 (0.0%) | 241 (100.0%) |
| 5 to 9 Unit Apartments | 0 (0.0%) | 225 (100.0%) |
| 10 or more Apartments | 0 (0.0%) | 374 (100.0%) |
| Mobile Home / Other | 71 (28.9%) | 175 (71.1%) |
| Total | 1,816 (47.9%) | 1,977 (52.1%) |
Housing Structures by Number of Rooms in Union
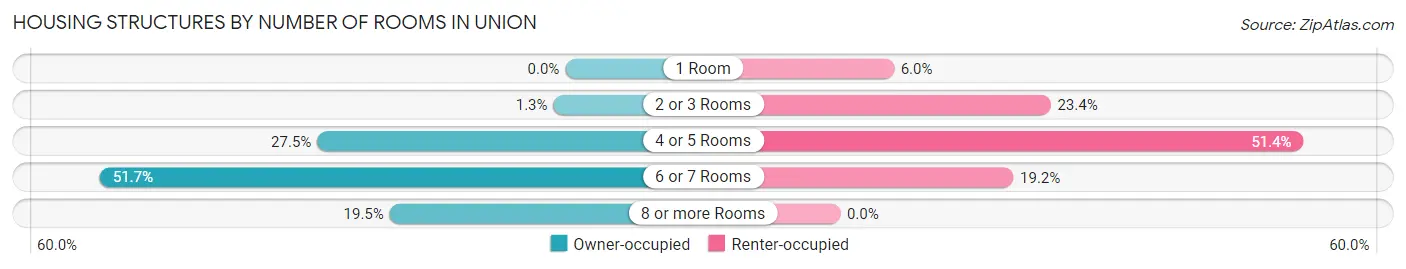
| Number of Rooms | Owner-occupied | Renter-occupied |
| 1 Room | 0 (0.0%) | 118 (6.0%) |
| 2 or 3 Rooms | 24 (1.3%) | 462 (23.4%) |
| 4 or 5 Rooms | 500 (27.5%) | 1,017 (51.4%) |
| 6 or 7 Rooms | 938 (51.6%) | 380 (19.2%) |
| 8 or more Rooms | 354 (19.5%) | 0 (0.0%) |
| Total | 1,816 (100.0%) | 1,977 (100.0%) |
Housing Structure by Heating Type in Union
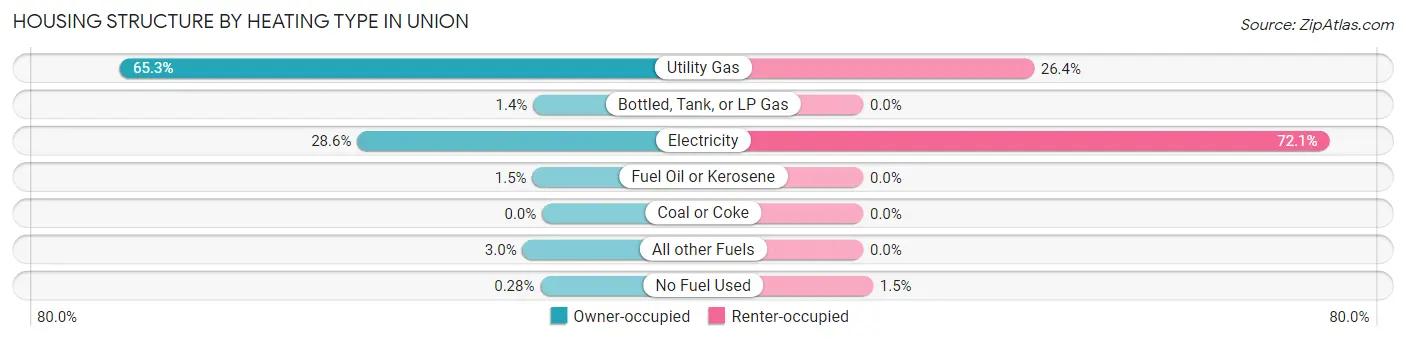
| Heating Type | Owner-occupied | Renter-occupied |
| Utility Gas | 1,185 (65.2%) | 522 (26.4%) |
| Bottled, Tank, or LP Gas | 25 (1.4%) | 0 (0.0%) |
| Electricity | 519 (28.6%) | 1,425 (72.1%) |
| Fuel Oil or Kerosene | 27 (1.5%) | 0 (0.0%) |
| Coal or Coke | 0 (0.0%) | 0 (0.0%) |
| All other Fuels | 55 (3.0%) | 0 (0.0%) |
| No Fuel Used | 5 (0.3%) | 30 (1.5%) |
| Total | 1,816 (100.0%) | 1,977 (100.0%) |
Household Vehicle Usage in Union
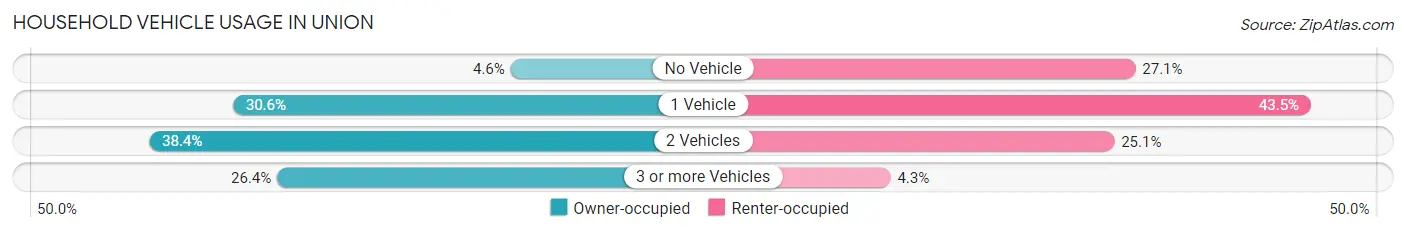
| Vehicles per Household | Owner-occupied | Renter-occupied |
| No Vehicle | 84 (4.6%) | 536 (27.1%) |
| 1 Vehicle | 555 (30.6%) | 860 (43.5%) |
| 2 Vehicles | 697 (38.4%) | 497 (25.1%) |
| 3 or more Vehicles | 480 (26.4%) | 84 (4.3%) |
| Total | 1,816 (100.0%) | 1,977 (100.0%) |
Real Estate & Mortgages in Union
Real Estate and Mortgage Overview in Union
| Characteristic | Without Mortgage | With Mortgage |
| Housing Units | 951 | 865 |
| Median Property Value | $88,000 | $122,100 |
| Median Household Income | $48,173 | $97 |
| Monthly Housing Costs | $408 | $6 |
| Real Estate Taxes | $491 | $97 |
Property Value by Mortgage Status in Union
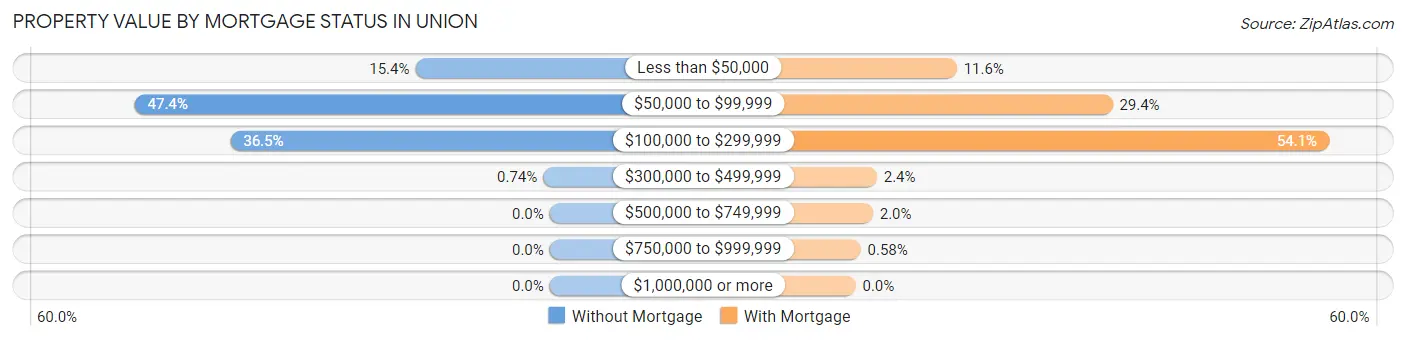
| Property Value | Without Mortgage | With Mortgage |
| Less than $50,000 | 146 (15.3%) | 100 (11.6%) |
| $50,000 to $99,999 | 451 (47.4%) | 254 (29.4%) |
| $100,000 to $299,999 | 347 (36.5%) | 468 (54.1%) |
| $300,000 to $499,999 | 7 (0.7%) | 21 (2.4%) |
| $500,000 to $749,999 | 0 (0.0%) | 17 (2.0%) |
| $750,000 to $999,999 | 0 (0.0%) | 5 (0.6%) |
| $1,000,000 or more | 0 (0.0%) | 0 (0.0%) |
| Total | 951 (100.0%) | 865 (100.0%) |
Household Income by Mortgage Status in Union
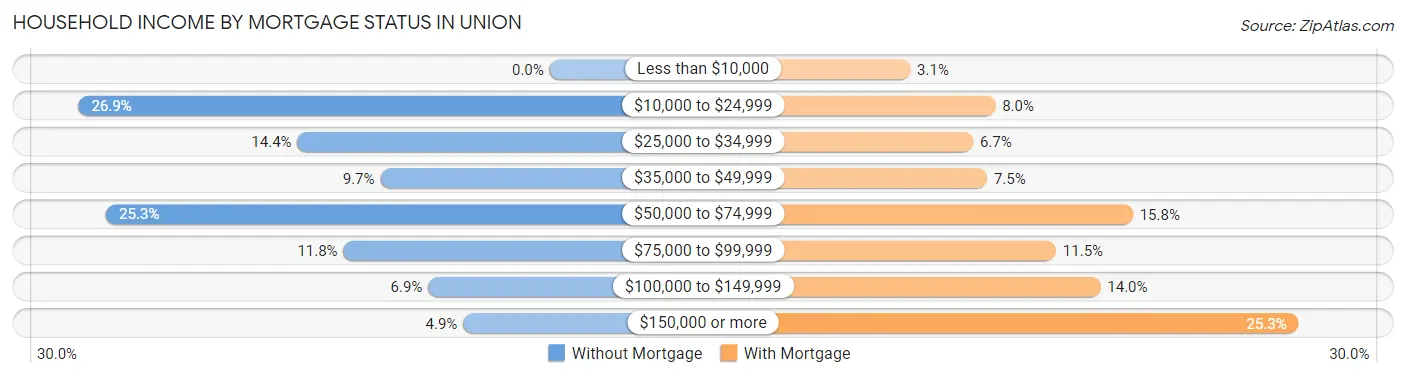
| Household Income | Without Mortgage | With Mortgage |
| Less than $10,000 | 0 (0.0%) | 27 (3.1%) |
| $10,000 to $24,999 | 256 (26.9%) | 69 (8.0%) |
| $25,000 to $34,999 | 137 (14.4%) | 58 (6.7%) |
| $35,000 to $49,999 | 92 (9.7%) | 65 (7.5%) |
| $50,000 to $74,999 | 241 (25.3%) | 137 (15.8%) |
| $75,000 to $99,999 | 112 (11.8%) | 99 (11.5%) |
| $100,000 to $149,999 | 66 (6.9%) | 121 (14.0%) |
| $150,000 or more | 47 (4.9%) | 219 (25.3%) |
| Total | 951 (100.0%) | 865 (100.0%) |
Property Value to Household Income Ratio in Union
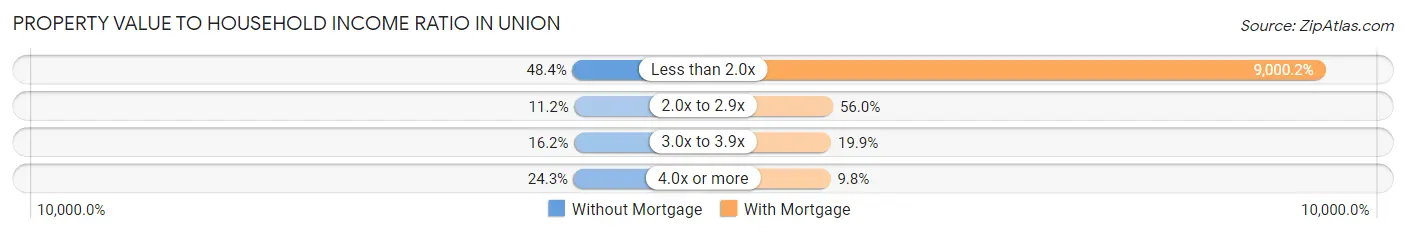
| Value-to-Income Ratio | Without Mortgage | With Mortgage |
| Less than 2.0x | 460 (48.4%) | 77,852 (9,000.2%) |
| 2.0x to 2.9x | 106 (11.2%) | 484 (55.9%) |
| 3.0x to 3.9x | 154 (16.2%) | 172 (19.9%) |
| 4.0x or more | 231 (24.3%) | 85 (9.8%) |
| Total | 951 (100.0%) | 865 (100.0%) |
Real Estate Taxes by Mortgage Status in Union
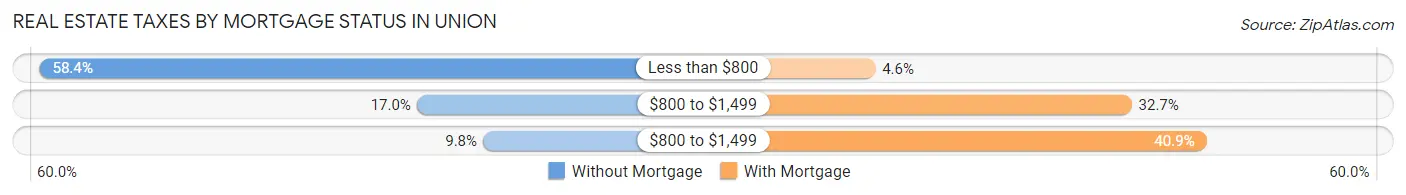
| Property Taxes | Without Mortgage | With Mortgage |
| Less than $800 | 555 (58.4%) | 40 (4.6%) |
| $800 to $1,499 | 162 (17.0%) | 283 (32.7%) |
| $800 to $1,499 | 93 (9.8%) | 354 (40.9%) |
| Total | 951 (100.0%) | 865 (100.0%) |
Health & Disability in Union
Health Insurance Coverage by Age in Union
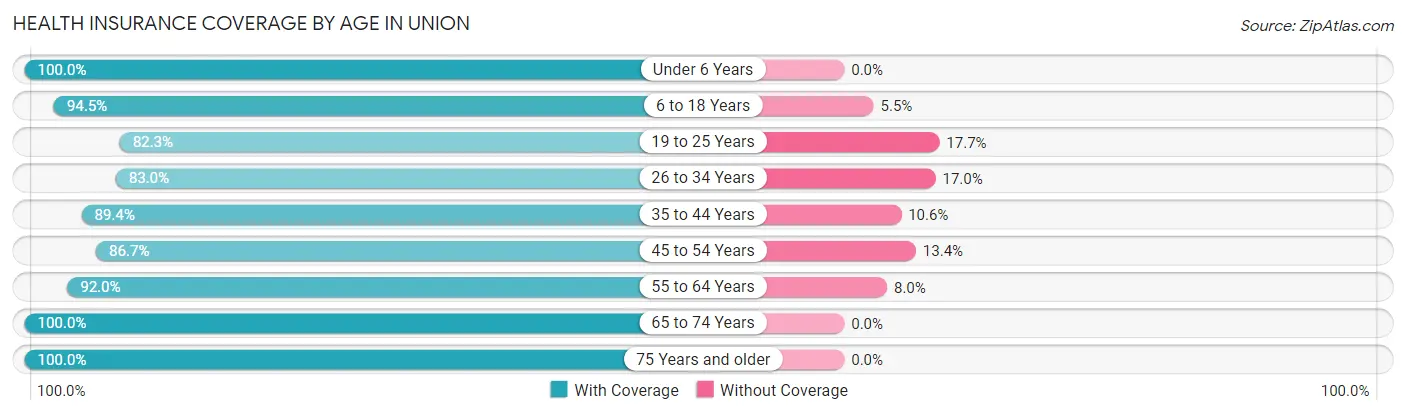
| Age Bracket | With Coverage | Without Coverage |
| Under 6 Years | 495 (100.0%) | 0 (0.0%) |
| 6 to 18 Years | 1,072 (94.5%) | 62 (5.5%) |
| 19 to 25 Years | 524 (82.3%) | 113 (17.7%) |
| 26 to 34 Years | 761 (83.0%) | 156 (17.0%) |
| 35 to 44 Years | 640 (89.4%) | 76 (10.6%) |
| 45 to 54 Years | 1,162 (86.7%) | 179 (13.4%) |
| 55 to 64 Years | 1,028 (92.0%) | 89 (8.0%) |
| 65 to 74 Years | 929 (100.0%) | 0 (0.0%) |
| 75 Years and older | 699 (100.0%) | 0 (0.0%) |
| Total | 7,310 (91.5%) | 675 (8.5%) |
Health Insurance Coverage by Citizenship Status in Union
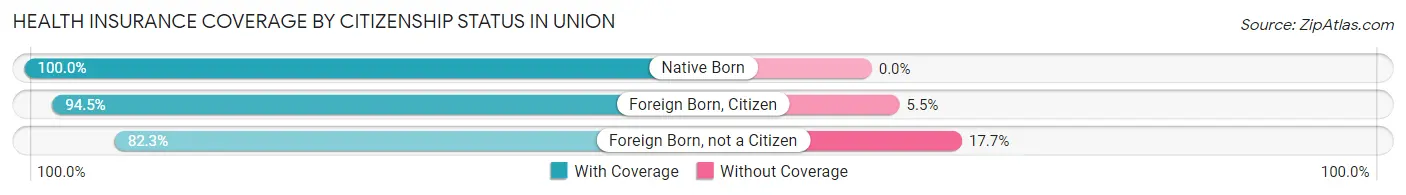
| Citizenship Status | With Coverage | Without Coverage |
| Native Born | 495 (100.0%) | 0 (0.0%) |
| Foreign Born, Citizen | 1,072 (94.5%) | 62 (5.5%) |
| Foreign Born, not a Citizen | 524 (82.3%) | 113 (17.7%) |
Health Insurance Coverage by Household Income in Union
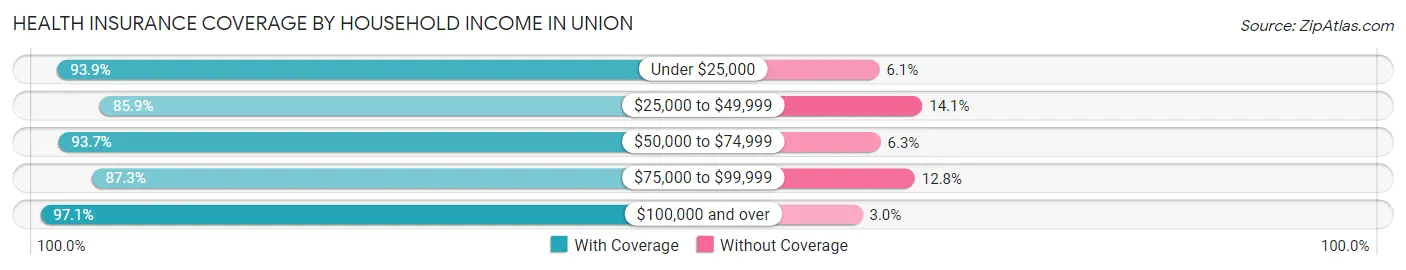
| Household Income | With Coverage | Without Coverage |
| Under $25,000 | 2,262 (93.9%) | 148 (6.1%) |
| $25,000 to $49,999 | 1,427 (85.9%) | 235 (14.1%) |
| $50,000 to $74,999 | 1,329 (93.7%) | 90 (6.3%) |
| $75,000 to $99,999 | 972 (87.3%) | 142 (12.8%) |
| $100,000 and over | 1,283 (97.1%) | 39 (2.9%) |
Public vs Private Health Insurance Coverage by Age in Union
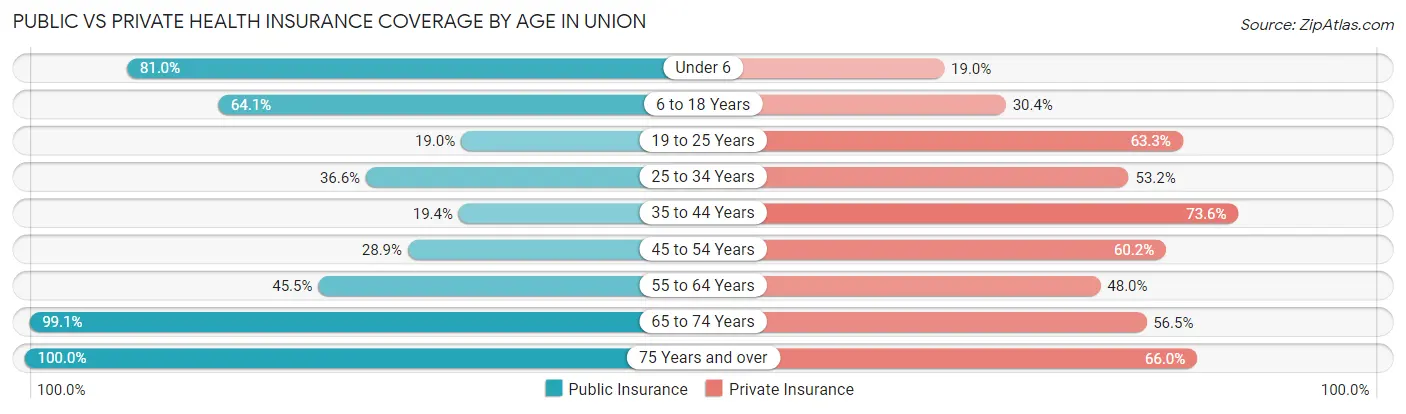
| Age Bracket | Public Insurance | Private Insurance |
| Under 6 | 401 (81.0%) | 94 (19.0%) |
| 6 to 18 Years | 727 (64.1%) | 345 (30.4%) |
| 19 to 25 Years | 121 (19.0%) | 403 (63.3%) |
| 25 to 34 Years | 336 (36.6%) | 488 (53.2%) |
| 35 to 44 Years | 139 (19.4%) | 527 (73.6%) |
| 45 to 54 Years | 387 (28.9%) | 807 (60.2%) |
| 55 to 64 Years | 508 (45.5%) | 536 (48.0%) |
| 65 to 74 Years | 921 (99.1%) | 525 (56.5%) |
| 75 Years and over | 699 (100.0%) | 461 (65.9%) |
| Total | 4,239 (53.1%) | 4,186 (52.4%) |
Disability Status by Sex by Age in Union
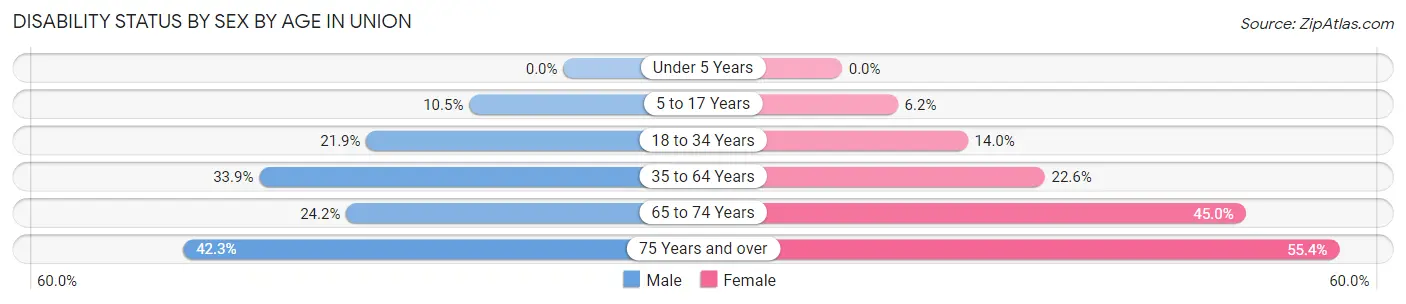
| Age Bracket | Male | Female |
| Under 5 Years | 0 (0.0%) | 0 (0.0%) |
| 5 to 17 Years | 57 (10.5%) | 29 (6.2%) |
| 18 to 34 Years | 158 (21.9%) | 139 (14.0%) |
| 35 to 64 Years | 445 (33.9%) | 420 (22.6%) |
| 65 to 74 Years | 88 (24.2%) | 254 (45.0%) |
| 75 Years and over | 127 (42.3%) | 221 (55.4%) |
Disability Class by Sex by Age in Union
Disability Class: Hearing Difficulty
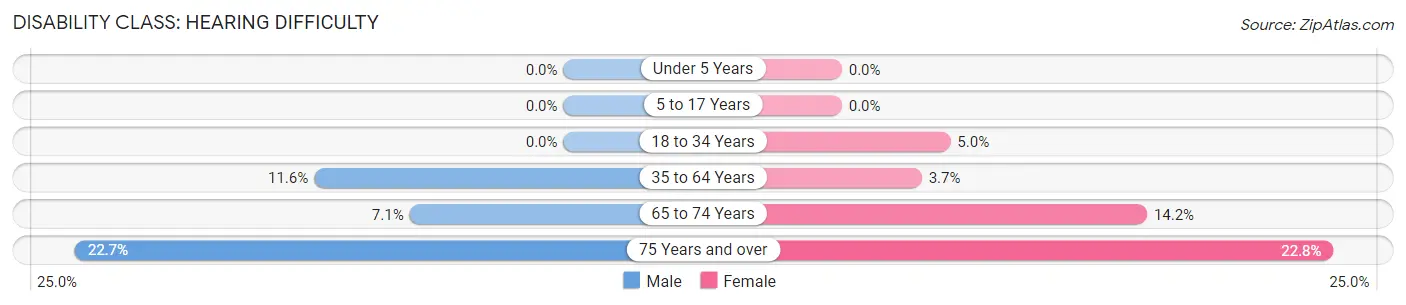
| Age Bracket | Male | Female |
| Under 5 Years | 0 (0.0%) | 0 (0.0%) |
| 5 to 17 Years | 0 (0.0%) | 0 (0.0%) |
| 18 to 34 Years | 0 (0.0%) | 50 (5.0%) |
| 35 to 64 Years | 152 (11.6%) | 69 (3.7%) |
| 65 to 74 Years | 26 (7.1%) | 80 (14.2%) |
| 75 Years and over | 68 (22.7%) | 91 (22.8%) |
Disability Class: Vision Difficulty
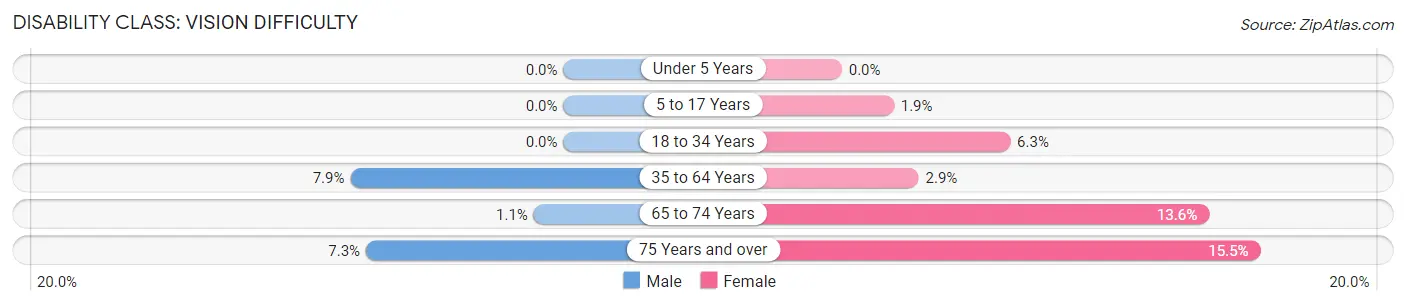
| Age Bracket | Male | Female |
| Under 5 Years | 0 (0.0%) | 0 (0.0%) |
| 5 to 17 Years | 0 (0.0%) | 9 (1.9%) |
| 18 to 34 Years | 0 (0.0%) | 62 (6.2%) |
| 35 to 64 Years | 104 (7.9%) | 53 (2.9%) |
| 65 to 74 Years | 4 (1.1%) | 77 (13.6%) |
| 75 Years and over | 22 (7.3%) | 62 (15.5%) |
Disability Class: Cognitive Difficulty
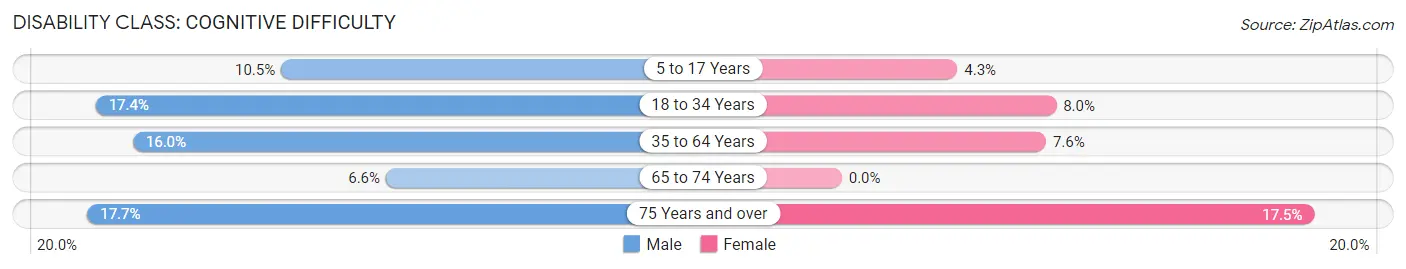
| Age Bracket | Male | Female |
| 5 to 17 Years | 57 (10.5%) | 20 (4.3%) |
| 18 to 34 Years | 125 (17.4%) | 79 (8.0%) |
| 35 to 64 Years | 210 (16.0%) | 141 (7.6%) |
| 65 to 74 Years | 24 (6.6%) | 0 (0.0%) |
| 75 Years and over | 53 (17.7%) | 70 (17.5%) |
Disability Class: Ambulatory Difficulty
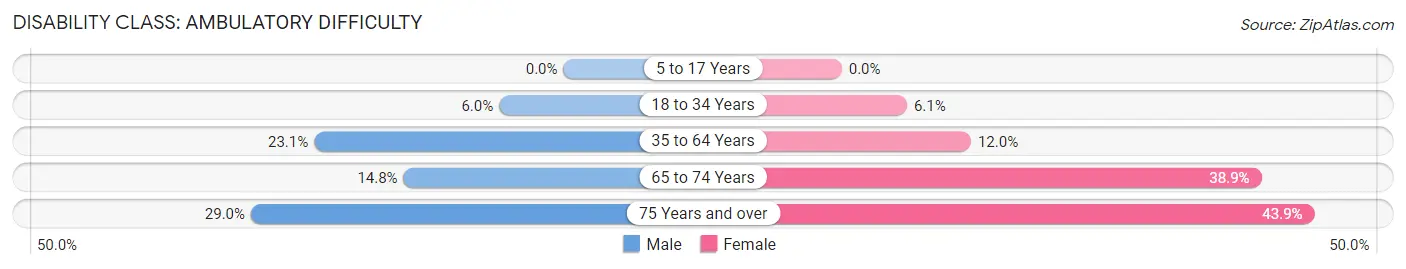
| Age Bracket | Male | Female |
| 5 to 17 Years | 0 (0.0%) | 0 (0.0%) |
| 18 to 34 Years | 43 (6.0%) | 60 (6.0%) |
| 35 to 64 Years | 304 (23.1%) | 223 (12.0%) |
| 65 to 74 Years | 54 (14.8%) | 220 (38.9%) |
| 75 Years and over | 87 (29.0%) | 175 (43.9%) |
Disability Class: Self-Care Difficulty
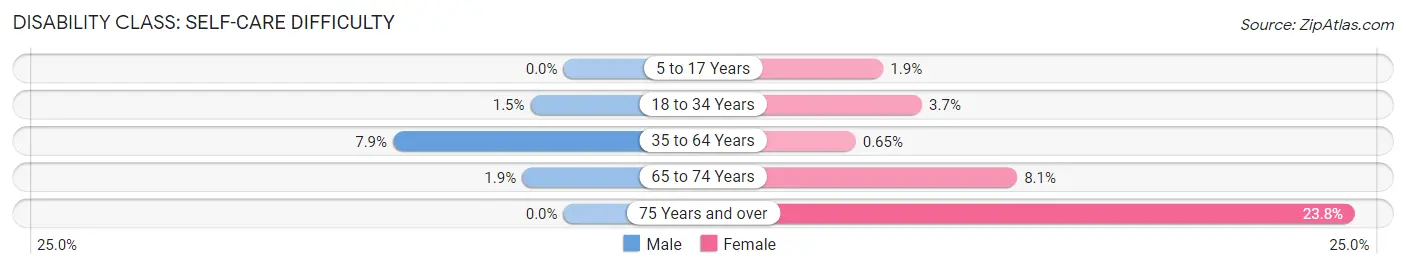
| Age Bracket | Male | Female |
| 5 to 17 Years | 0 (0.0%) | 9 (1.9%) |
| 18 to 34 Years | 11 (1.5%) | 37 (3.7%) |
| 35 to 64 Years | 104 (7.9%) | 12 (0.6%) |
| 65 to 74 Years | 7 (1.9%) | 46 (8.1%) |
| 75 Years and over | 0 (0.0%) | 95 (23.8%) |
Technology Access in Union
Computing Device Access in Union
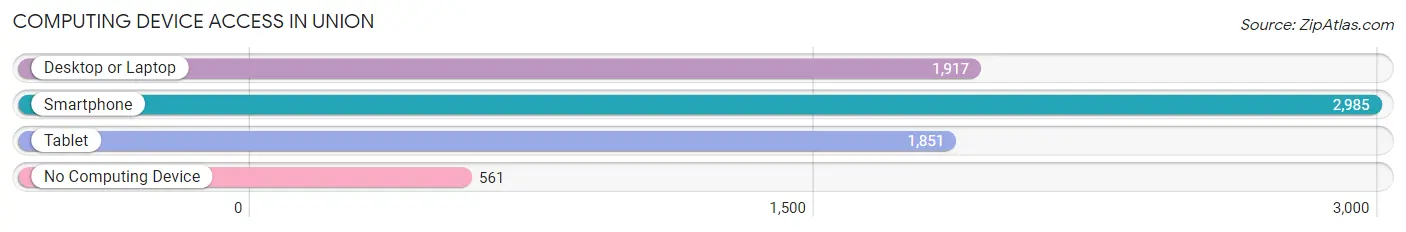
| Device Type | # Households | % Households |
| Desktop or Laptop | 1,917 | 50.5% |
| Smartphone | 2,985 | 78.7% |
| Tablet | 1,851 | 48.8% |
| No Computing Device | 561 | 14.8% |
| Total | 3,793 | 100.0% |
Internet Access in Union
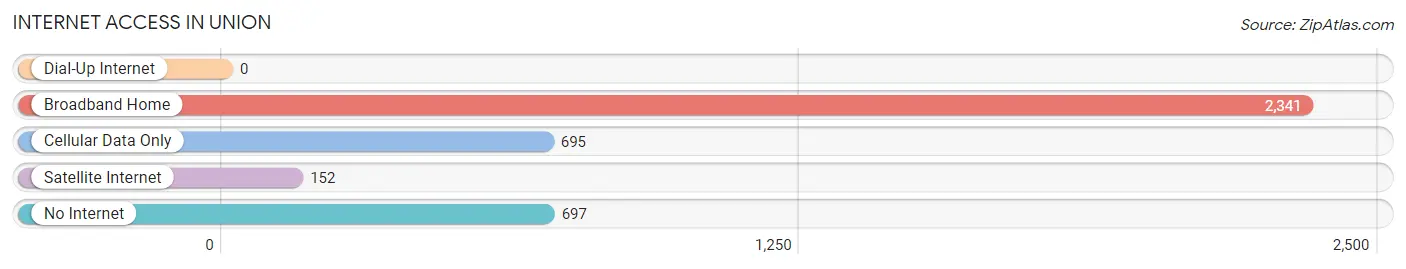
| Internet Type | # Households | % Households |
| Dial-Up Internet | 0 | 0.0% |
| Broadband Home | 2,341 | 61.7% |
| Cellular Data Only | 695 | 18.3% |
| Satellite Internet | 152 | 4.0% |
| No Internet | 697 | 18.4% |
| Total | 3,793 | 100.0% |
Union Summary
Union, South Carolina is a small city located in the Upstate region of the state. It is the county seat of Union County and is situated in the foothills of the Blue Ridge Mountains. The city has a population of approximately 8,393 people, according to the 2020 United States Census.
History
Union was founded in 1799 by a group of settlers from the Waxhaws region of North and South Carolina. The town was named after the Union Church, which was built in 1790. The church was the first public building in the area and served as a meeting place for the settlers.
The town was officially incorporated in 1832 and quickly became a center of commerce and industry. The town was home to several cotton mills, a grist mill, and a sawmill. The town also had a thriving railroad industry, with the South Carolina Railroad Company running through the town.
The town was also home to several prominent figures in South Carolina history. The most notable of these was John C. Calhoun, who served as a United States Senator from South Carolina from 1832 to 1843. Calhoun was a strong advocate for states’ rights and slavery, and his views were influential in the formation of the Confederate States of America.
Geography
Union is located in the Upstate region of South Carolina, in the foothills of the Blue Ridge Mountains. The city is situated in the Piedmont region of the state, which is characterized by rolling hills and valleys. The city is located at the intersection of two major highways, US Highway 176 and South Carolina Highway 49.
The city is located approximately 40 miles northwest of Columbia, the state capital, and approximately 60 miles southeast of Asheville, North Carolina. The city is also located approximately 30 miles from Greenville, South Carolina, and approximately 50 miles from Charlotte, North Carolina.
Economy
Union’s economy is largely based on manufacturing and agriculture. The city is home to several manufacturing companies, including a textile mill, a furniture factory, and a plastics plant. The city is also home to several agricultural businesses, including a dairy farm, a poultry farm, and a hog farm.
The city is also home to several retail businesses, including several antique stores, a grocery store, and a hardware store. The city is also home to several restaurants, including several fast food restaurants, a steakhouse, and a Mexican restaurant.
Demographics
According to the 2020 United States Census, the population of Union is 8,393. The population is approximately 54.3% White, 37.2% African American, 4.2% Hispanic or Latino, and 4.3% other. The median household income is $37,945, and the median home value is $117,400.
The city is served by the Union County School District, which consists of five elementary schools, two middle schools, and one high school. The city is also home to several private schools, including a Catholic school and a Christian school.
Conclusion
Union, South Carolina is a small city located in the Upstate region of the state. It is the county seat of Union County and is situated in the foothills of the Blue Ridge Mountains. The city has a population of approximately 8,393 people, according to the 2020 United States Census. The city’s economy is largely based on manufacturing and agriculture, and the city is home to several retail businesses, restaurants, and private schools.
Common Questions
What is Per Capita Income in Union?
Per Capita income in Union is $25,672.
What is the Median Family Income in Union?
Median Family Income in Union is $56,818.
What is the Median Household income in Union?
Median Household Income in Union is $32,548.
What is Income or Wage Gap in Union?
Income or Wage Gap in Union is 28.4%.
Women in Union earn 71.6 cents for every dollar earned by a man.
What is Inequality or Gini Index in Union?
Inequality or Gini Index in Union is 0.50.
What is the Total Population of Union?
Total Population of Union is 8,099.
What is the Total Male Population of Union?
Total Male Population of Union is 3,602.
What is the Total Female Population of Union?
Total Female Population of Union is 4,497.
What is the Ratio of Males per 100 Females in Union?
There are 80.10 Males per 100 Females in Union.
What is the Ratio of Females per 100 Males in Union?
There are 124.85 Females per 100 Males in Union.
What is the Median Population Age in Union?
Median Population Age in Union is 45.5 Years.
What is the Average Family Size in Union
Average Family Size in Union is 2.9 People.
What is the Average Household Size in Union
Average Household Size in Union is 2.1 People.
How Large is the Labor Force in Union?
There are 3,725 People in the Labor Forcein in Union.
What is the Percentage of People in the Labor Force in Union?
55.7% of People are in the Labor Force in Union.
What is the Unemployment Rate in Union?
Unemployment Rate in Union is 15.3%.