Cities with the Most Immigrants from Japan in South Carolina
RELATED REPORTS & OPTIONS
Japan
South Carolina
Compare Cities
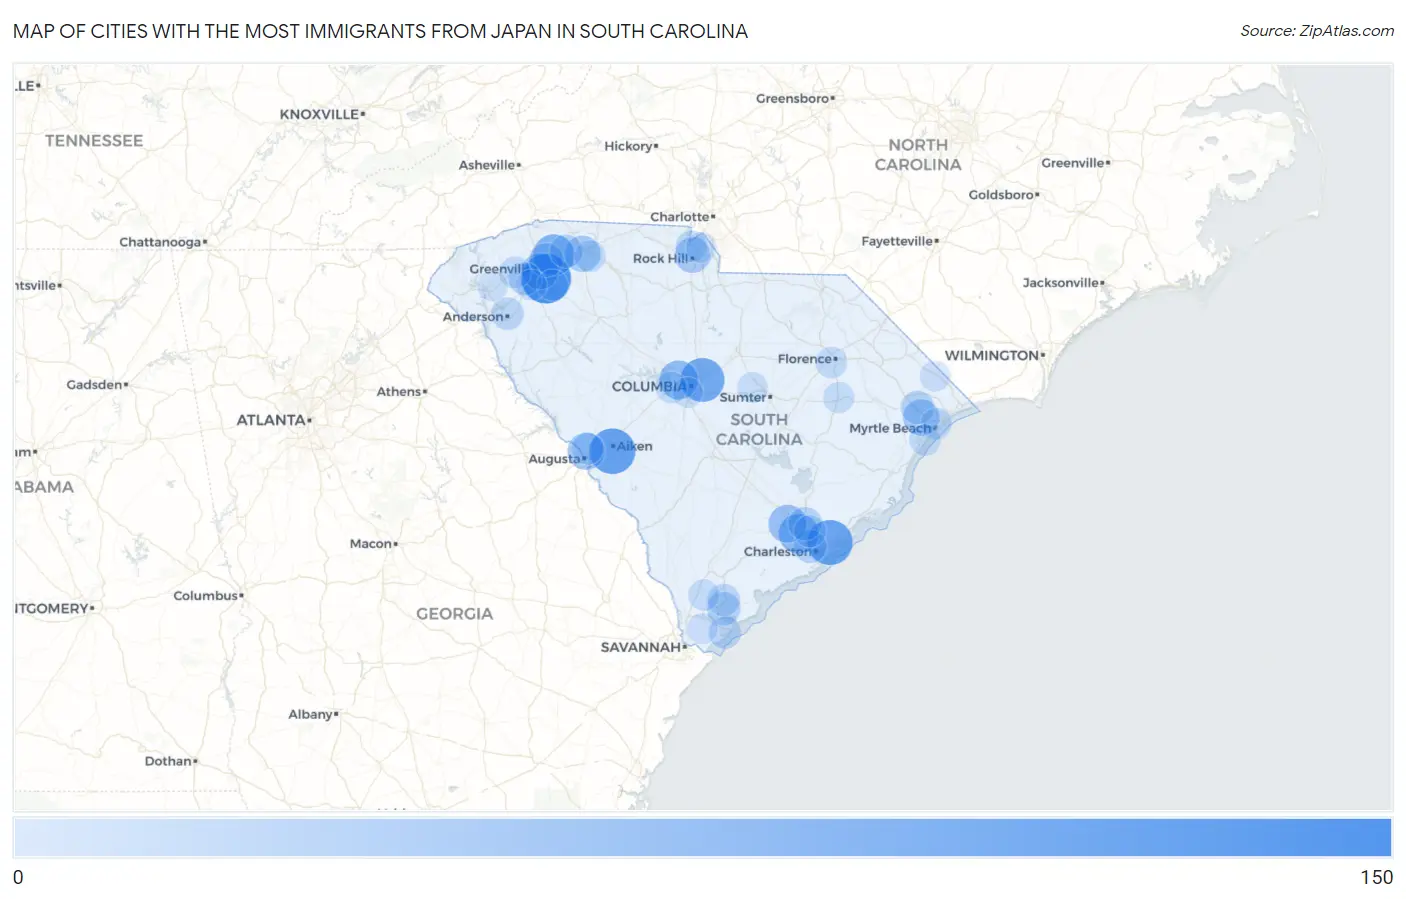
Map of Cities with the Most Immigrants from Japan in South Carolina
0
150
Cities with the Most Immigrants from Japan in South Carolina
| City | Japan | vs State | vs National | |
| 1. | Mauldin | 125 | 2,055(6.08%)#1 | 342,380(0.04%)#439 |
| 2. | Aiken | 100 | 2,055(4.87%)#2 | 342,380(0.03%)#543 |
| 3. | Mount Pleasant | 96 | 2,055(4.67%)#3 | 342,380(0.03%)#560 |
| 4. | Columbia | 88 | 2,055(4.28%)#4 | 342,380(0.03%)#604 |
| 5. | Greer | 71 | 2,055(3.45%)#5 | 342,380(0.02%)#715 |
| 6. | North Charleston | 62 | 2,055(3.02%)#6 | 342,380(0.02%)#785 |
| 7. | Seven Oaks | 56 | 2,055(2.73%)#7 | 342,380(0.02%)#874 |
| 8. | Summerville | 49 | 2,055(2.38%)#8 | 342,380(0.01%)#959 |
| 9. | North Augusta | 46 | 2,055(2.24%)#9 | 342,380(0.01%)#1,010 |
| 10. | Greenville | 40 | 2,055(1.95%)#10 | 342,380(0.01%)#1,107 |
| 11. | Red Hill | 39 | 2,055(1.90%)#11 | 342,380(0.01%)#1,136 |
| 12. | Arcadia | 38 | 2,055(1.85%)#12 | 342,380(0.01%)#1,164 |
| 13. | Rock Hill | 35 | 2,055(1.70%)#13 | 342,380(0.01%)#1,208 |
| 14. | Taylors | 25 | 2,055(1.22%)#14 | 342,380(0.01%)#1,527 |
| 15. | Charleston | 21 | 2,055(1.02%)#15 | 342,380(0.01%)#1,678 |
| 16. | Goose Creek | 21 | 2,055(1.02%)#16 | 342,380(0.01%)#1,681 |
| 17. | Conway | 21 | 2,055(1.02%)#17 | 342,380(0.01%)#1,692 |
| 18. | Port Royal | 21 | 2,055(1.02%)#18 | 342,380(0.01%)#1,703 |
| 19. | Lyman | 20 | 2,055(0.97%)#19 | 342,380(0.01%)#1,775 |
| 20. | Powdersville | 16 | 2,055(0.78%)#20 | 342,380(0.00%)#1,982 |
| 21. | Hilton Head Island | 15 | 2,055(0.73%)#21 | 342,380(0.00%)#2,027 |
| 22. | Anderson | 15 | 2,055(0.73%)#22 | 342,380(0.00%)#2,032 |
| 23. | Burton | 15 | 2,055(0.73%)#23 | 342,380(0.00%)#2,062 |
| 24. | Hanahan | 12 | 2,055(0.58%)#24 | 342,380(0.00%)#2,285 |
| 25. | Easley | 10 | 2,055(0.49%)#25 | 342,380(0.00%)#2,481 |
| 26. | Belvedere | 10 | 2,055(0.49%)#26 | 342,380(0.00%)#2,531 |
| 27. | Spartanburg | 9 | 2,055(0.44%)#27 | 342,380(0.00%)#2,575 |
| 28. | Lexington | 9 | 2,055(0.44%)#28 | 342,380(0.00%)#2,585 |
| 29. | India Hook | 9 | 2,055(0.44%)#29 | 342,380(0.00%)#2,644 |
| 30. | Florence | 8 | 2,055(0.39%)#30 | 342,380(0.00%)#2,685 |
| 31. | Myrtle Beach | 8 | 2,055(0.39%)#31 | 342,380(0.00%)#2,689 |
| 32. | Surfside Beach | 8 | 2,055(0.39%)#32 | 342,380(0.00%)#2,742 |
| 33. | Carolina Forest | 7 | 2,055(0.34%)#33 | 342,380(0.00%)#2,807 |
| 34. | Simpsonville | 6 | 2,055(0.29%)#34 | 342,380(0.00%)#2,919 |
| 35. | Ridgeland | 6 | 2,055(0.29%)#35 | 342,380(0.00%)#2,975 |
| 36. | Scranton | 6 | 2,055(0.29%)#36 | 342,380(0.00%)#3,010 |
| 37. | Golden Grove | 5 | 2,055(0.24%)#37 | 342,380(0.00%)#3,060 |
| 38. | Cayce | 4 | 2,055(0.19%)#38 | 342,380(0.00%)#3,157 |
| 39. | Wyboo | 4 | 2,055(0.19%)#39 | 342,380(0.00%)#3,183 |
| 40. | Oakland | 4 | 2,055(0.19%)#40 | 342,380(0.00%)#3,213 |
| 41. | Bluffton | 3 | 2,055(0.15%)#41 | 342,380(0.00%)#3,238 |
| 42. | Loris | 3 | 2,055(0.15%)#42 | 342,380(0.00%)#3,284 |
| 43. | Fripp Island | 3 | 2,055(0.15%)#43 | 342,380(0.00%)#3,326 |
| 44. | Fort Mill | 2 | 2,055(0.10%)#44 | 342,380(0.00%)#3,350 |
| 45. | Central | 1 | 2,055(0.05%)#45 | 342,380(0.00%)#3,480 |
Common Questions
What are the Top 10 Cities with the Most Immigrants from Japan in South Carolina?
Top 10 Cities with the Most Immigrants from Japan in South Carolina are:
#1
125
#2
100
#3
96
#4
88
#5
71
#6
62
#7
56
#8
49
#9
46
#10
40
What city has the Most Immigrants from Japan in South Carolina?
Mauldin has the Most Immigrants from Japan in South Carolina with 125.
What is the Total Immigrants from Japan in the State of South Carolina?
Total Immigrants from Japan in South Carolina is 2,055.
What is the Total Immigrants from Japan in the United States?
Total Immigrants from Japan in the United States is 342,380.