Scranton, SC Map & Demographics
Scranton Map
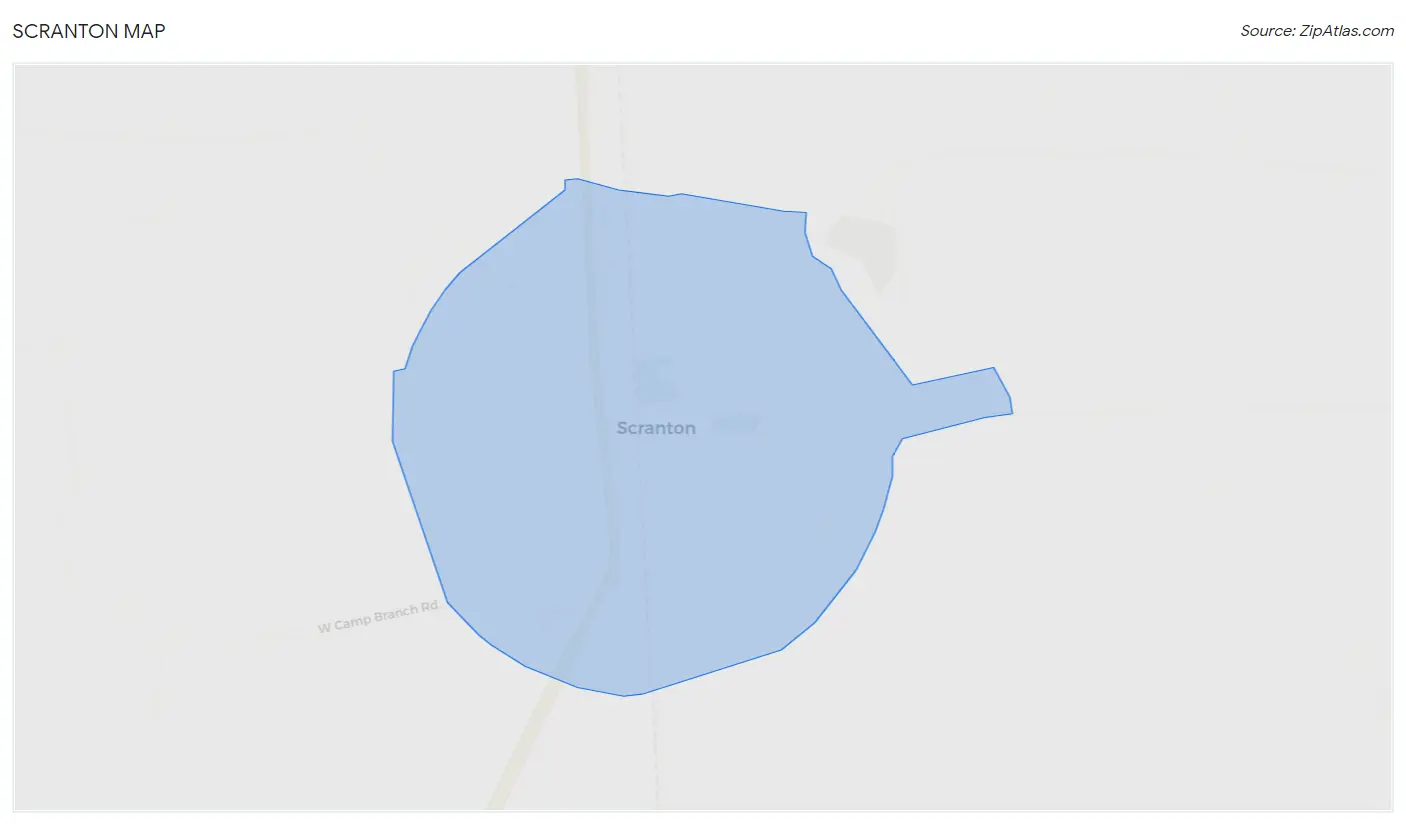
Scranton Overview
$19,301
PER CAPITA INCOME
$28,750
AVG HOUSEHOLD INCOME
0.46
INEQUALITY / GINI INDEX
897
TOTAL POPULATION
403
MALE POPULATION
494
FEMALE POPULATION
81.58
MALES / 100 FEMALES
122.58
FEMALES / 100 MALES
47.6
MEDIAN AGE
3.5
AVG FAMILY SIZE
2.9
AVG HOUSEHOLD SIZE
345
LABOR FORCE [ PEOPLE ]
45.4%
PERCENT IN LABOR FORCE
1.2%
UNEMPLOYMENT RATE
Scranton Zip Codes
Scranton Area Codes
Income in Scranton
Income Overview in Scranton
| Characteristic | Number | Measure |
| Per Capita Income | 897 | $19,301 |
| Median Family Income | 184 | $0 |
| Mean Family Income | 184 | $57,918 |
| Median Household Income | 274 | $28,750 |
| Mean Household Income | 274 | $52,010 |
| Income Deficit | 184 | $0 |
| Wage / Income Gap (%) | 897 | 0.00% |
| Wage / Income Gap ($) | 897 | 100.00¢ per $1 |
| Gini / Inequality Index | 897 | 0.46 |
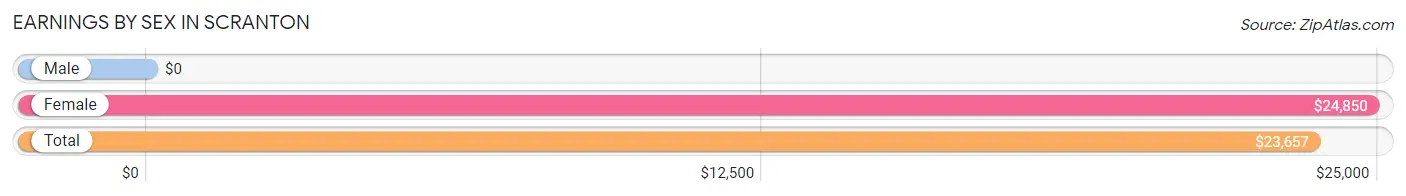
Earnings by Sex in Scranton
| Sex | Number | Average Earnings |
| Male | 180 (46.5%) | $0 |
| Female | 207 (53.5%) | $24,850 |
| Total | 387 (100.0%) | $23,657 |
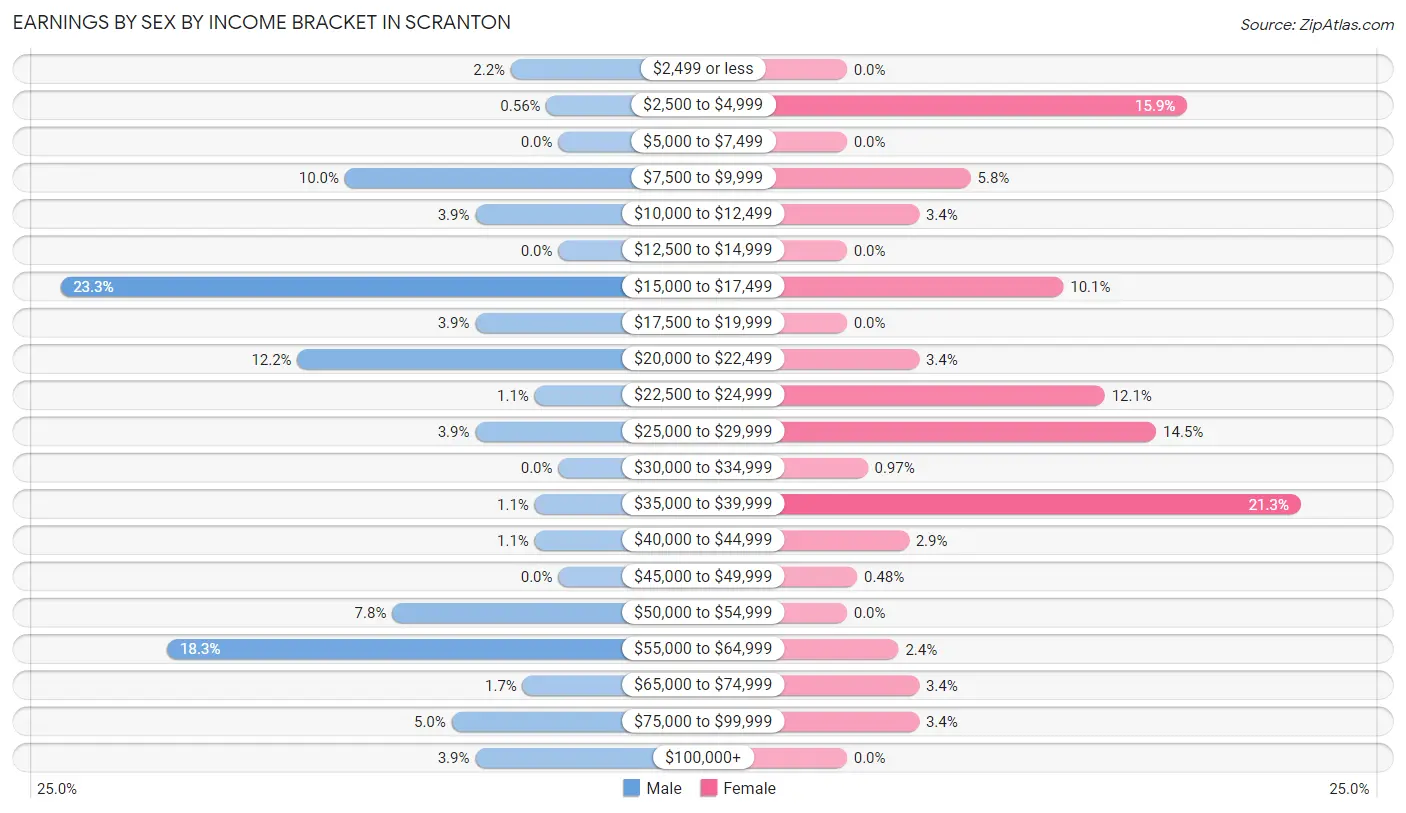
Earnings by Sex by Income Bracket in Scranton
The most common earnings brackets in Scranton are $15,000 to $17,499 for men (42 | 23.3%) and $35,000 to $39,999 for women (44 | 21.3%).
| Income | Male | Female |
| $2,499 or less | 4 (2.2%) | 0 (0.0%) |
| $2,500 to $4,999 | 1 (0.6%) | 33 (15.9%) |
| $5,000 to $7,499 | 0 (0.0%) | 0 (0.0%) |
| $7,500 to $9,999 | 18 (10.0%) | 12 (5.8%) |
| $10,000 to $12,499 | 7 (3.9%) | 7 (3.4%) |
| $12,500 to $14,999 | 0 (0.0%) | 0 (0.0%) |
| $15,000 to $17,499 | 42 (23.3%) | 21 (10.1%) |
| $17,500 to $19,999 | 7 (3.9%) | 0 (0.0%) |
| $20,000 to $22,499 | 22 (12.2%) | 7 (3.4%) |
| $22,500 to $24,999 | 2 (1.1%) | 25 (12.1%) |
| $25,000 to $29,999 | 7 (3.9%) | 30 (14.5%) |
| $30,000 to $34,999 | 0 (0.0%) | 2 (1.0%) |
| $35,000 to $39,999 | 2 (1.1%) | 44 (21.3%) |
| $40,000 to $44,999 | 2 (1.1%) | 6 (2.9%) |
| $45,000 to $49,999 | 0 (0.0%) | 1 (0.5%) |
| $50,000 to $54,999 | 14 (7.8%) | 0 (0.0%) |
| $55,000 to $64,999 | 33 (18.3%) | 5 (2.4%) |
| $65,000 to $74,999 | 3 (1.7%) | 7 (3.4%) |
| $75,000 to $99,999 | 9 (5.0%) | 7 (3.4%) |
| $100,000+ | 7 (3.9%) | 0 (0.0%) |
| Total | 180 (100.0%) | 207 (100.0%) |
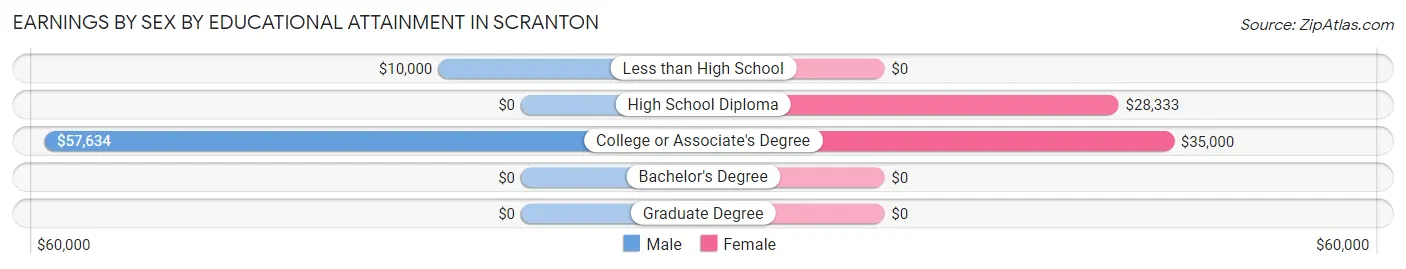
Earnings by Sex by Educational Attainment in Scranton
| Educational Attainment | Male Income | Female Income |
| Less than High School | $10,000 | $0 |
| High School Diploma | - | - |
| College or Associate's Degree | $57,634 | $35,000 |
| Bachelor's Degree | - | - |
| Graduate Degree | - | - |
| Total | - | - |
Family Income in Scranton
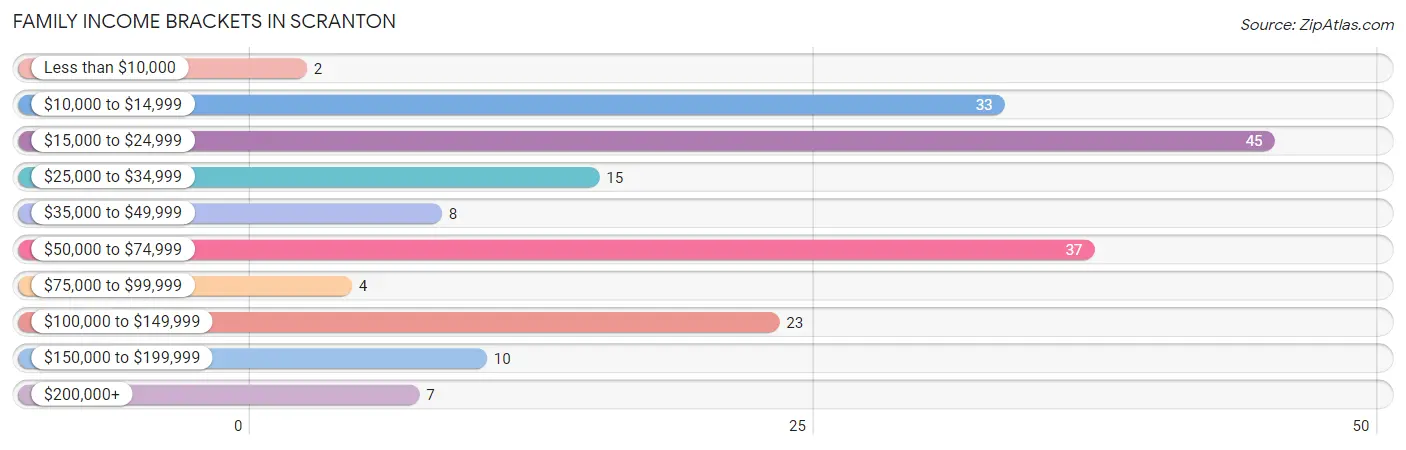
Family Income Brackets in Scranton
According to the Scranton family income data, there are 45 families falling into the $15,000 to $24,999 income range, which is the most common income bracket and makes up 24.5% of all families. Conversely, the less than $10,000 income bracket is the least frequent group with only 2 families (1.1%) belonging to this category.
| Income Bracket | # Families | % Families |
| Less than $10,000 | 2 | 1.1% |
| $10,000 to $14,999 | 33 | 17.9% |
| $15,000 to $24,999 | 45 | 24.5% |
| $25,000 to $34,999 | 15 | 8.2% |
| $35,000 to $49,999 | 8 | 4.3% |
| $50,000 to $74,999 | 37 | 20.1% |
| $75,000 to $99,999 | 4 | 2.2% |
| $100,000 to $149,999 | 23 | 12.5% |
| $150,000 to $199,999 | 10 | 5.4% |
| $200,000+ | 7 | 3.8% |
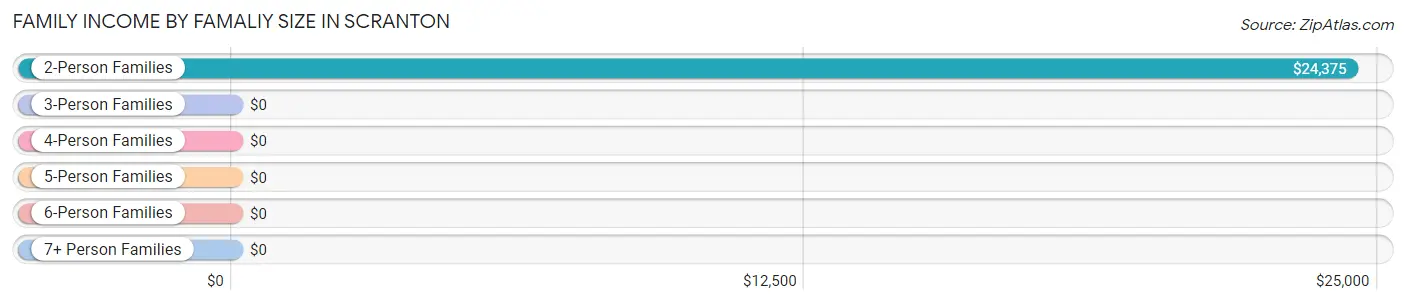
Family Income by Famaliy Size in Scranton
2-person families (74 | 40.2%) account for the highest median family income in Scranton with $24,375 per family, while 2-person families (74 | 40.2%) have the highest median income of $12,188 per family member.
| Income Bracket | # Families | Median Income |
| 2-Person Families | 74 (40.2%) | $24,375 |
| 3-Person Families | 84 (45.7%) | $0 |
| 4-Person Families | 5 (2.7%) | $0 |
| 5-Person Families | 0 (0.0%) | $0 |
| 6-Person Families | 14 (7.6%) | $0 |
| 7+ Person Families | 7 (3.8%) | $0 |
| Total | 184 (100.0%) | $0 |
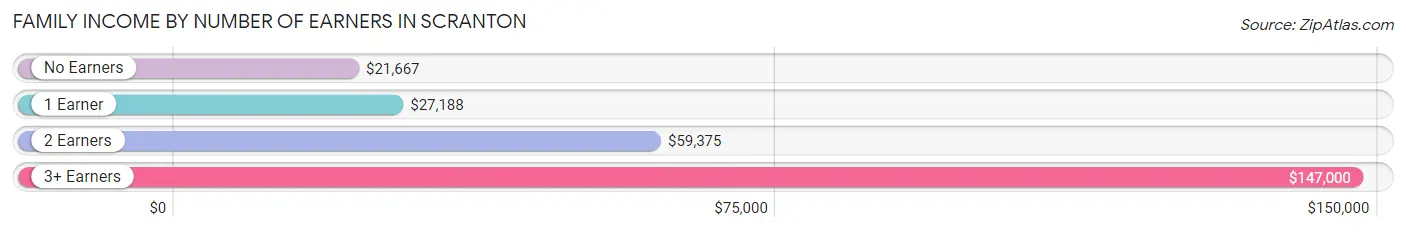
Family Income by Number of Earners in Scranton
| Number of Earners | # Families | Median Income |
| No Earners | 34 (18.5%) | $21,667 |
| 1 Earner | 71 (38.6%) | $27,188 |
| 2 Earners | 71 (38.6%) | $59,375 |
| 3+ Earners | 8 (4.3%) | $147,000 |
| Total | 184 (100.0%) | $0 |
Household Income in Scranton
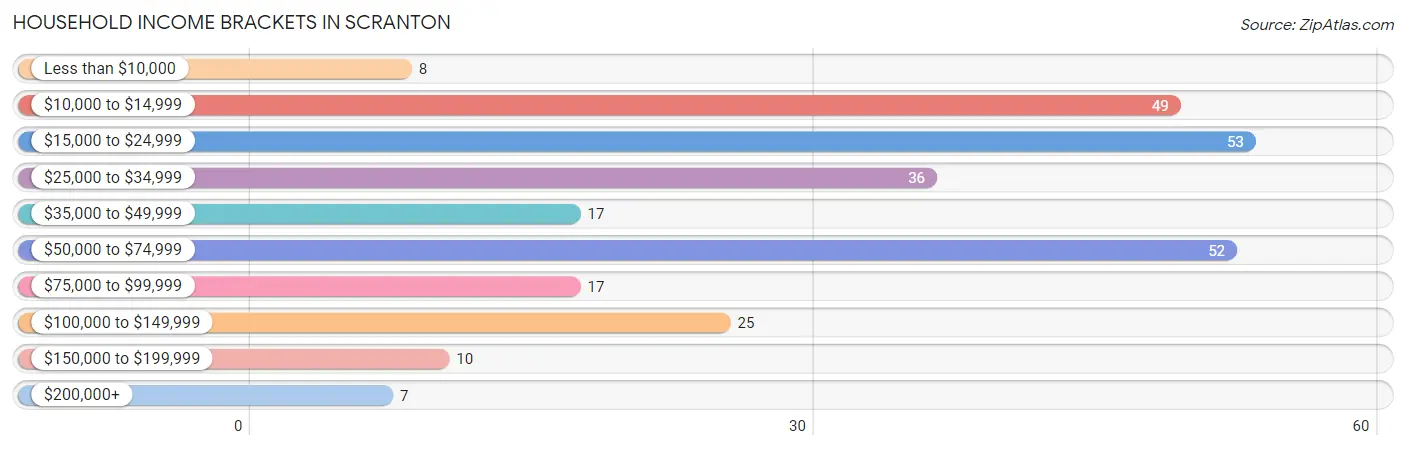
Household Income Brackets in Scranton
With 53 households falling in the category, the $15,000 to $24,999 income range is the most frequent in Scranton, accounting for 19.3% of all households. In contrast, only 7 households (2.5%) fall into the $200,000+ income bracket, making it the least populous group.
| Income Bracket | # Households | % Households |
| Less than $10,000 | 8 | 2.9% |
| $10,000 to $14,999 | 49 | 17.9% |
| $15,000 to $24,999 | 53 | 19.3% |
| $25,000 to $34,999 | 36 | 13.1% |
| $35,000 to $49,999 | 17 | 6.2% |
| $50,000 to $74,999 | 52 | 19.0% |
| $75,000 to $99,999 | 17 | 6.2% |
| $100,000 to $149,999 | 25 | 9.1% |
| $150,000 to $199,999 | 10 | 3.6% |
| $200,000+ | 7 | 2.6% |
Household Income by Householder Age in Scranton
The median household income in Scranton is $28,750, with the highest median household income of $25,000 found in the 45 to 64 years age bracket for the primary householder. A total of 98 households (35.8%) fall into this category. Meanwhile, the 15 to 24 years age bracket for the primary householder has the lowest median household income of $0, with 29 households (10.6%) in this group.
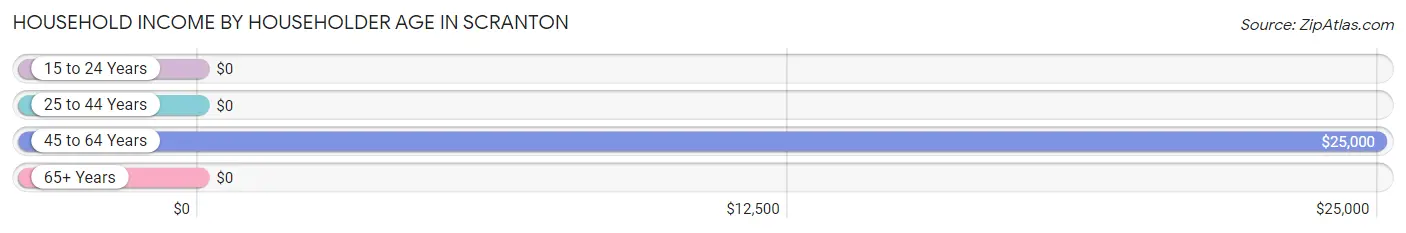
| Income Bracket | # Households | Median Income |
| 15 to 24 Years | 29 (10.6%) | $0 |
| 25 to 44 Years | 79 (28.8%) | $0 |
| 45 to 64 Years | 98 (35.8%) | $25,000 |
| 65+ Years | 68 (24.8%) | $0 |
| Total | 274 (100.0%) | $28,750 |
Poverty in Scranton
Income Below Poverty by Sex and Age in Scranton
With 20.1% poverty level for males and 35.4% for females among the residents of Scranton, under 5 year old males and 25 to 34 year old females are the most vulnerable to poverty, with 23 males (100.0%) and 51 females (77.3%) in their respective age groups living below the poverty level.
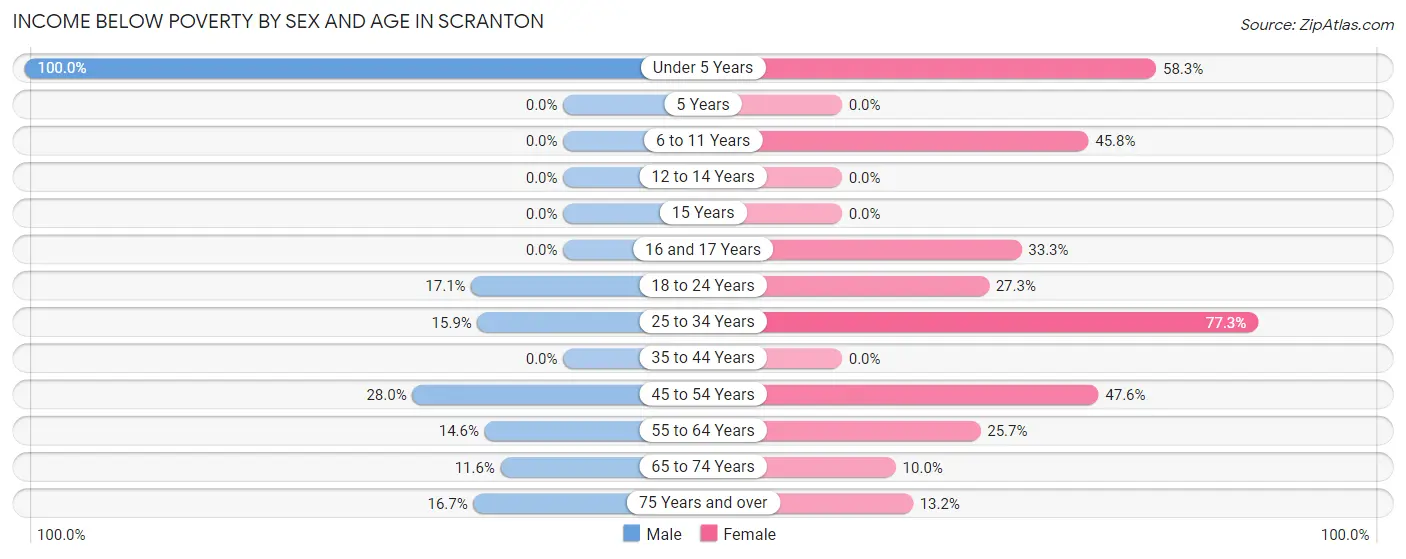
| Age Bracket | Male | Female |
| Under 5 Years | 23 (100.0%) | 7 (58.3%) |
| 5 Years | 0 (0.0%) | 0 (0.0%) |
| 6 to 11 Years | 0 (0.0%) | 27 (45.8%) |
| 12 to 14 Years | 0 (0.0%) | 0 (0.0%) |
| 15 Years | 0 (0.0%) | 0 (0.0%) |
| 16 and 17 Years | 0 (0.0%) | 5 (33.3%) |
| 18 to 24 Years | 7 (17.1%) | 6 (27.3%) |
| 25 to 34 Years | 7 (15.9%) | 51 (77.3%) |
| 35 to 44 Years | 0 (0.0%) | 0 (0.0%) |
| 45 to 54 Years | 21 (28.0%) | 40 (47.6%) |
| 55 to 64 Years | 7 (14.6%) | 9 (25.7%) |
| 65 to 74 Years | 5 (11.6%) | 4 (10.0%) |
| 75 Years and over | 2 (16.7%) | 5 (13.2%) |
| Total | 72 (20.1%) | 154 (35.4%) |
Income Above Poverty by Sex and Age in Scranton
According to the poverty statistics in Scranton, males aged 6 to 11 years and females aged 15 years are the age groups that are most secure financially, with 100.0% of males and 100.0% of females in these age groups living above the poverty line.
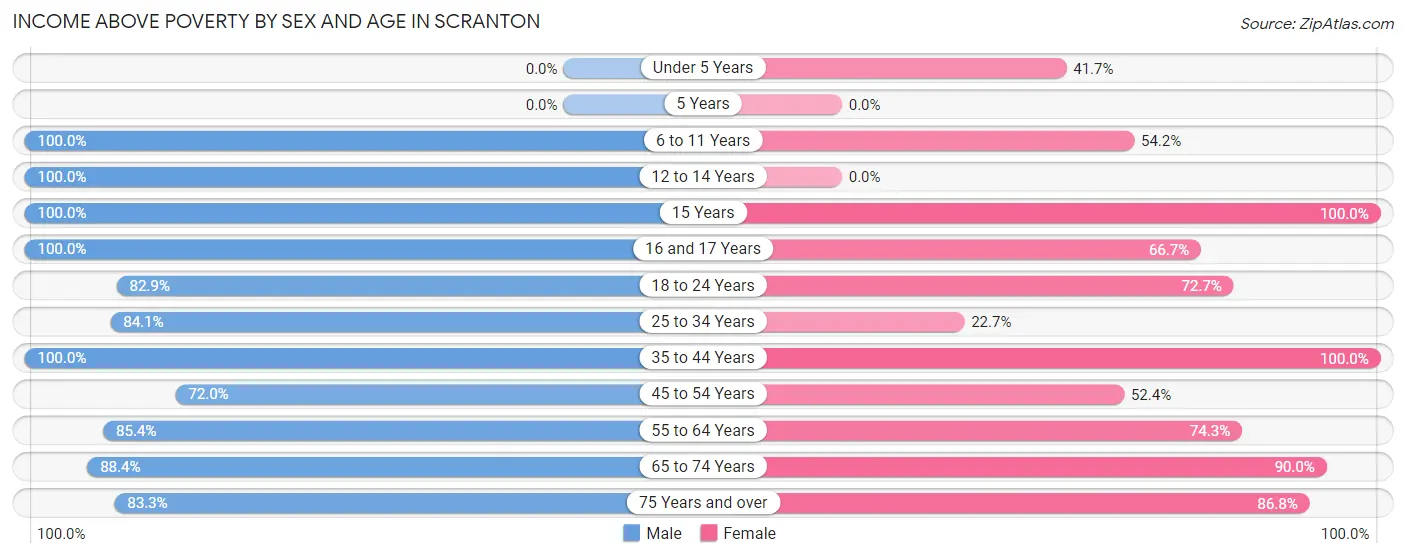
| Age Bracket | Male | Female |
| Under 5 Years | 0 (0.0%) | 5 (41.7%) |
| 5 Years | 0 (0.0%) | 0 (0.0%) |
| 6 to 11 Years | 10 (100.0%) | 32 (54.2%) |
| 12 to 14 Years | 16 (100.0%) | 0 (0.0%) |
| 15 Years | 10 (100.0%) | 7 (100.0%) |
| 16 and 17 Years | 20 (100.0%) | 10 (66.7%) |
| 18 to 24 Years | 34 (82.9%) | 16 (72.7%) |
| 25 to 34 Years | 37 (84.1%) | 15 (22.7%) |
| 35 to 44 Years | 17 (100.0%) | 57 (100.0%) |
| 45 to 54 Years | 54 (72.0%) | 44 (52.4%) |
| 55 to 64 Years | 41 (85.4%) | 26 (74.3%) |
| 65 to 74 Years | 38 (88.4%) | 36 (90.0%) |
| 75 Years and over | 10 (83.3%) | 33 (86.8%) |
| Total | 287 (79.9%) | 281 (64.6%) |
Income Below Poverty Among Married-Couple Families in Scranton
The poverty statistics for married-couple families in Scranton show that 33.3% or 37 of the total 111 families live below the poverty line. Families with no children have the highest poverty rate of 48.0%, comprising of 37 families. On the other hand, families with 1 or 2 children have the lowest poverty rate of 0.0%, which includes 0 families.
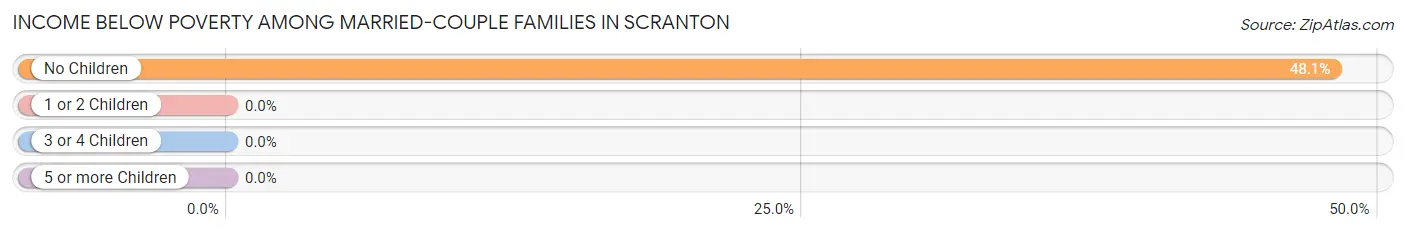
| Children | Above Poverty | Below Poverty |
| No Children | 40 (51.9%) | 37 (48.0%) |
| 1 or 2 Children | 21 (100.0%) | 0 (0.0%) |
| 3 or 4 Children | 13 (100.0%) | 0 (0.0%) |
| 5 or more Children | 0 (0.0%) | 0 (0.0%) |
| Total | 74 (66.7%) | 37 (33.3%) |
Income Below Poverty Among Single-Parent Households in Scranton
According to the poverty data in Scranton, 41.2% or 7 single-father households and 39.3% or 22 single-mother households are living below the poverty line. Among single-father households, those with 1 or 2 children have the highest poverty rate, with 7 households (77.8%) experiencing poverty. Likewise, among single-mother households, those with 1 or 2 children have the highest poverty rate, with 22 households (84.6%) falling below the poverty line.
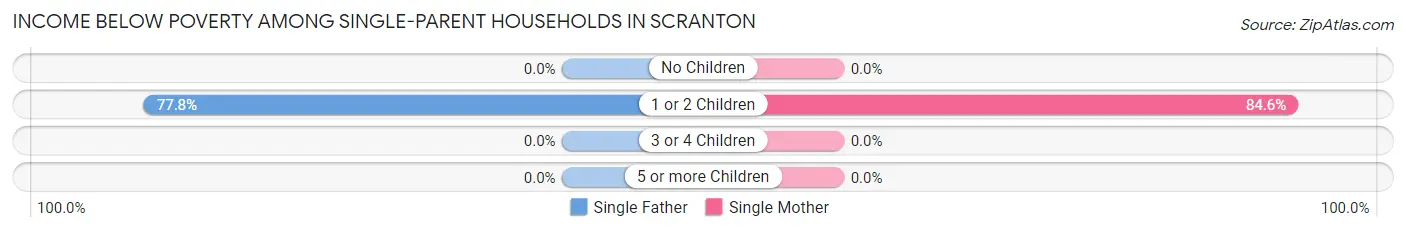
| Children | Single Father | Single Mother |
| No Children | 0 (0.0%) | 0 (0.0%) |
| 1 or 2 Children | 7 (77.8%) | 22 (84.6%) |
| 3 or 4 Children | 0 (0.0%) | 0 (0.0%) |
| 5 or more Children | 0 (0.0%) | 0 (0.0%) |
| Total | 7 (41.2%) | 22 (39.3%) |
Income Below Poverty Among Married-Couple vs Single-Parent Households in Scranton
The poverty data for Scranton shows that 37 of the married-couple family households (33.3%) and 29 of the single-parent households (39.7%) are living below the poverty level. Within the married-couple family households, those with no children have the highest poverty rate, with 37 households (48.0%) falling below the poverty line. Among the single-parent households, those with 1 or 2 children have the highest poverty rate, with 29 household (82.9%) living below poverty.
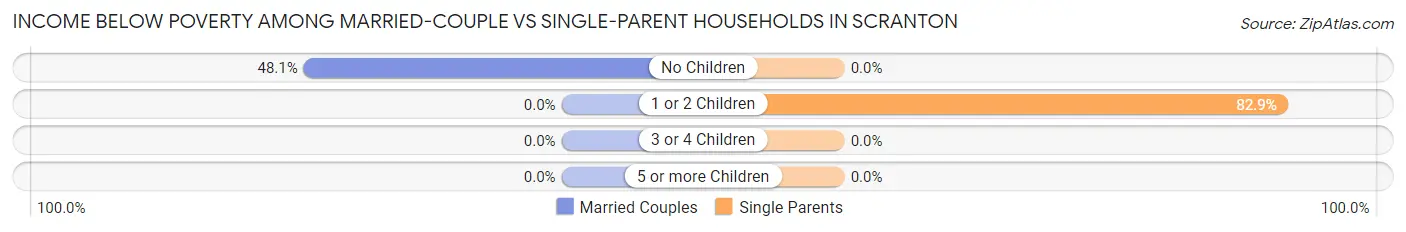
| Children | Married-Couple Families | Single-Parent Households |
| No Children | 37 (48.0%) | 0 (0.0%) |
| 1 or 2 Children | 0 (0.0%) | 29 (82.9%) |
| 3 or 4 Children | 0 (0.0%) | 0 (0.0%) |
| 5 or more Children | 0 (0.0%) | 0 (0.0%) |
| Total | 37 (33.3%) | 29 (39.7%) |
Race in Scranton
The most populous races in Scranton are Black / African American (559 | 62.3%), White / Caucasian (326 | 36.3%), and Hispanic or Latino (46 | 5.1%).
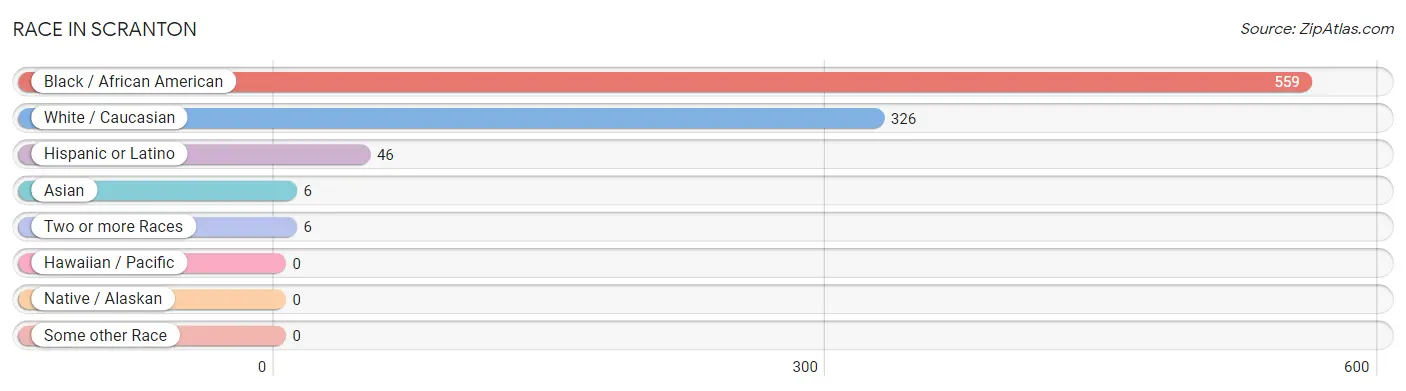
| Race | # Population | % Population |
| Asian | 6 | 0.7% |
| Black / African American | 559 | 62.3% |
| Hawaiian / Pacific | 0 | 0.0% |
| Hispanic or Latino | 46 | 5.1% |
| Native / Alaskan | 0 | 0.0% |
| White / Caucasian | 326 | 36.3% |
| Two or more Races | 6 | 0.7% |
| Some other Race | 0 | 0.0% |
| Total | 897 | 100.0% |
Ancestry in Scranton
The most populous ancestries reported in Scranton are American (84 | 9.4%), Haitian (46 | 5.1%), English (45 | 5.0%), Irish (15 | 1.7%), and German (9 | 1.0%), together accounting for 22.2% of all Scranton residents.
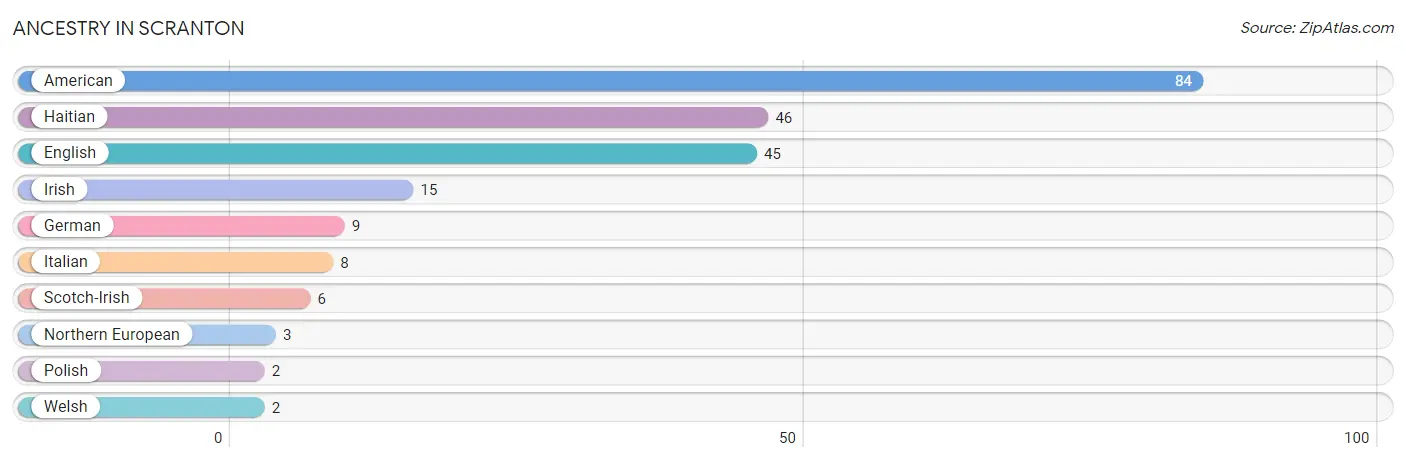
| Ancestry | # Population | % Population |
| American | 84 | 9.4% |
| English | 45 | 5.0% |
| German | 9 | 1.0% |
| Haitian | 46 | 5.1% |
| Irish | 15 | 1.7% |
| Italian | 8 | 0.9% |
| Northern European | 3 | 0.3% |
| Polish | 2 | 0.2% |
| Scotch-Irish | 6 | 0.7% |
| Welsh | 2 | 0.2% | View All 10 Rows |
Immigrants in Scranton
The most numerous immigrant groups reported in Scranton came from Caribbean (31 | 3.5%), Haiti (31 | 3.5%), Latin America (31 | 3.5%), Asia (6 | 0.7%), and Eastern Asia (6 | 0.7%), together accounting for 11.7% of all Scranton residents.
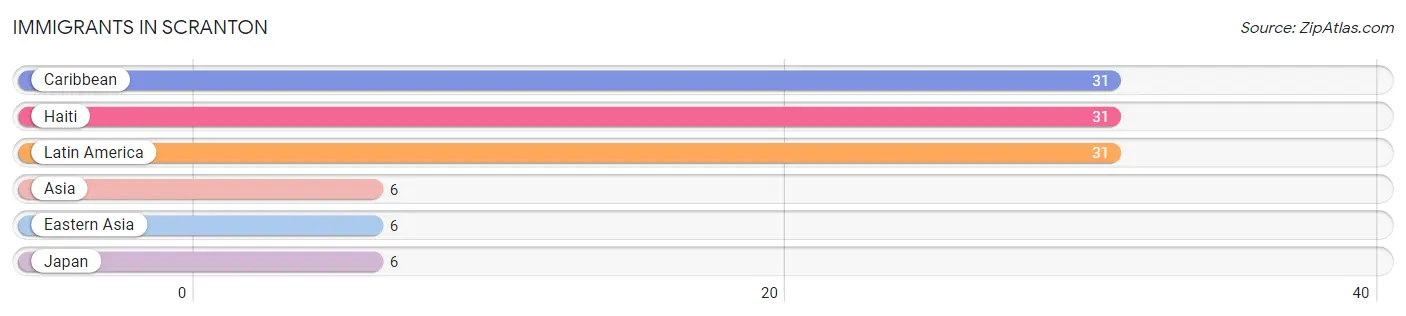
| Immigration Origin | # Population | % Population |
| Asia | 6 | 0.7% |
| Caribbean | 31 | 3.5% |
| Eastern Asia | 6 | 0.7% |
| Haiti | 31 | 3.5% |
| Japan | 6 | 0.7% |
| Latin America | 31 | 3.5% | View All 6 Rows |
Sex and Age in Scranton
Sex and Age in Scranton
The most populous age groups in Scranton are 45 to 49 Years (58 | 14.4%) for men and 45 to 49 Years (56 | 11.3%) for women.
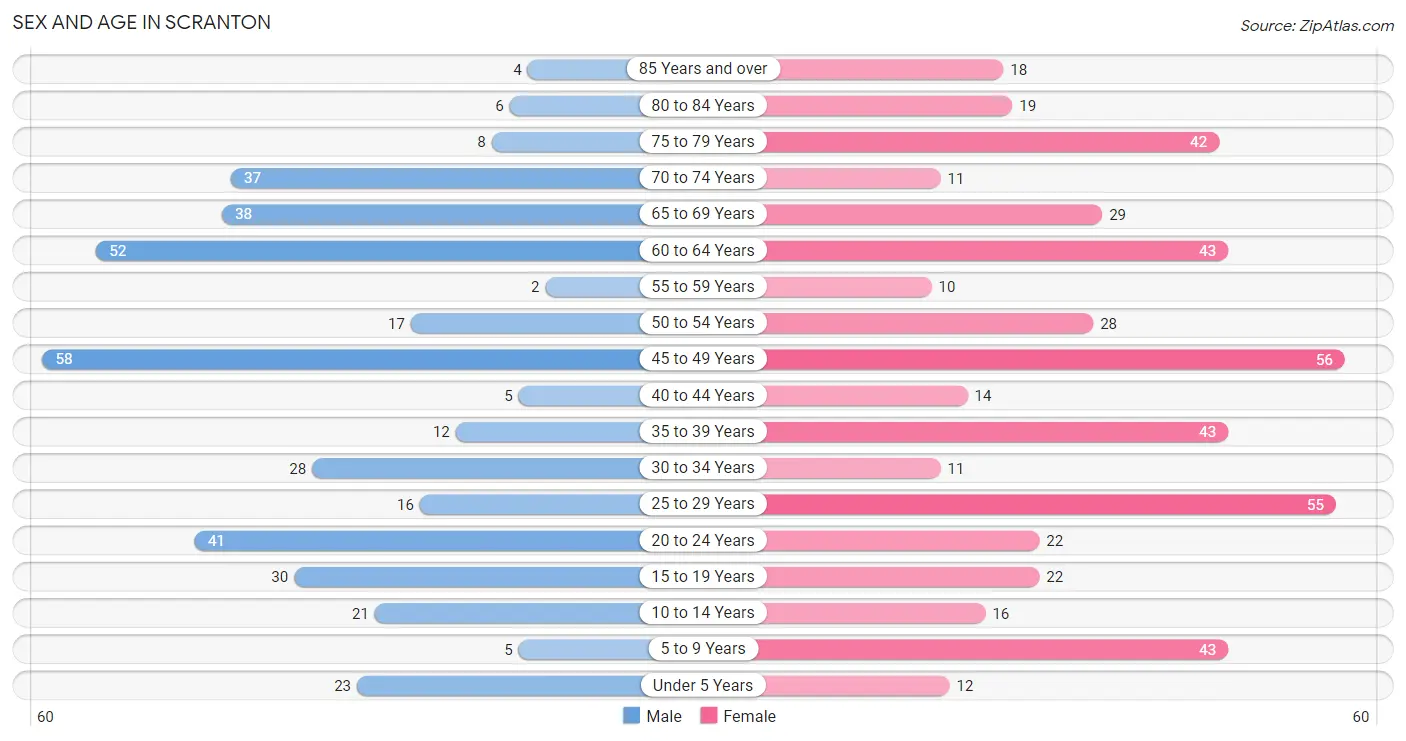
| Age Bracket | Male | Female |
| Under 5 Years | 23 (5.7%) | 12 (2.4%) |
| 5 to 9 Years | 5 (1.2%) | 43 (8.7%) |
| 10 to 14 Years | 21 (5.2%) | 16 (3.2%) |
| 15 to 19 Years | 30 (7.4%) | 22 (4.4%) |
| 20 to 24 Years | 41 (10.2%) | 22 (4.4%) |
| 25 to 29 Years | 16 (4.0%) | 55 (11.1%) |
| 30 to 34 Years | 28 (7.0%) | 11 (2.2%) |
| 35 to 39 Years | 12 (3.0%) | 43 (8.7%) |
| 40 to 44 Years | 5 (1.2%) | 14 (2.8%) |
| 45 to 49 Years | 58 (14.4%) | 56 (11.3%) |
| 50 to 54 Years | 17 (4.2%) | 28 (5.7%) |
| 55 to 59 Years | 2 (0.5%) | 10 (2.0%) |
| 60 to 64 Years | 52 (12.9%) | 43 (8.7%) |
| 65 to 69 Years | 38 (9.4%) | 29 (5.9%) |
| 70 to 74 Years | 37 (9.2%) | 11 (2.2%) |
| 75 to 79 Years | 8 (2.0%) | 42 (8.5%) |
| 80 to 84 Years | 6 (1.5%) | 19 (3.8%) |
| 85 Years and over | 4 (1.0%) | 18 (3.6%) |
| Total | 403 (100.0%) | 494 (100.0%) |
Families and Households in Scranton
Median Family Size in Scranton
The median family size in Scranton is 3.50 persons per family, with single female/mother families (56 | 30.4%) accounting for the largest median family size of 4.71 persons per family. On the other hand, single male/father families (17 | 9.2%) represent the smallest median family size with 2.24 persons per family.
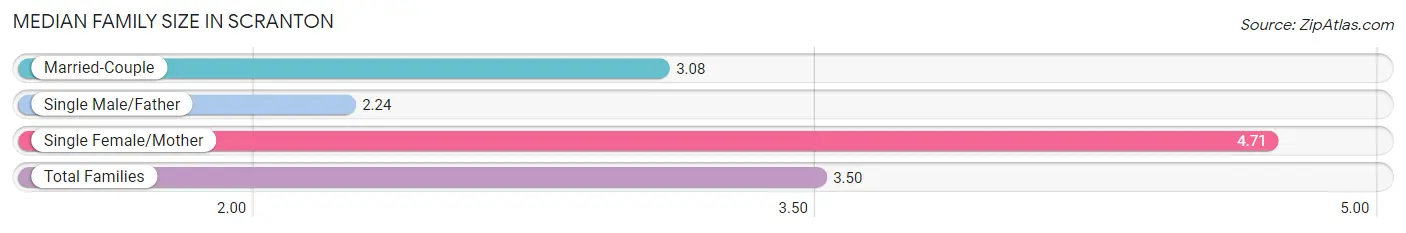
| Family Type | # Families | Family Size |
| Married-Couple | 111 (60.3%) | 3.08 |
| Single Male/Father | 17 (9.2%) | 2.24 |
| Single Female/Mother | 56 (30.4%) | 4.71 |
| Total Families | 184 (100.0%) | 3.50 |
Median Household Size in Scranton
The median household size in Scranton is 2.90 persons per household, with single female/mother households (56 | 20.4%) accounting for the largest median household size of 4.73 persons per household. non-family households (90 | 32.9%) represent the smallest median household size with 1.59 persons per household.
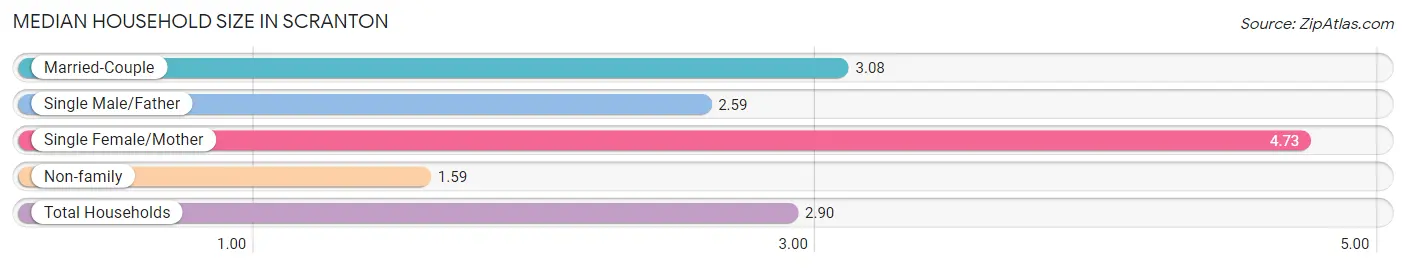
| Household Type | # Households | Household Size |
| Married-Couple | 111 (40.5%) | 3.08 |
| Single Male/Father | 17 (6.2%) | 2.59 |
| Single Female/Mother | 56 (20.4%) | 4.73 |
| Non-family | 90 (32.9%) | 1.59 |
| Total Households | 274 (100.0%) | 2.90 |
Household Size by Marriage Status in Scranton
Out of a total of 274 households in Scranton, 184 (67.1%) are family households, while 90 (32.9%) are nonfamily households. The most numerous type of family households are 3-person households, comprising 92, and the most common type of nonfamily households are 1-person households, comprising 74.
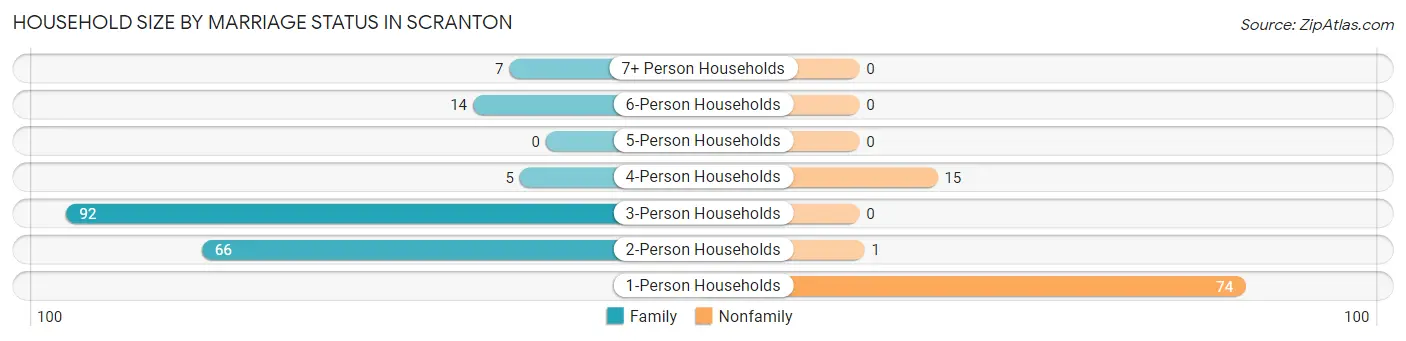
| Household Size | Family Households | Nonfamily Households |
| 1-Person Households | - | 74 (27.0%) |
| 2-Person Households | 66 (24.1%) | 1 (0.4%) |
| 3-Person Households | 92 (33.6%) | 0 (0.0%) |
| 4-Person Households | 5 (1.8%) | 15 (5.5%) |
| 5-Person Households | 0 (0.0%) | 0 (0.0%) |
| 6-Person Households | 14 (5.1%) | 0 (0.0%) |
| 7+ Person Households | 7 (2.5%) | 0 (0.0%) |
| Total | 184 (67.1%) | 90 (32.9%) |
Female Fertility in Scranton
Fertility by Age in Scranton
Average fertility rate in Scranton is 26.0 births per 1,000 women. Women in the age bracket of 20 to 34 years have the highest fertility rate with 68.0 births per 1,000 women. Women in the age bracket of 20 to 34 years acount for 100.0% of all women with births.
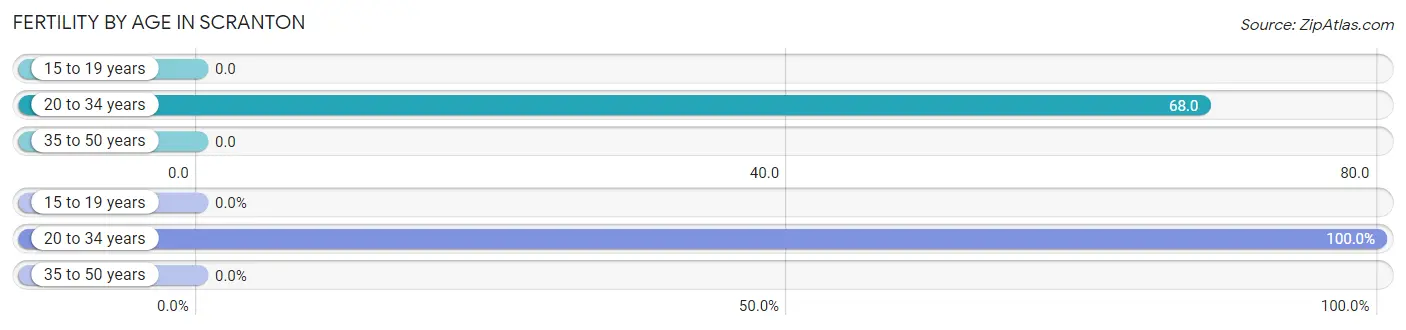
| Age Bracket | Women with Births | Births / 1,000 Women |
| 15 to 19 years | 0 (0.0%) | 0.0 |
| 20 to 34 years | 6 (100.0%) | 68.0 |
| 35 to 50 years | 0 (0.0%) | 0.0 |
| Total | 6 (100.0%) | 26.0 |
Fertility by Age by Marriage Status in Scranton
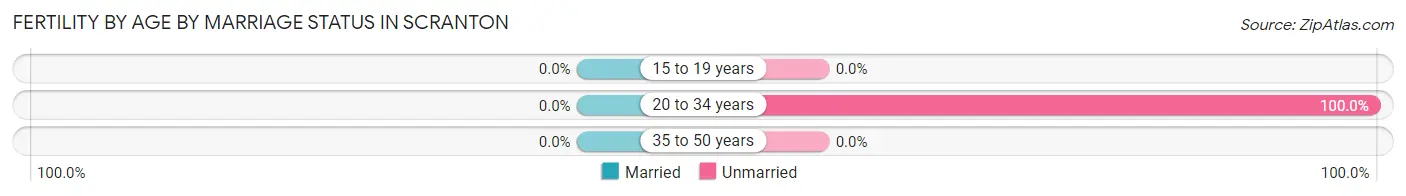
| Age Bracket | Married | Unmarried |
| 15 to 19 years | 0 (0.0%) | 0 (0.0%) |
| 20 to 34 years | 0 (0.0%) | 6 (100.0%) |
| 35 to 50 years | 0 (0.0%) | 0 (0.0%) |
| Total | 0 (0.0%) | 6 (100.0%) |
Fertility by Education in Scranton
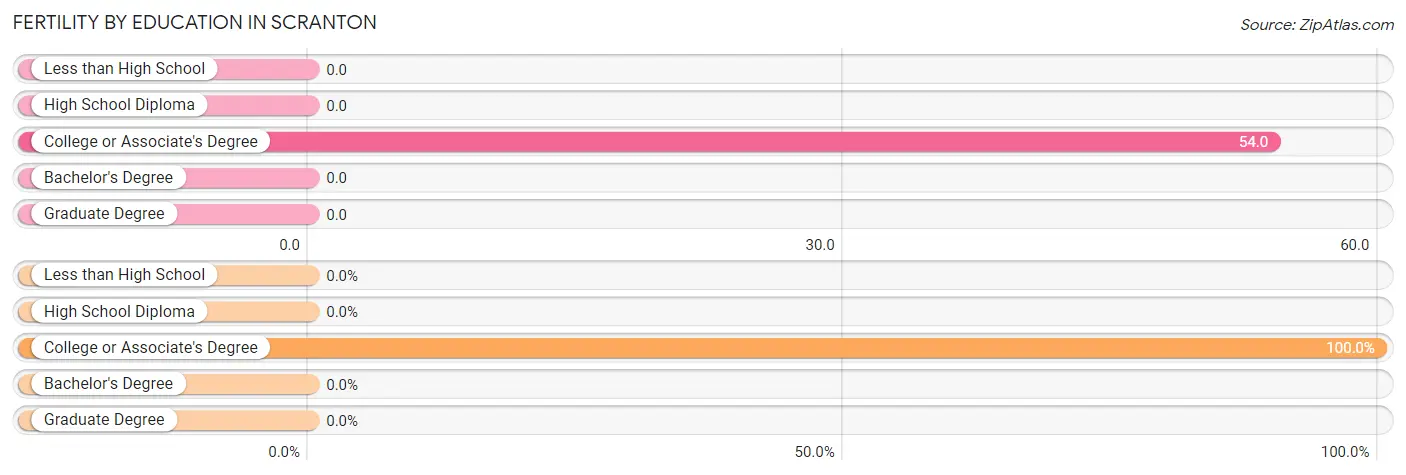
| Educational Attainment | Women with Births | Births / 1,000 Women |
| Less than High School | 0 (0.0%) | 0.0 |
| High School Diploma | 0 (0.0%) | 0.0 |
| College or Associate's Degree | 6 (100.0%) | 54.0 |
| Bachelor's Degree | 0 (0.0%) | 0.0 |
| Graduate Degree | 0 (0.0%) | 0.0 |
| Total | 6 (100.0%) | 26.0 |
Fertility by Education by Marriage Status in Scranton
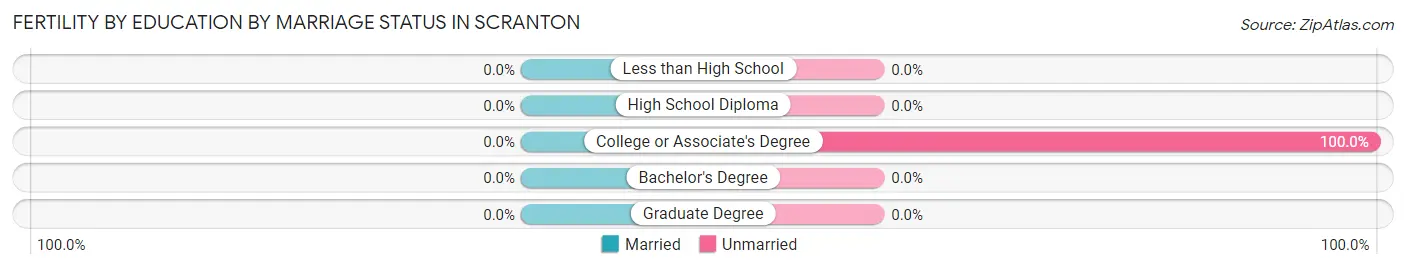
| Educational Attainment | Married | Unmarried |
| Less than High School | 0 (0.0%) | 0 (0.0%) |
| High School Diploma | 0 (0.0%) | 0 (0.0%) |
| College or Associate's Degree | 0 (0.0%) | 6 (100.0%) |
| Bachelor's Degree | 0 (0.0%) | 0 (0.0%) |
| Graduate Degree | 0 (0.0%) | 0 (0.0%) |
| Total | 0 (0.0%) | 6 (100.0%) |
Employment Characteristics in Scranton
Employment by Class of Employer in Scranton
Among the 340 employed individuals in Scranton, private company employees (261 | 76.8%), not-for-profit organizations (17 | 5.0%), and state government employees (16 | 4.7%) make up the most common classes of employment.
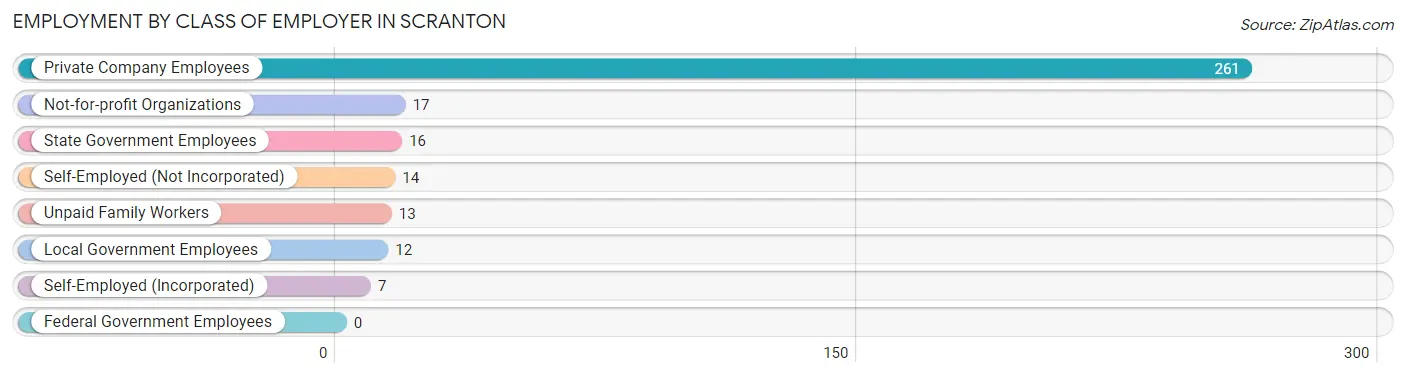
| Employer Class | # Employees | % Employees |
| Private Company Employees | 261 | 76.8% |
| Self-Employed (Incorporated) | 7 | 2.1% |
| Self-Employed (Not Incorporated) | 14 | 4.1% |
| Not-for-profit Organizations | 17 | 5.0% |
| Local Government Employees | 12 | 3.5% |
| State Government Employees | 16 | 4.7% |
| Federal Government Employees | 0 | 0.0% |
| Unpaid Family Workers | 13 | 3.8% |
| Total | 340 | 100.0% |
Employment Status by Age in Scranton
According to the labor force statistics for Scranton, out of the total population over 16 years of age (760), 45.4% or 345 individuals are in the labor force, with 1.2% or 4 of them unemployed. The age group with the highest labor force participation rate is 35 to 44 years, with 100.0% or 74 individuals in the labor force. Within the labor force, the 25 to 29 years age range has the highest percentage of unemployed individuals, with 7.3% or 4 of them being unemployed.
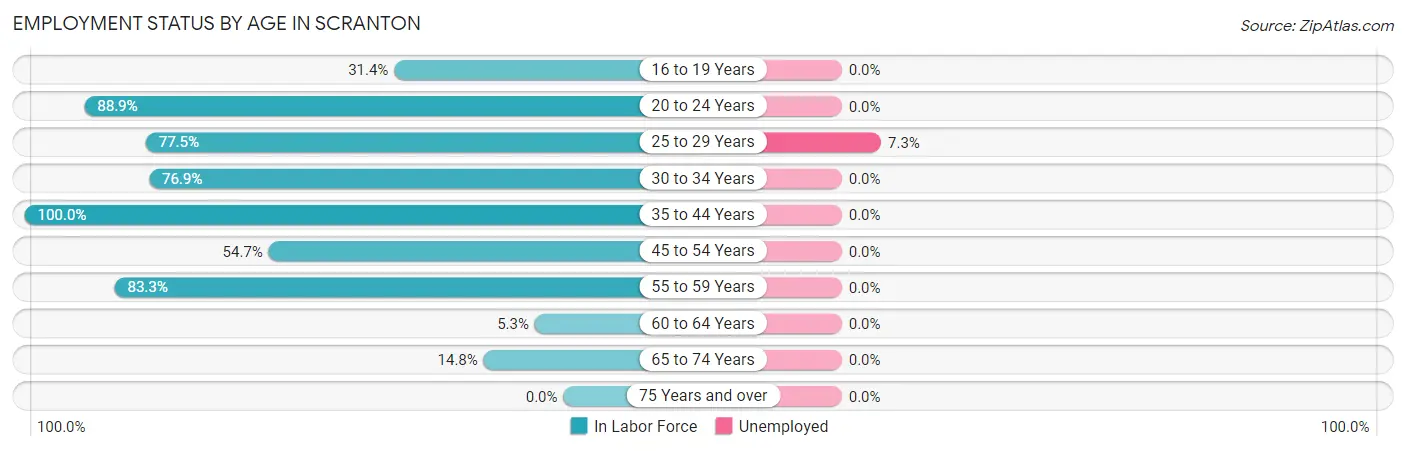
| Age Bracket | In Labor Force | Unemployed |
| 16 to 19 Years | 11 (31.4%) | 0 (0.0%) |
| 20 to 24 Years | 56 (88.9%) | 0 (0.0%) |
| 25 to 29 Years | 55 (77.5%) | 4 (7.3%) |
| 30 to 34 Years | 30 (76.9%) | 0 (0.0%) |
| 35 to 44 Years | 74 (100.0%) | 0 (0.0%) |
| 45 to 54 Years | 87 (54.7%) | 0 (0.0%) |
| 55 to 59 Years | 10 (83.3%) | 0 (0.0%) |
| 60 to 64 Years | 5 (5.3%) | 0 (0.0%) |
| 65 to 74 Years | 17 (14.8%) | 0 (0.0%) |
| 75 Years and over | 0 (0.0%) | 0 (0.0%) |
| Total | 345 (45.4%) | 4 (1.2%) |
Employment Status by Educational Attainment in Scranton
According to labor force statistics for Scranton, 58.0% of individuals (261) out of the total population between 25 and 64 years of age (450) are in the labor force, with 1.5% or 4 of them being unemployed. The group with the highest labor force participation rate are those with the educational attainment of college / associate degree, with 79.3% or 161 individuals in the labor force. Within the labor force, individuals with bachelor's degree or higher education have the highest percentage of unemployment, with 26.7% or 4 of them being unemployed.
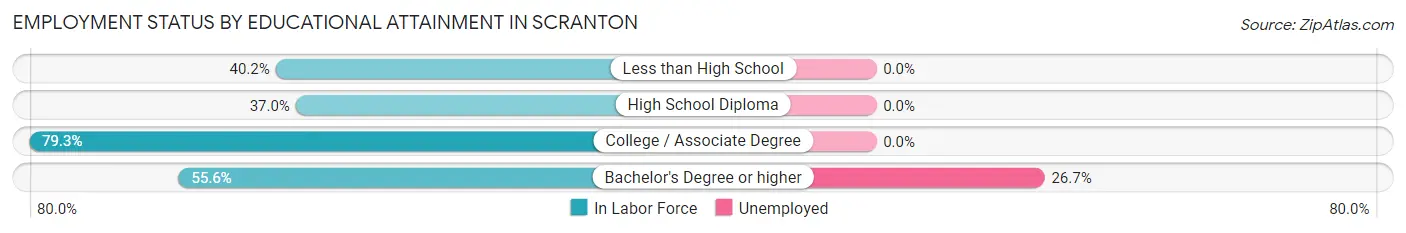
| Educational Attainment | In Labor Force | Unemployed |
| Less than High School | 45 (40.2%) | 0 (0.0%) |
| High School Diploma | 40 (37.0%) | 0 (0.0%) |
| College / Associate Degree | 161 (79.3%) | 0 (0.0%) |
| Bachelor's Degree or higher | 15 (55.6%) | 7 (26.7%) |
| Total | 261 (58.0%) | 7 (1.5%) |
Employment Occupations by Sex in Scranton
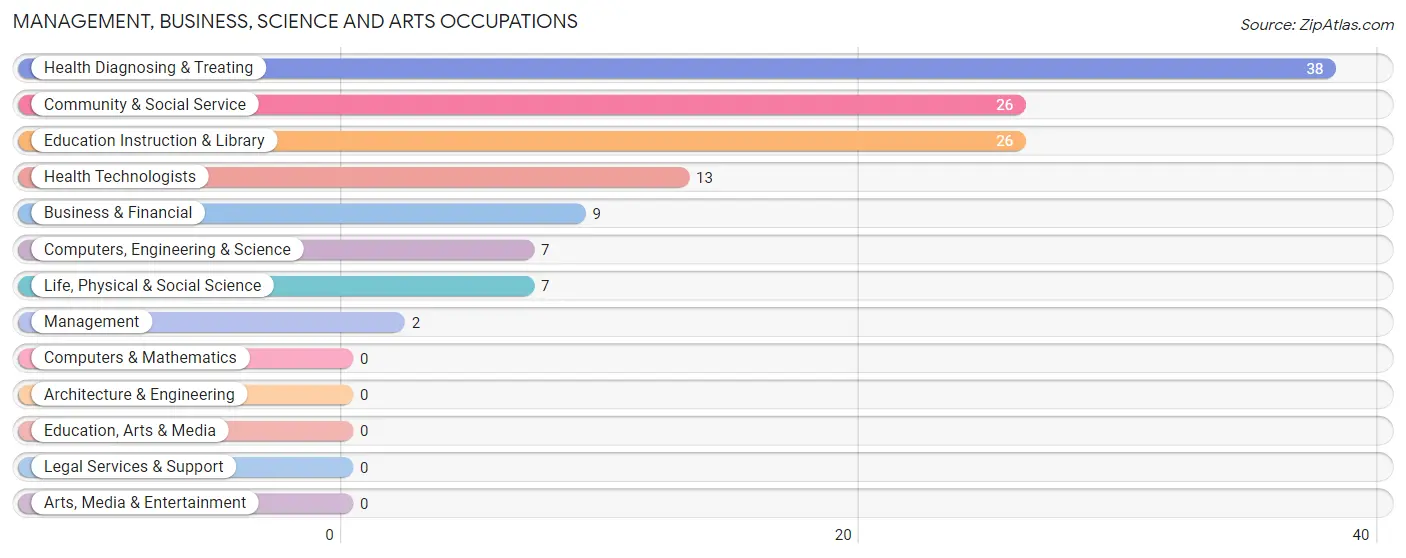
Management, Business, Science and Arts Occupations
The most common Management, Business, Science and Arts occupations in Scranton are Health Diagnosing & Treating (38 | 11.1%), Community & Social Service (26 | 7.6%), Education Instruction & Library (26 | 7.6%), Health Technologists (13 | 3.8%), and Business & Financial (9 | 2.6%).
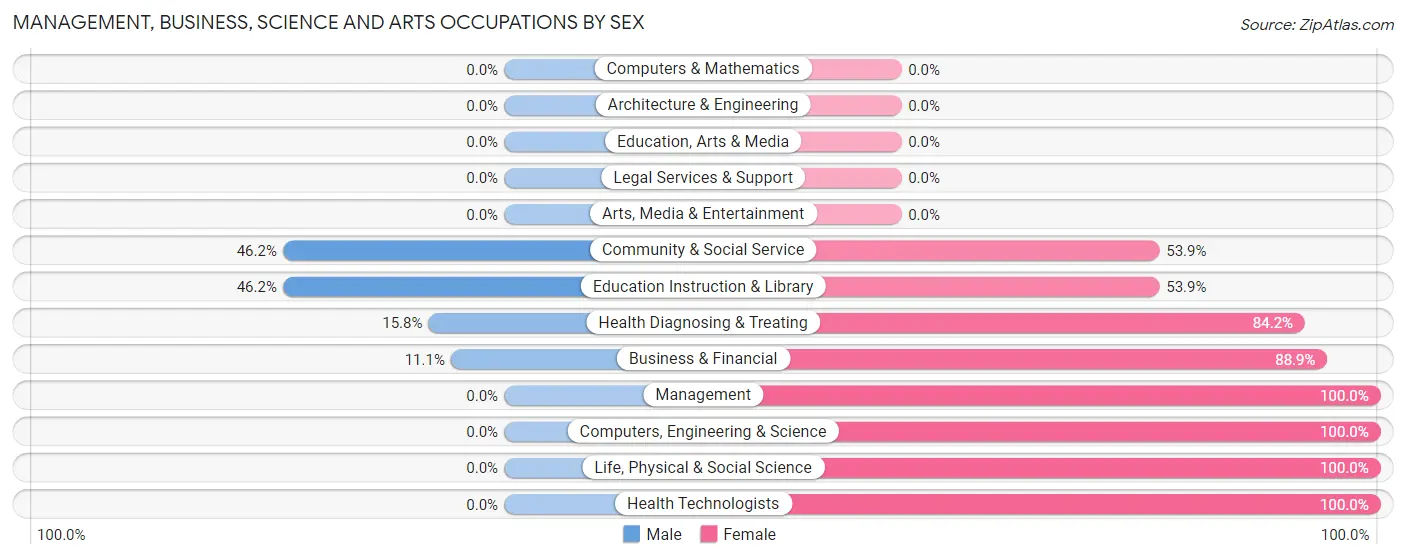
Management, Business, Science and Arts Occupations by Sex
Within the Management, Business, Science and Arts occupations in Scranton, the most male-oriented occupations are Community & Social Service (46.2%), Education Instruction & Library (46.2%), and Health Diagnosing & Treating (15.8%), while the most female-oriented occupations are Management (100.0%), Computers, Engineering & Science (100.0%), and Life, Physical & Social Science (100.0%).
| Occupation | Male | Female |
| Management | 0 (0.0%) | 2 (100.0%) |
| Business & Financial | 1 (11.1%) | 8 (88.9%) |
| Computers, Engineering & Science | 0 (0.0%) | 7 (100.0%) |
| Computers & Mathematics | 0 (0.0%) | 0 (0.0%) |
| Architecture & Engineering | 0 (0.0%) | 0 (0.0%) |
| Life, Physical & Social Science | 0 (0.0%) | 7 (100.0%) |
| Community & Social Service | 12 (46.2%) | 14 (53.8%) |
| Education, Arts & Media | 0 (0.0%) | 0 (0.0%) |
| Legal Services & Support | 0 (0.0%) | 0 (0.0%) |
| Education Instruction & Library | 12 (46.2%) | 14 (53.8%) |
| Arts, Media & Entertainment | 0 (0.0%) | 0 (0.0%) |
| Health Diagnosing & Treating | 6 (15.8%) | 32 (84.2%) |
| Health Technologists | 0 (0.0%) | 13 (100.0%) |
| Total (Category) | 19 (23.2%) | 63 (76.8%) |
| Total (Overall) | 140 (41.1%) | 201 (58.9%) |
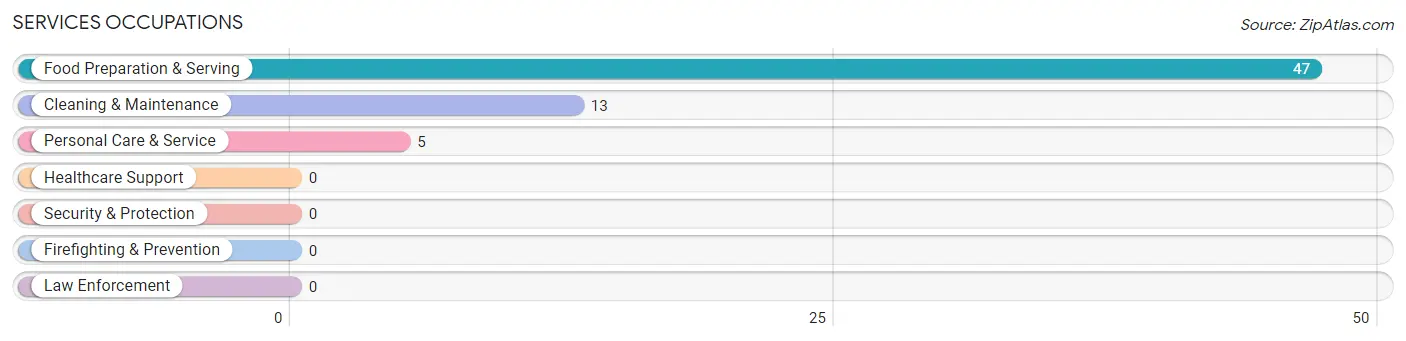
Services Occupations
The most common Services occupations in Scranton are Food Preparation & Serving (47 | 13.8%), Cleaning & Maintenance (13 | 3.8%), and Personal Care & Service (5 | 1.5%).
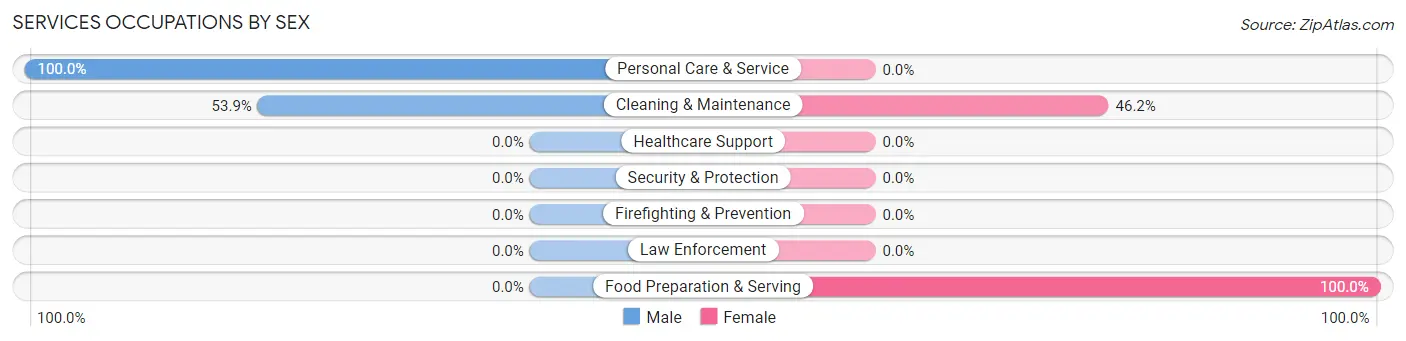
Services Occupations by Sex
Within the Services occupations in Scranton, the most male-oriented occupations are Personal Care & Service (100.0%), and Cleaning & Maintenance (53.8%), while the most female-oriented occupations are Food Preparation & Serving (100.0%), and Cleaning & Maintenance (46.2%).
| Occupation | Male | Female |
| Healthcare Support | 0 (0.0%) | 0 (0.0%) |
| Security & Protection | 0 (0.0%) | 0 (0.0%) |
| Firefighting & Prevention | 0 (0.0%) | 0 (0.0%) |
| Law Enforcement | 0 (0.0%) | 0 (0.0%) |
| Food Preparation & Serving | 0 (0.0%) | 47 (100.0%) |
| Cleaning & Maintenance | 7 (53.8%) | 6 (46.2%) |
| Personal Care & Service | 5 (100.0%) | 0 (0.0%) |
| Total (Category) | 12 (18.5%) | 53 (81.5%) |
| Total (Overall) | 140 (41.1%) | 201 (58.9%) |
Sales and Office Occupations
The most common Sales and Office occupations in Scranton are Sales & Related (53 | 15.5%), and Office & Administration (32 | 9.4%).
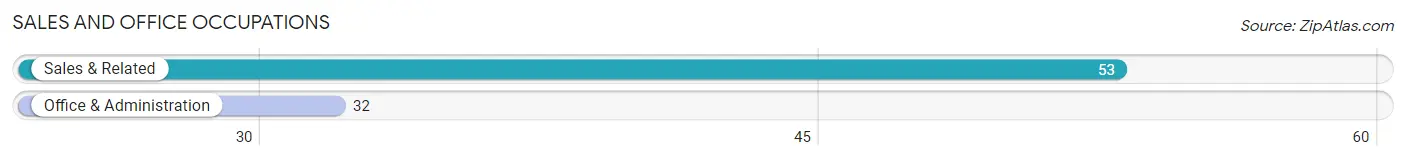
Sales and Office Occupations by Sex
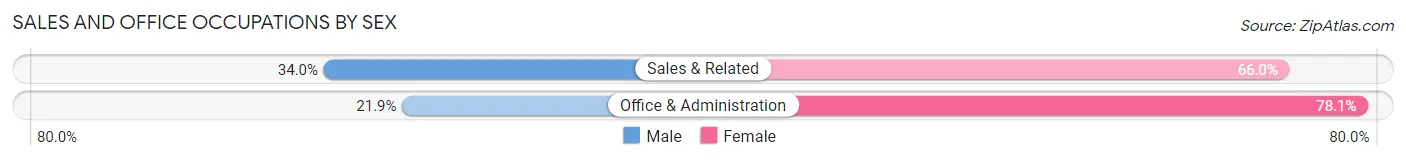
| Occupation | Male | Female |
| Sales & Related | 18 (34.0%) | 35 (66.0%) |
| Office & Administration | 7 (21.9%) | 25 (78.1%) |
| Total (Category) | 25 (29.4%) | 60 (70.6%) |
| Total (Overall) | 140 (41.1%) | 201 (58.9%) |
Natural Resources, Construction and Maintenance Occupations
The most common Natural Resources, Construction and Maintenance occupations in Scranton are , and Construction & Extraction (13 | 3.8%).
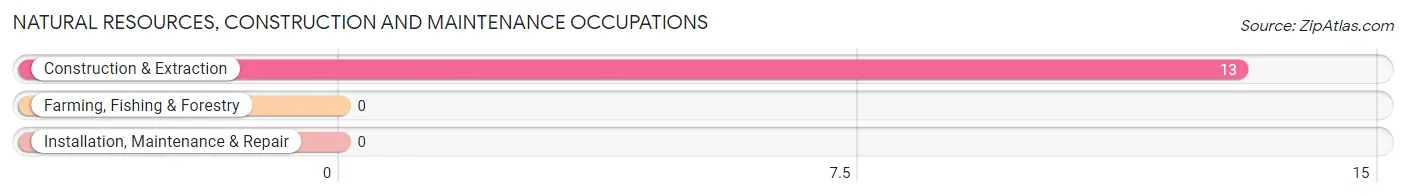
Natural Resources, Construction and Maintenance Occupations by Sex
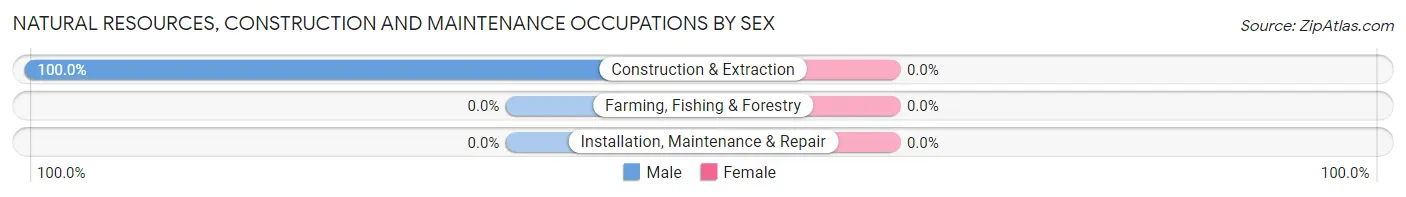
| Occupation | Male | Female |
| Farming, Fishing & Forestry | 0 (0.0%) | 0 (0.0%) |
| Construction & Extraction | 13 (100.0%) | 0 (0.0%) |
| Installation, Maintenance & Repair | 0 (0.0%) | 0 (0.0%) |
| Total (Category) | 13 (100.0%) | 0 (0.0%) |
| Total (Overall) | 140 (41.1%) | 201 (58.9%) |
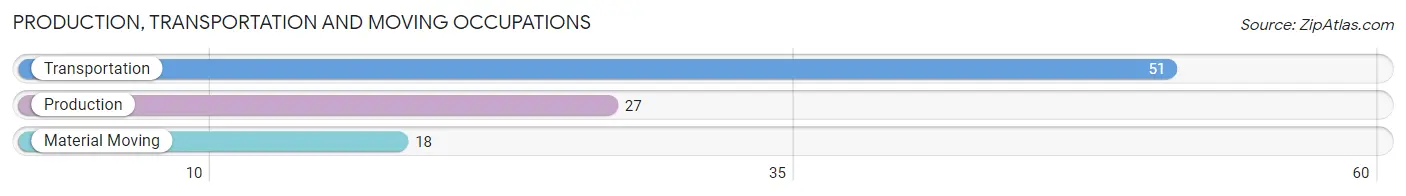
Production, Transportation and Moving Occupations
The most common Production, Transportation and Moving occupations in Scranton are Transportation (51 | 15.0%), Production (27 | 7.9%), and Material Moving (18 | 5.3%).
Production, Transportation and Moving Occupations by Sex
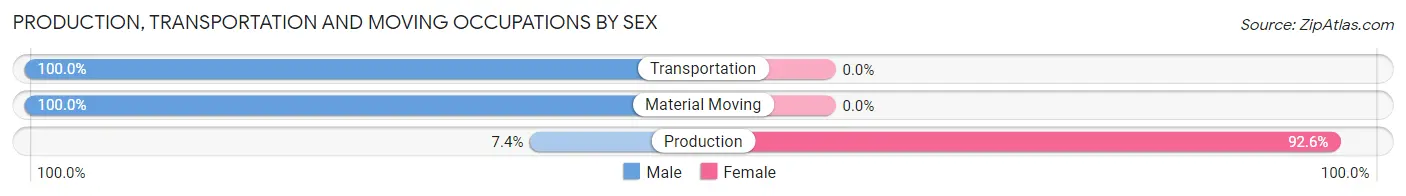
| Occupation | Male | Female |
| Production | 2 (7.4%) | 25 (92.6%) |
| Transportation | 51 (100.0%) | 0 (0.0%) |
| Material Moving | 18 (100.0%) | 0 (0.0%) |
| Total (Category) | 71 (74.0%) | 25 (26.0%) |
| Total (Overall) | 140 (41.1%) | 201 (58.9%) |
Employment Industries by Sex in Scranton
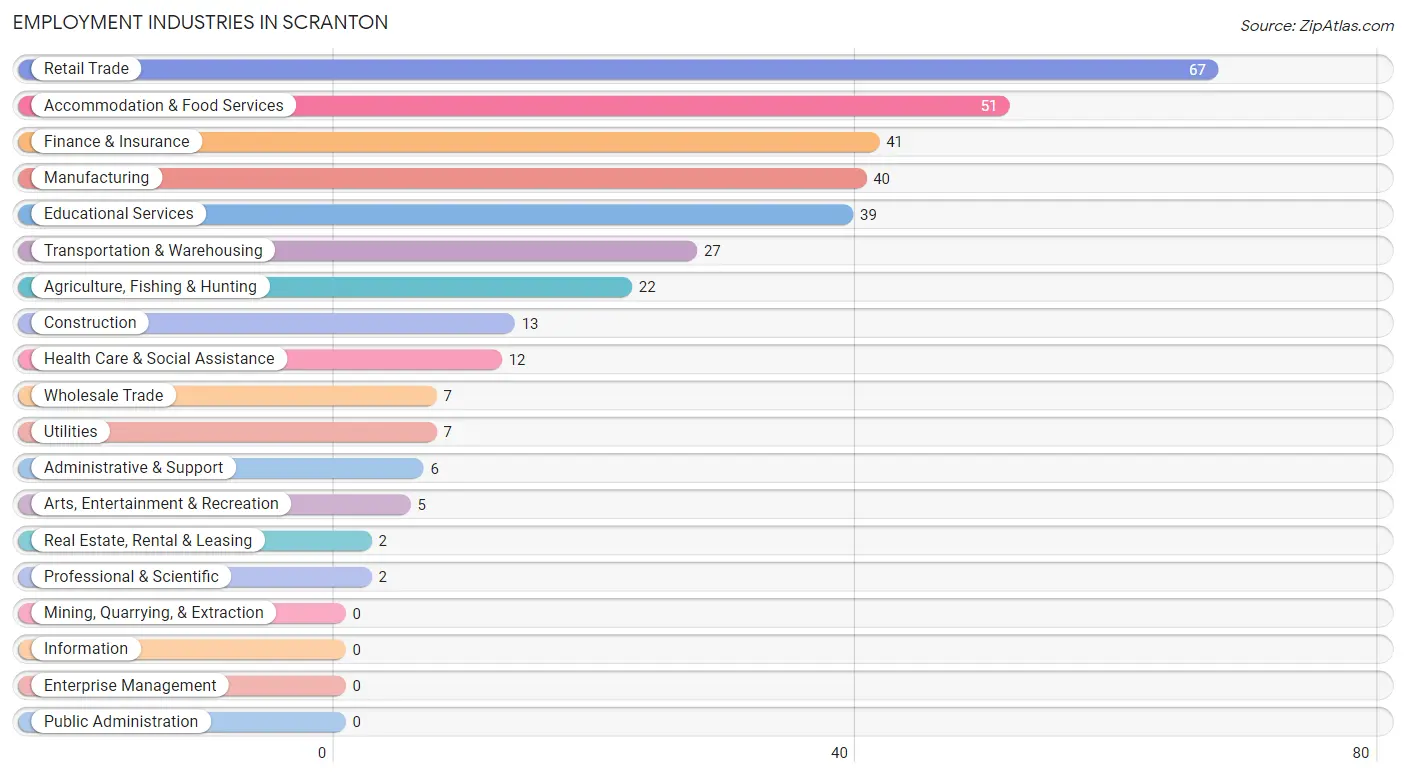
Employment Industries in Scranton
The major employment industries in Scranton include Retail Trade (67 | 19.7%), Accommodation & Food Services (51 | 15.0%), Finance & Insurance (41 | 12.0%), Manufacturing (40 | 11.7%), and Educational Services (39 | 11.4%).
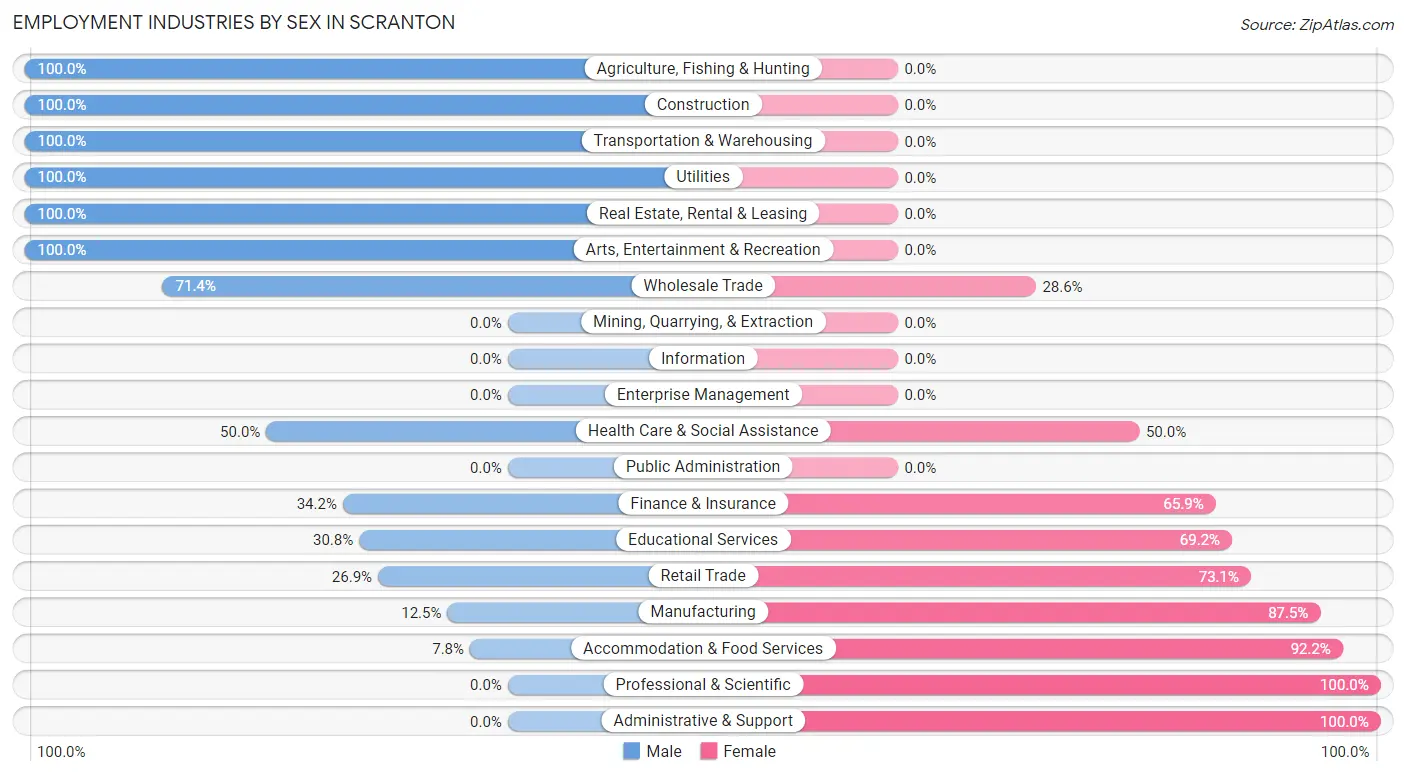
Employment Industries by Sex in Scranton
The Scranton industries that see more men than women are Agriculture, Fishing & Hunting (100.0%), Construction (100.0%), and Transportation & Warehousing (100.0%), whereas the industries that tend to have a higher number of women are Professional & Scientific (100.0%), Administrative & Support (100.0%), and Accommodation & Food Services (92.2%).
| Industry | Male | Female |
| Agriculture, Fishing & Hunting | 22 (100.0%) | 0 (0.0%) |
| Mining, Quarrying, & Extraction | 0 (0.0%) | 0 (0.0%) |
| Construction | 13 (100.0%) | 0 (0.0%) |
| Manufacturing | 5 (12.5%) | 35 (87.5%) |
| Wholesale Trade | 5 (71.4%) | 2 (28.6%) |
| Retail Trade | 18 (26.9%) | 49 (73.1%) |
| Transportation & Warehousing | 27 (100.0%) | 0 (0.0%) |
| Utilities | 7 (100.0%) | 0 (0.0%) |
| Information | 0 (0.0%) | 0 (0.0%) |
| Finance & Insurance | 14 (34.2%) | 27 (65.8%) |
| Real Estate, Rental & Leasing | 2 (100.0%) | 0 (0.0%) |
| Professional & Scientific | 0 (0.0%) | 2 (100.0%) |
| Enterprise Management | 0 (0.0%) | 0 (0.0%) |
| Administrative & Support | 0 (0.0%) | 6 (100.0%) |
| Educational Services | 12 (30.8%) | 27 (69.2%) |
| Health Care & Social Assistance | 6 (50.0%) | 6 (50.0%) |
| Arts, Entertainment & Recreation | 5 (100.0%) | 0 (0.0%) |
| Accommodation & Food Services | 4 (7.8%) | 47 (92.2%) |
| Public Administration | 0 (0.0%) | 0 (0.0%) |
| Total | 140 (41.1%) | 201 (58.9%) |
Education in Scranton
School Enrollment in Scranton
The most common levels of schooling among the 173 students in Scranton are high school (63 | 36.4%), middle school (47 | 27.2%), and kindergarten (27 | 15.6%).
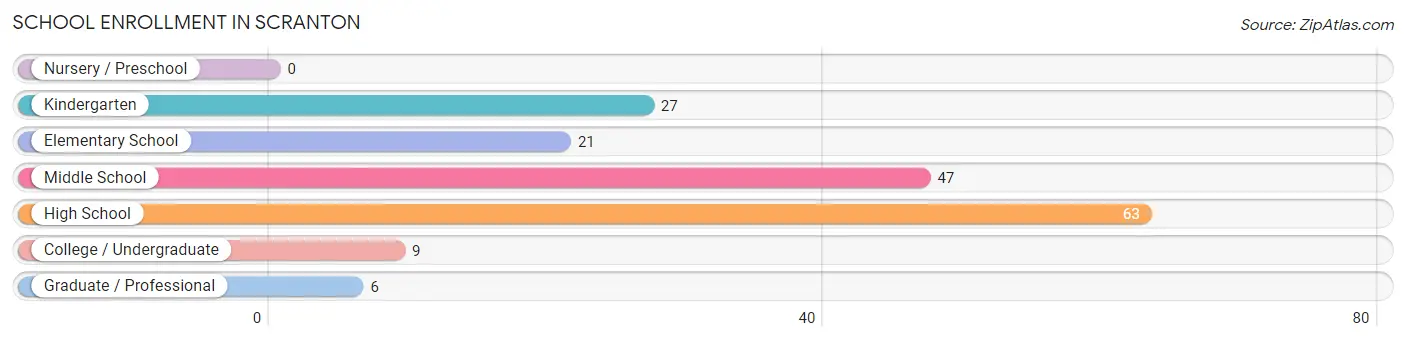
| School Level | # Students | % Students |
| Nursery / Preschool | 0 | 0.0% |
| Kindergarten | 27 | 15.6% |
| Elementary School | 21 | 12.1% |
| Middle School | 47 | 27.2% |
| High School | 63 | 36.4% |
| College / Undergraduate | 9 | 5.2% |
| Graduate / Professional | 6 | 3.5% |
| Total | 173 | 100.0% |
School Enrollment by Age by Funding Source in Scranton
Out of a total of 173 students who are enrolled in schools in Scranton, 4 (2.3%) attend a private institution, while the remaining 169 (97.7%) are enrolled in public schools. The age group of 15 to 17 year olds has the highest likelihood of being enrolled in private schools, with 4 (10.5% in the age bracket) enrolled. Conversely, the age group of 5 to 9 year old has the lowest likelihood of being enrolled in a private school, with 48 (100.0% in the age bracket) attending a public institution.
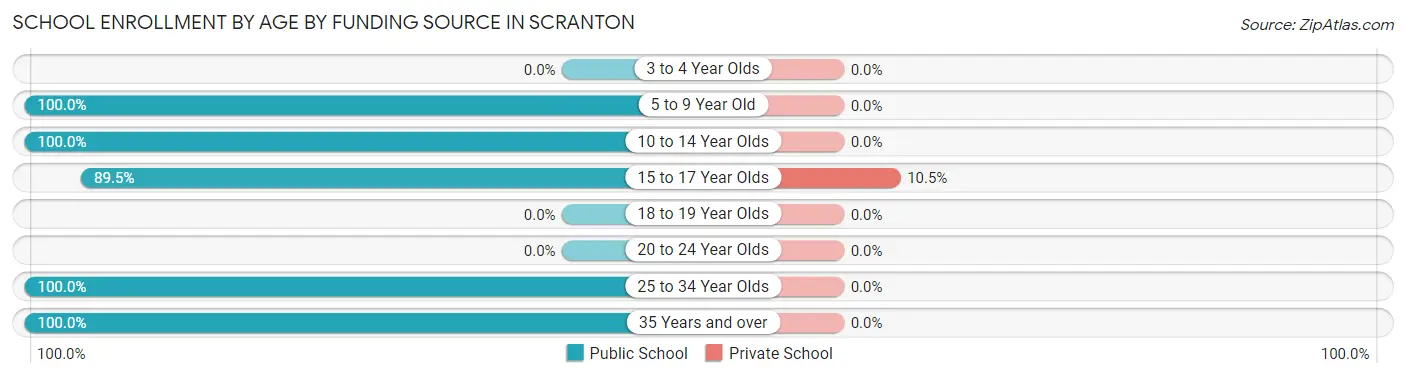
| Age Bracket | Public School | Private School |
| 3 to 4 Year Olds | 0 (0.0%) | 0 (0.0%) |
| 5 to 9 Year Old | 48 (100.0%) | 0 (0.0%) |
| 10 to 14 Year Olds | 37 (100.0%) | 0 (0.0%) |
| 15 to 17 Year Olds | 34 (89.5%) | 4 (10.5%) |
| 18 to 19 Year Olds | 0 (0.0%) | 0 (0.0%) |
| 20 to 24 Year Olds | 0 (0.0%) | 0 (0.0%) |
| 25 to 34 Year Olds | 4 (100.0%) | 0 (0.0%) |
| 35 Years and over | 46 (100.0%) | 0 (0.0%) |
| Total | 169 (97.7%) | 4 (2.3%) |
Educational Attainment by Field of Study in Scranton
Bio, nature & agricultural (15 | 31.2%), science & technology (11 | 22.9%), education (10 | 20.8%), physical & health sciences (8 | 16.7%), and business (4 | 8.3%) are the most common fields of study among 48 individuals in Scranton who have obtained a bachelor's degree or higher.
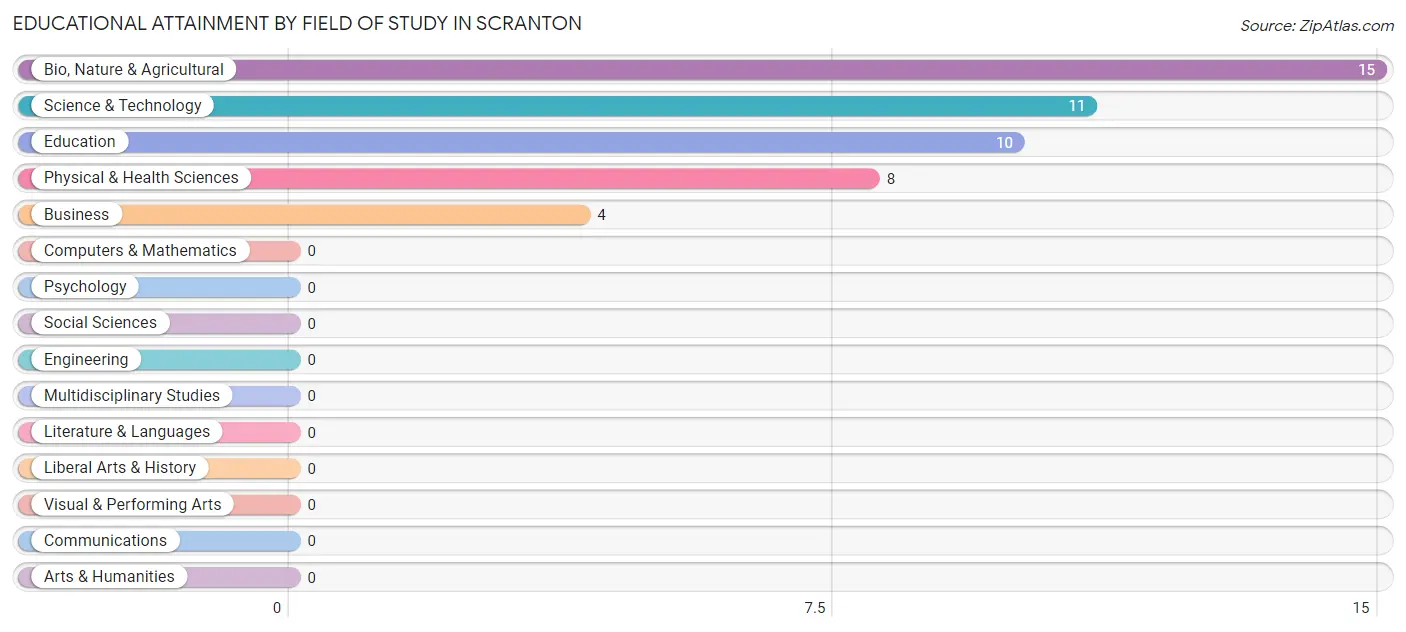
| Field of Study | # Graduates | % Graduates |
| Computers & Mathematics | 0 | 0.0% |
| Bio, Nature & Agricultural | 15 | 31.2% |
| Physical & Health Sciences | 8 | 16.7% |
| Psychology | 0 | 0.0% |
| Social Sciences | 0 | 0.0% |
| Engineering | 0 | 0.0% |
| Multidisciplinary Studies | 0 | 0.0% |
| Science & Technology | 11 | 22.9% |
| Business | 4 | 8.3% |
| Education | 10 | 20.8% |
| Literature & Languages | 0 | 0.0% |
| Liberal Arts & History | 0 | 0.0% |
| Visual & Performing Arts | 0 | 0.0% |
| Communications | 0 | 0.0% |
| Arts & Humanities | 0 | 0.0% |
| Total | 48 | 100.0% |
Transportation & Commute in Scranton
Vehicle Availability by Sex in Scranton
The most prevalent vehicle ownership categories in Scranton are males with 3 vehicles (54, accounting for 38.6%) and females with 3 vehicles (60, making up 27.0%).
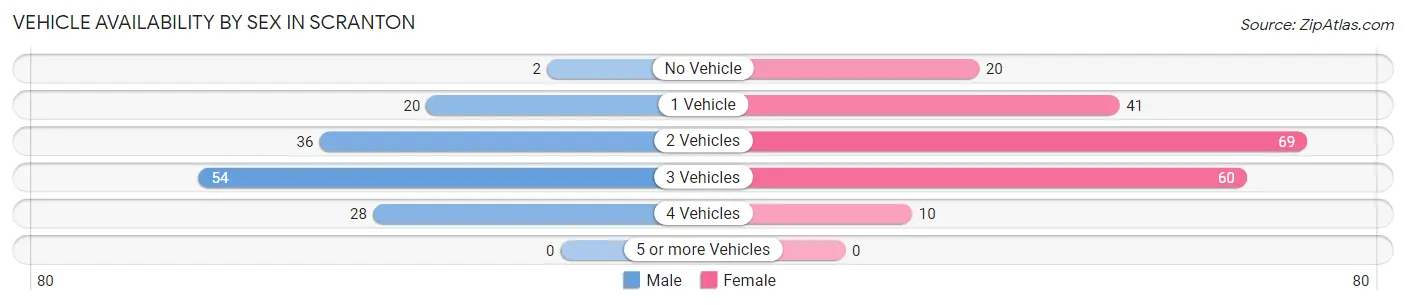
| Vehicles Available | Male | Female |
| No Vehicle | 2 (1.4%) | 20 (10.0%) |
| 1 Vehicle | 20 (14.3%) | 41 (20.5%) |
| 2 Vehicles | 36 (25.7%) | 69 (34.5%) |
| 3 Vehicles | 54 (38.6%) | 60 (30.0%) |
| 4 Vehicles | 28 (20.0%) | 10 (5.0%) |
| 5 or more Vehicles | 0 (0.0%) | 0 (0.0%) |
| Total | 140 (100.0%) | 200 (100.0%) |
Commute Time in Scranton
The most frequently occuring commute durations in Scranton are 30 to 34 minutes (93 commuters, 30.2%), 45 to 59 minutes (69 commuters, 22.4%), and 20 to 24 minutes (45 commuters, 14.6%).
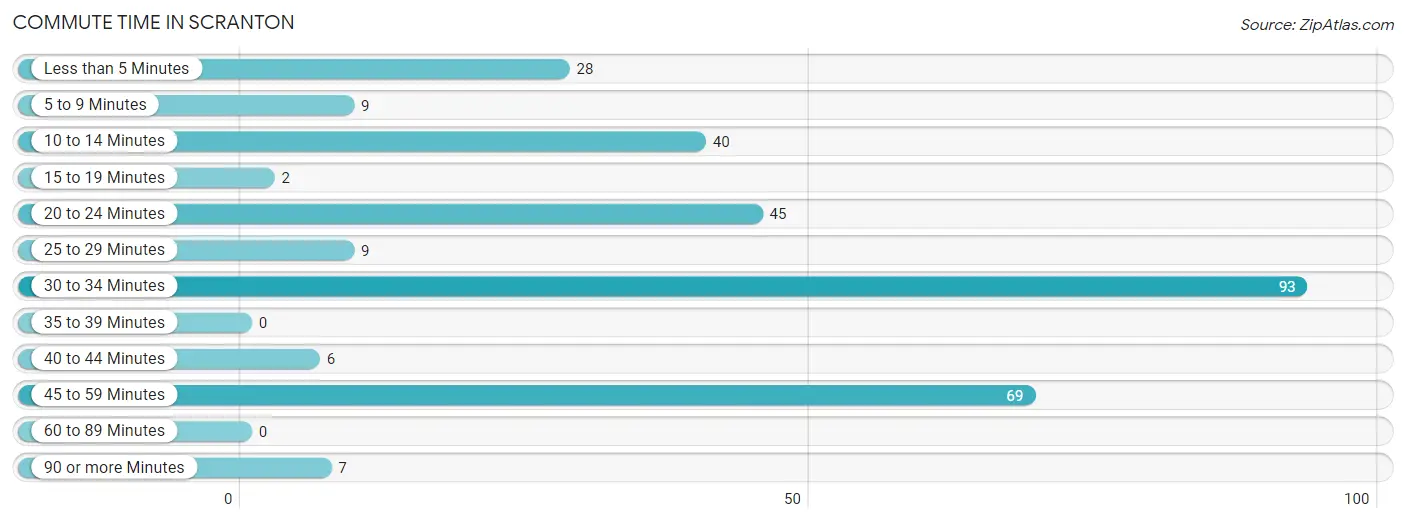
| Commute Time | # Commuters | % Commuters |
| Less than 5 Minutes | 28 | 9.1% |
| 5 to 9 Minutes | 9 | 2.9% |
| 10 to 14 Minutes | 40 | 13.0% |
| 15 to 19 Minutes | 2 | 0.6% |
| 20 to 24 Minutes | 45 | 14.6% |
| 25 to 29 Minutes | 9 | 2.9% |
| 30 to 34 Minutes | 93 | 30.2% |
| 35 to 39 Minutes | 0 | 0.0% |
| 40 to 44 Minutes | 6 | 1.9% |
| 45 to 59 Minutes | 69 | 22.4% |
| 60 to 89 Minutes | 0 | 0.0% |
| 90 or more Minutes | 7 | 2.3% |
Commute Time by Sex in Scranton
The most common commute times in Scranton are 45 to 59 minutes (40 commuters, 31.8%) for males and 30 to 34 minutes (80 commuters, 44.0%) for females.
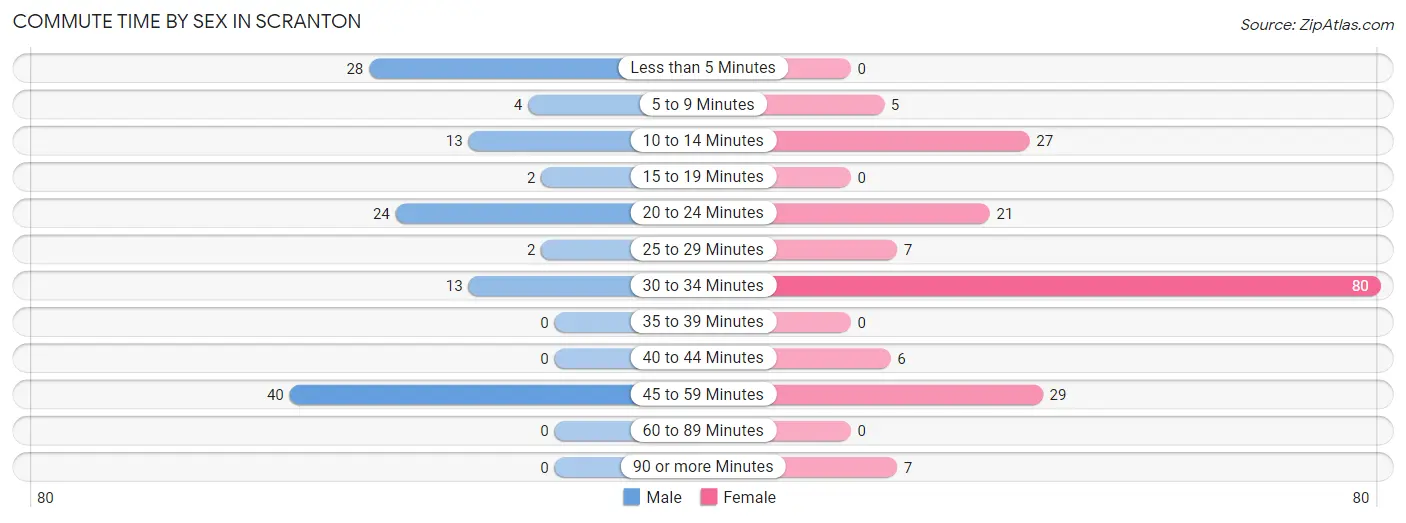
| Commute Time | Male | Female |
| Less than 5 Minutes | 28 (22.2%) | 0 (0.0%) |
| 5 to 9 Minutes | 4 (3.2%) | 5 (2.8%) |
| 10 to 14 Minutes | 13 (10.3%) | 27 (14.8%) |
| 15 to 19 Minutes | 2 (1.6%) | 0 (0.0%) |
| 20 to 24 Minutes | 24 (19.1%) | 21 (11.5%) |
| 25 to 29 Minutes | 2 (1.6%) | 7 (3.8%) |
| 30 to 34 Minutes | 13 (10.3%) | 80 (44.0%) |
| 35 to 39 Minutes | 0 (0.0%) | 0 (0.0%) |
| 40 to 44 Minutes | 0 (0.0%) | 6 (3.3%) |
| 45 to 59 Minutes | 40 (31.8%) | 29 (15.9%) |
| 60 to 89 Minutes | 0 (0.0%) | 0 (0.0%) |
| 90 or more Minutes | 0 (0.0%) | 7 (3.8%) |
Time of Departure to Work by Sex in Scranton
The most frequent times of departure to work in Scranton are 4:00 PM to 11:59 PM (31, 24.6%) for males and 7:00 AM to 7:29 AM (63, 34.6%) for females.
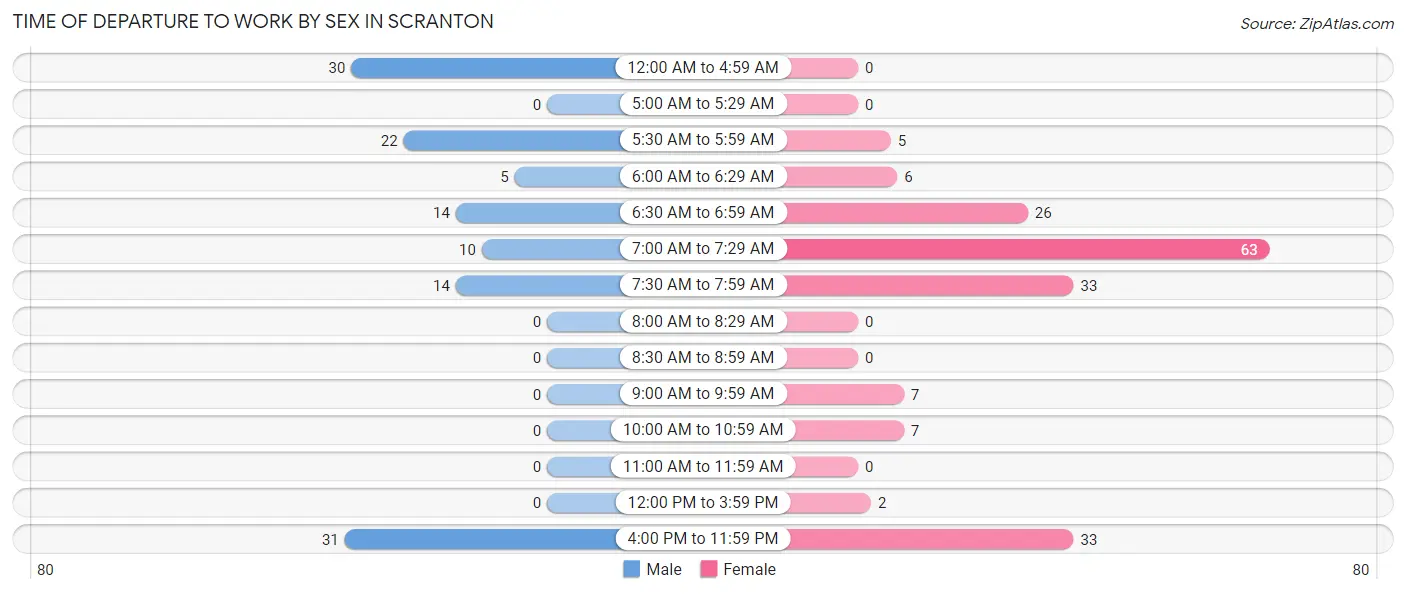
| Time of Departure | Male | Female |
| 12:00 AM to 4:59 AM | 30 (23.8%) | 0 (0.0%) |
| 5:00 AM to 5:29 AM | 0 (0.0%) | 0 (0.0%) |
| 5:30 AM to 5:59 AM | 22 (17.5%) | 5 (2.8%) |
| 6:00 AM to 6:29 AM | 5 (4.0%) | 6 (3.3%) |
| 6:30 AM to 6:59 AM | 14 (11.1%) | 26 (14.3%) |
| 7:00 AM to 7:29 AM | 10 (7.9%) | 63 (34.6%) |
| 7:30 AM to 7:59 AM | 14 (11.1%) | 33 (18.1%) |
| 8:00 AM to 8:29 AM | 0 (0.0%) | 0 (0.0%) |
| 8:30 AM to 8:59 AM | 0 (0.0%) | 0 (0.0%) |
| 9:00 AM to 9:59 AM | 0 (0.0%) | 7 (3.8%) |
| 10:00 AM to 10:59 AM | 0 (0.0%) | 7 (3.8%) |
| 11:00 AM to 11:59 AM | 0 (0.0%) | 0 (0.0%) |
| 12:00 PM to 3:59 PM | 0 (0.0%) | 2 (1.1%) |
| 4:00 PM to 11:59 PM | 31 (24.6%) | 33 (18.1%) |
| Total | 126 (100.0%) | 182 (100.0%) |
Housing Occupancy in Scranton
Occupancy by Ownership in Scranton
Of the total 274 dwellings in Scranton, owner-occupied units account for 122 (44.5%), while renter-occupied units make up 152 (55.5%).
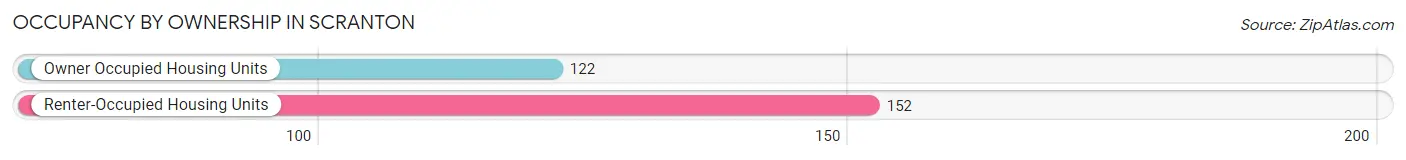
| Occupancy | # Housing Units | % Housing Units |
| Owner Occupied Housing Units | 122 | 44.5% |
| Renter-Occupied Housing Units | 152 | 55.5% |
| Total Occupied Housing Units | 274 | 100.0% |
Occupancy by Household Size in Scranton
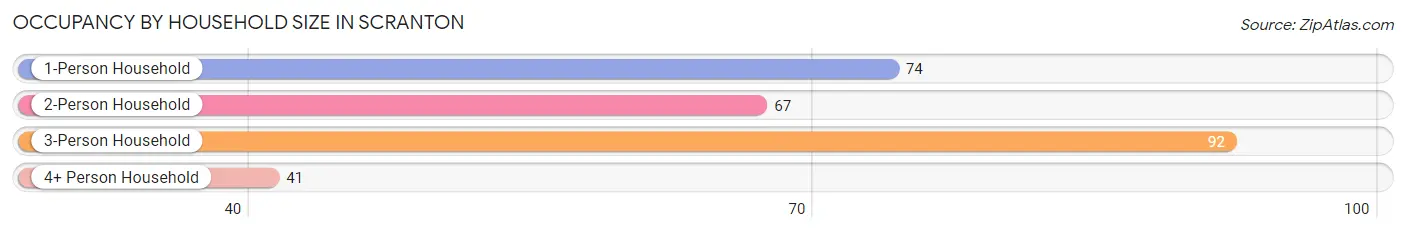
| Household Size | # Housing Units | % Housing Units |
| 1-Person Household | 74 | 27.0% |
| 2-Person Household | 67 | 24.4% |
| 3-Person Household | 92 | 33.6% |
| 4+ Person Household | 41 | 15.0% |
| Total Housing Units | 274 | 100.0% |
Occupancy by Ownership by Household Size in Scranton
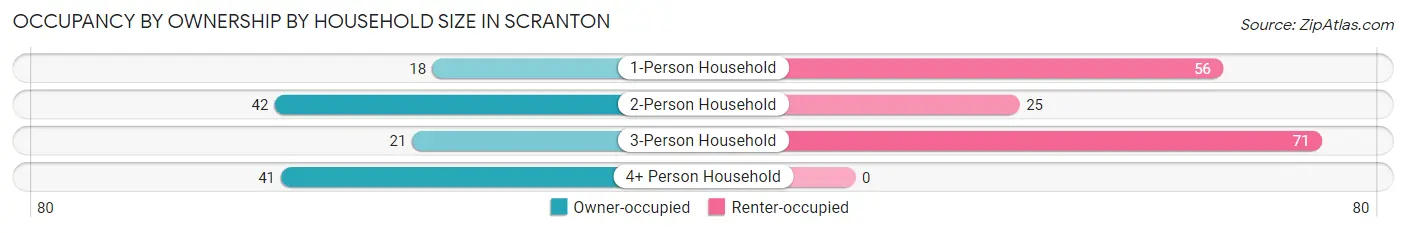
| Household Size | Owner-occupied | Renter-occupied |
| 1-Person Household | 18 (24.3%) | 56 (75.7%) |
| 2-Person Household | 42 (62.7%) | 25 (37.3%) |
| 3-Person Household | 21 (22.8%) | 71 (77.2%) |
| 4+ Person Household | 41 (100.0%) | 0 (0.0%) |
| Total Housing Units | 122 (44.5%) | 152 (55.5%) |
Occupancy by Educational Attainment in Scranton
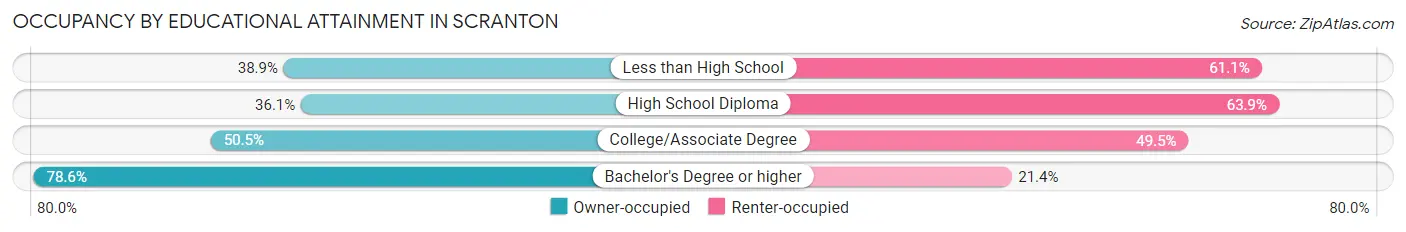
| Household Size | Owner-occupied | Renter-occupied |
| Less than High School | 28 (38.9%) | 44 (61.1%) |
| High School Diploma | 30 (36.1%) | 53 (63.9%) |
| College/Associate Degree | 53 (50.5%) | 52 (49.5%) |
| Bachelor's Degree or higher | 11 (78.6%) | 3 (21.4%) |
Occupancy by Age of Householder in Scranton
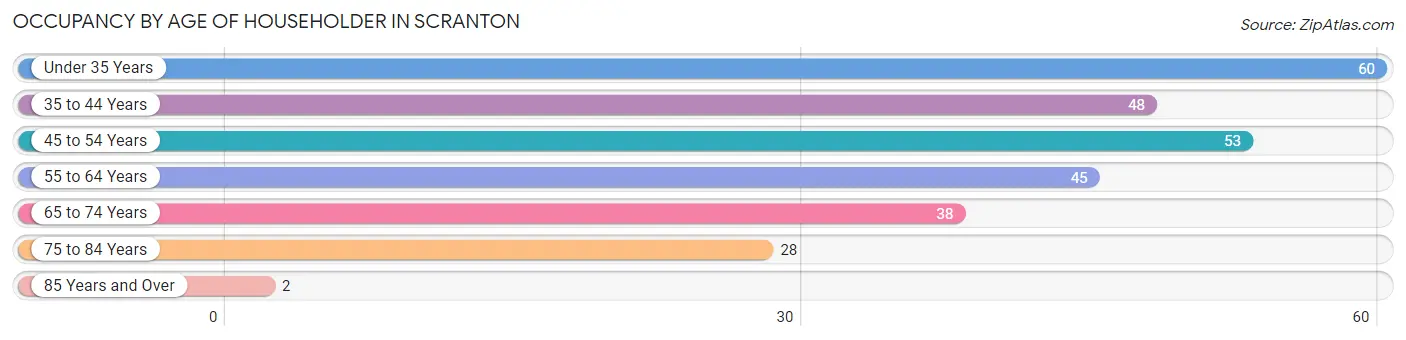
| Age Bracket | # Households | % Households |
| Under 35 Years | 60 | 21.9% |
| 35 to 44 Years | 48 | 17.5% |
| 45 to 54 Years | 53 | 19.3% |
| 55 to 64 Years | 45 | 16.4% |
| 65 to 74 Years | 38 | 13.9% |
| 75 to 84 Years | 28 | 10.2% |
| 85 Years and Over | 2 | 0.7% |
| Total | 274 | 100.0% |
Housing Finances in Scranton
Median Income by Occupancy in Scranton
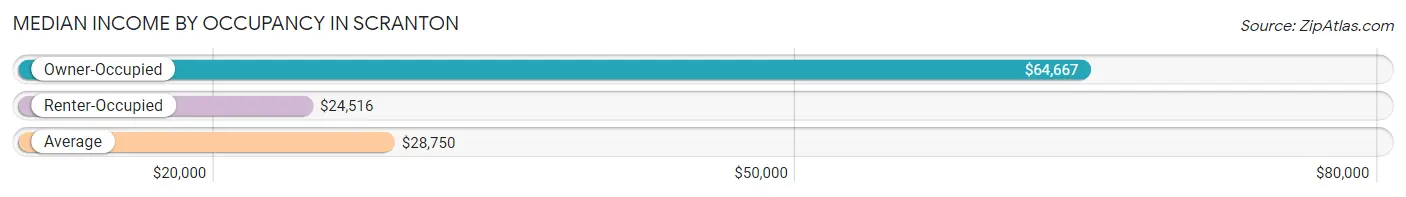
| Occupancy Type | # Households | Median Income |
| Owner-Occupied | 122 (44.5%) | $64,667 |
| Renter-Occupied | 152 (55.5%) | $24,516 |
| Average | 274 (100.0%) | $28,750 |
Occupancy by Householder Income Bracket in Scranton
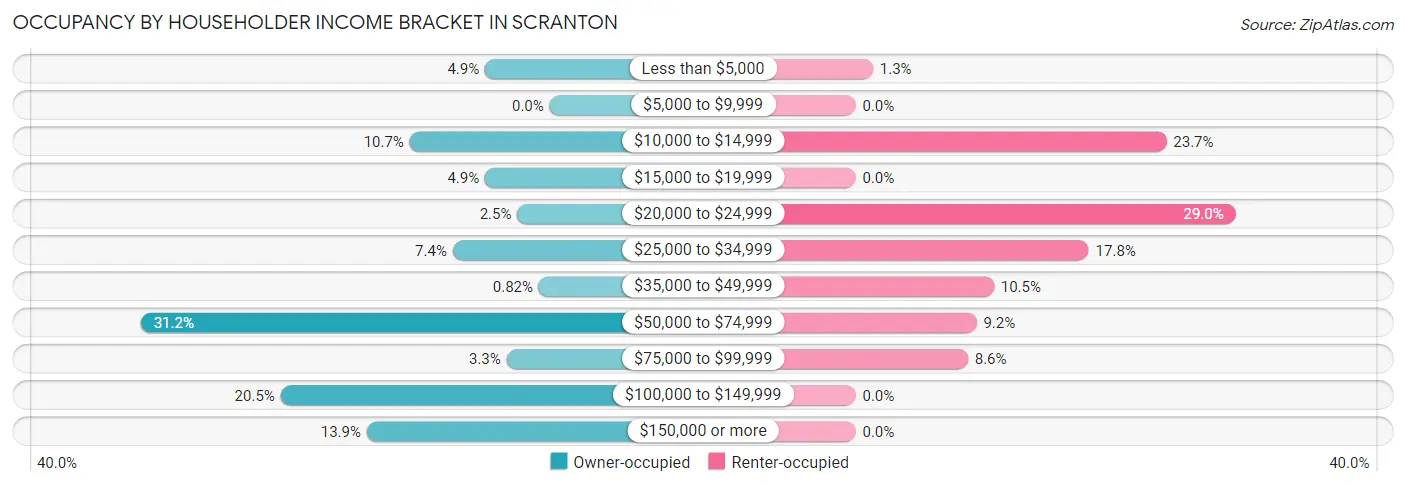
| Income Bracket | Owner-occupied | Renter-occupied |
| Less than $5,000 | 6 (4.9%) | 2 (1.3%) |
| $5,000 to $9,999 | 0 (0.0%) | 0 (0.0%) |
| $10,000 to $14,999 | 13 (10.7%) | 36 (23.7%) |
| $15,000 to $19,999 | 6 (4.9%) | 0 (0.0%) |
| $20,000 to $24,999 | 3 (2.5%) | 44 (28.9%) |
| $25,000 to $34,999 | 9 (7.4%) | 27 (17.8%) |
| $35,000 to $49,999 | 1 (0.8%) | 16 (10.5%) |
| $50,000 to $74,999 | 38 (31.1%) | 14 (9.2%) |
| $75,000 to $99,999 | 4 (3.3%) | 13 (8.6%) |
| $100,000 to $149,999 | 25 (20.5%) | 0 (0.0%) |
| $150,000 or more | 17 (13.9%) | 0 (0.0%) |
| Total | 122 (100.0%) | 152 (100.0%) |
Monthly Housing Cost Tiers in Scranton
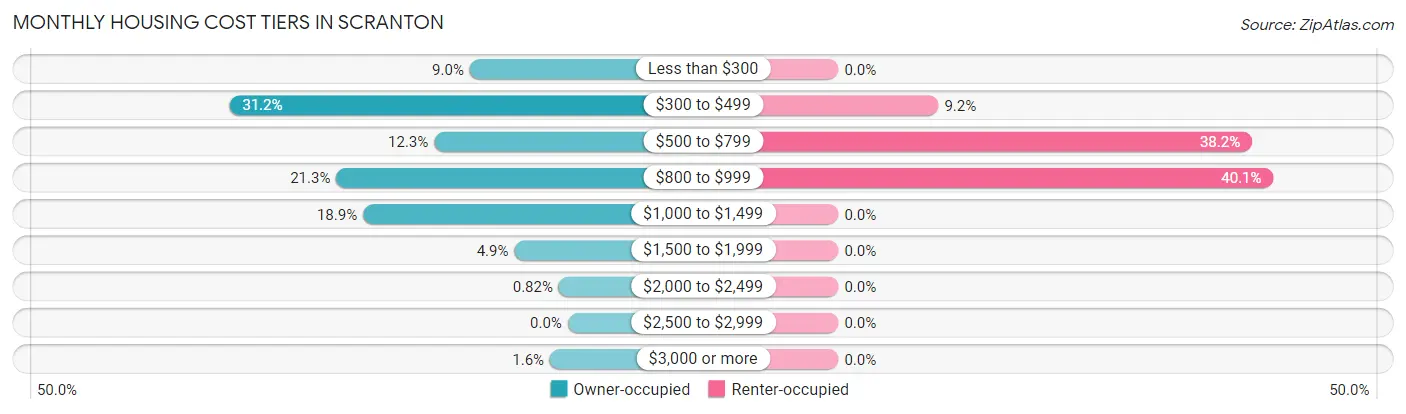
| Monthly Cost | Owner-occupied | Renter-occupied |
| Less than $300 | 11 (9.0%) | 0 (0.0%) |
| $300 to $499 | 38 (31.1%) | 14 (9.2%) |
| $500 to $799 | 15 (12.3%) | 58 (38.2%) |
| $800 to $999 | 26 (21.3%) | 61 (40.1%) |
| $1,000 to $1,499 | 23 (18.9%) | 0 (0.0%) |
| $1,500 to $1,999 | 6 (4.9%) | 0 (0.0%) |
| $2,000 to $2,499 | 1 (0.8%) | 0 (0.0%) |
| $2,500 to $2,999 | 0 (0.0%) | 0 (0.0%) |
| $3,000 or more | 2 (1.6%) | 0 (0.0%) |
| Total | 122 (100.0%) | 152 (100.0%) |
Physical Housing Characteristics in Scranton
Housing Structures in Scranton
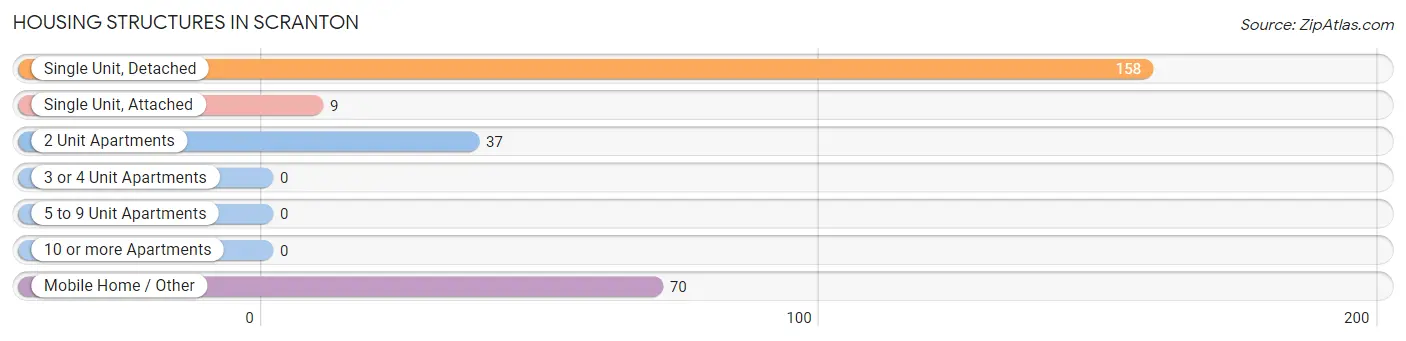
| Structure Type | # Housing Units | % Housing Units |
| Single Unit, Detached | 158 | 57.7% |
| Single Unit, Attached | 9 | 3.3% |
| 2 Unit Apartments | 37 | 13.5% |
| 3 or 4 Unit Apartments | 0 | 0.0% |
| 5 to 9 Unit Apartments | 0 | 0.0% |
| 10 or more Apartments | 0 | 0.0% |
| Mobile Home / Other | 70 | 25.6% |
| Total | 274 | 100.0% |
Housing Structures by Occupancy in Scranton
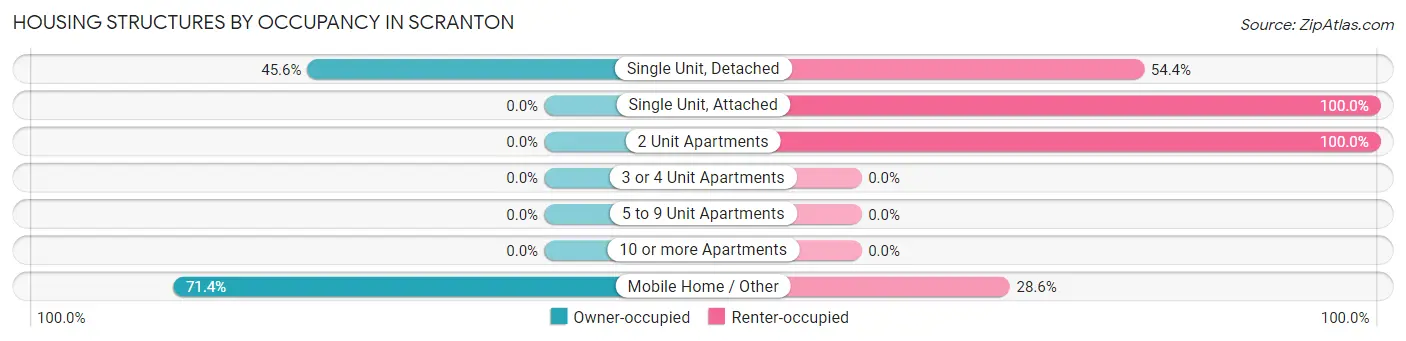
| Structure Type | Owner-occupied | Renter-occupied |
| Single Unit, Detached | 72 (45.6%) | 86 (54.4%) |
| Single Unit, Attached | 0 (0.0%) | 9 (100.0%) |
| 2 Unit Apartments | 0 (0.0%) | 37 (100.0%) |
| 3 or 4 Unit Apartments | 0 (0.0%) | 0 (0.0%) |
| 5 to 9 Unit Apartments | 0 (0.0%) | 0 (0.0%) |
| 10 or more Apartments | 0 (0.0%) | 0 (0.0%) |
| Mobile Home / Other | 50 (71.4%) | 20 (28.6%) |
| Total | 122 (44.5%) | 152 (55.5%) |
Housing Structures by Number of Rooms in Scranton
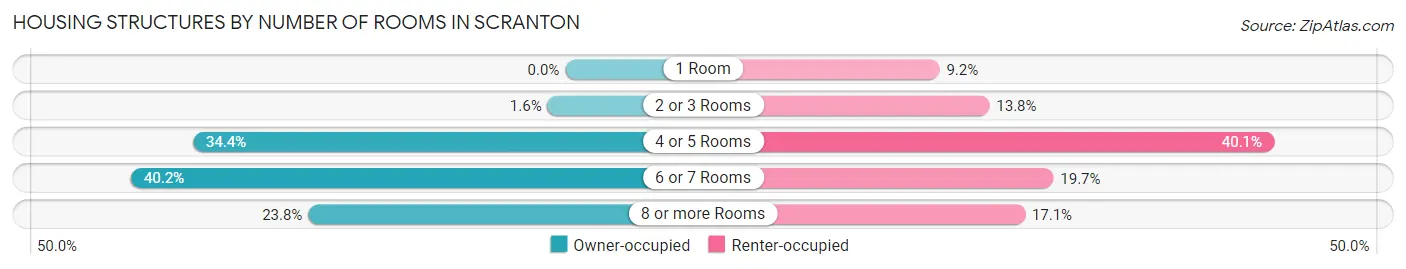
| Number of Rooms | Owner-occupied | Renter-occupied |
| 1 Room | 0 (0.0%) | 14 (9.2%) |
| 2 or 3 Rooms | 2 (1.6%) | 21 (13.8%) |
| 4 or 5 Rooms | 42 (34.4%) | 61 (40.1%) |
| 6 or 7 Rooms | 49 (40.2%) | 30 (19.7%) |
| 8 or more Rooms | 29 (23.8%) | 26 (17.1%) |
| Total | 122 (100.0%) | 152 (100.0%) |
Housing Structure by Heating Type in Scranton
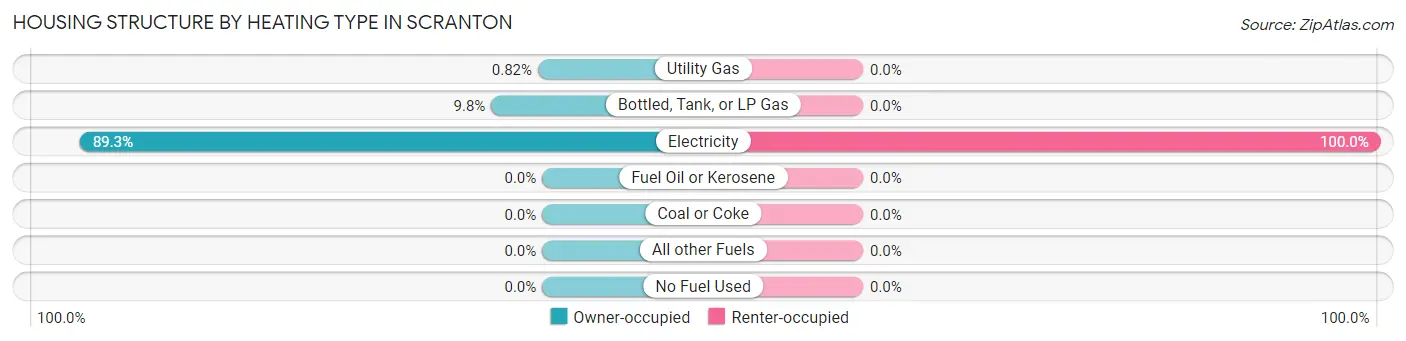
| Heating Type | Owner-occupied | Renter-occupied |
| Utility Gas | 1 (0.8%) | 0 (0.0%) |
| Bottled, Tank, or LP Gas | 12 (9.8%) | 0 (0.0%) |
| Electricity | 109 (89.3%) | 152 (100.0%) |
| Fuel Oil or Kerosene | 0 (0.0%) | 0 (0.0%) |
| Coal or Coke | 0 (0.0%) | 0 (0.0%) |
| All other Fuels | 0 (0.0%) | 0 (0.0%) |
| No Fuel Used | 0 (0.0%) | 0 (0.0%) |
| Total | 122 (100.0%) | 152 (100.0%) |
Household Vehicle Usage in Scranton
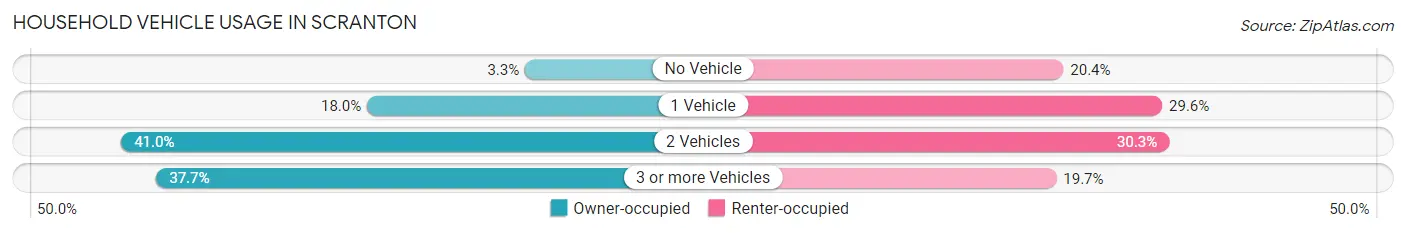
| Vehicles per Household | Owner-occupied | Renter-occupied |
| No Vehicle | 4 (3.3%) | 31 (20.4%) |
| 1 Vehicle | 22 (18.0%) | 45 (29.6%) |
| 2 Vehicles | 50 (41.0%) | 46 (30.3%) |
| 3 or more Vehicles | 46 (37.7%) | 30 (19.7%) |
| Total | 122 (100.0%) | 152 (100.0%) |
Real Estate & Mortgages in Scranton
Real Estate and Mortgage Overview in Scranton
| Characteristic | Without Mortgage | With Mortgage |
| Housing Units | 80 | 42 |
| Median Property Value | - | - |
| Median Household Income | $63,500 | $2 |
| Monthly Housing Costs | $431 | $2 |
| Real Estate Taxes | $218 | $2 |
Property Value by Mortgage Status in Scranton
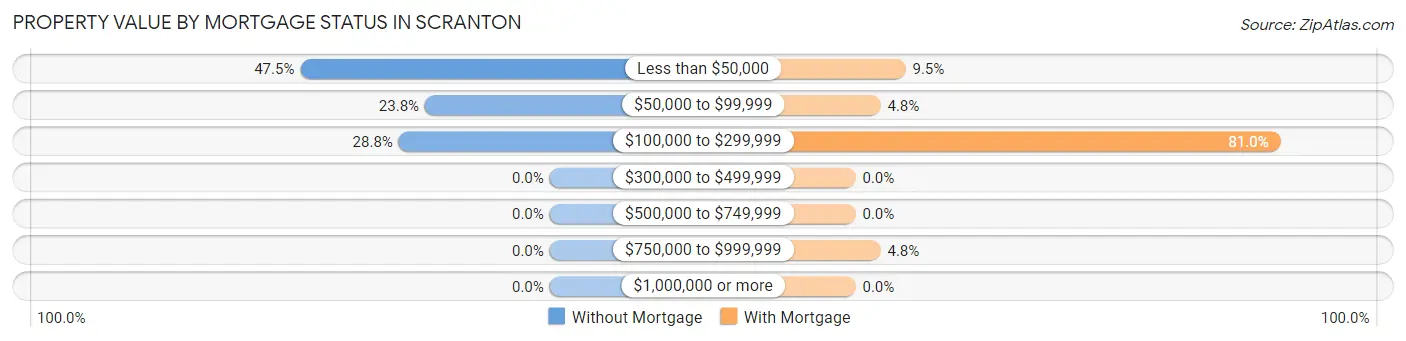
| Property Value | Without Mortgage | With Mortgage |
| Less than $50,000 | 38 (47.5%) | 4 (9.5%) |
| $50,000 to $99,999 | 19 (23.7%) | 2 (4.8%) |
| $100,000 to $299,999 | 23 (28.7%) | 34 (80.9%) |
| $300,000 to $499,999 | 0 (0.0%) | 0 (0.0%) |
| $500,000 to $749,999 | 0 (0.0%) | 0 (0.0%) |
| $750,000 to $999,999 | 0 (0.0%) | 2 (4.8%) |
| $1,000,000 or more | 0 (0.0%) | 0 (0.0%) |
| Total | 80 (100.0%) | 42 (100.0%) |
Household Income by Mortgage Status in Scranton
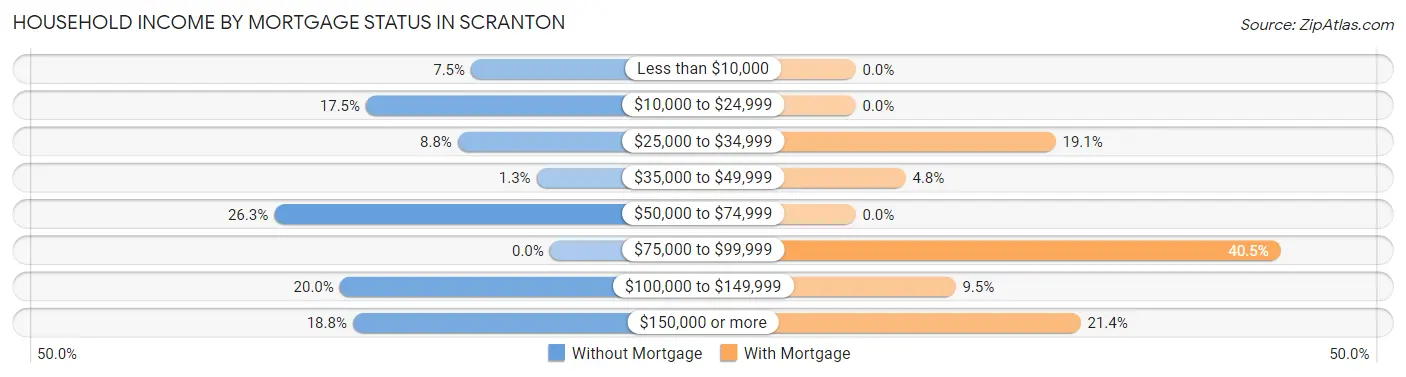
| Household Income | Without Mortgage | With Mortgage |
| Less than $10,000 | 6 (7.5%) | 0 (0.0%) |
| $10,000 to $24,999 | 14 (17.5%) | 0 (0.0%) |
| $25,000 to $34,999 | 7 (8.7%) | 8 (19.1%) |
| $35,000 to $49,999 | 1 (1.3%) | 2 (4.8%) |
| $50,000 to $74,999 | 21 (26.3%) | 0 (0.0%) |
| $75,000 to $99,999 | 0 (0.0%) | 17 (40.5%) |
| $100,000 to $149,999 | 16 (20.0%) | 4 (9.5%) |
| $150,000 or more | 15 (18.8%) | 9 (21.4%) |
| Total | 80 (100.0%) | 42 (100.0%) |
Property Value to Household Income Ratio in Scranton
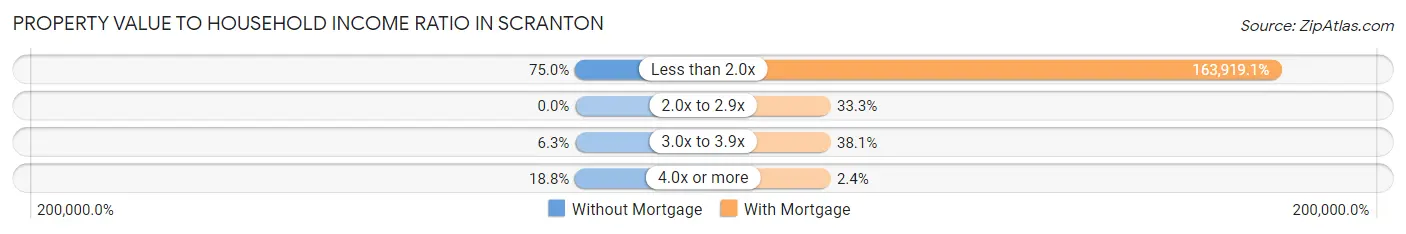
| Value-to-Income Ratio | Without Mortgage | With Mortgage |
| Less than 2.0x | 60 (75.0%) | 68,846 (163,919.0%) |
| 2.0x to 2.9x | 0 (0.0%) | 14 (33.3%) |
| 3.0x to 3.9x | 5 (6.2%) | 16 (38.1%) |
| 4.0x or more | 15 (18.8%) | 1 (2.4%) |
| Total | 80 (100.0%) | 42 (100.0%) |
Real Estate Taxes by Mortgage Status in Scranton
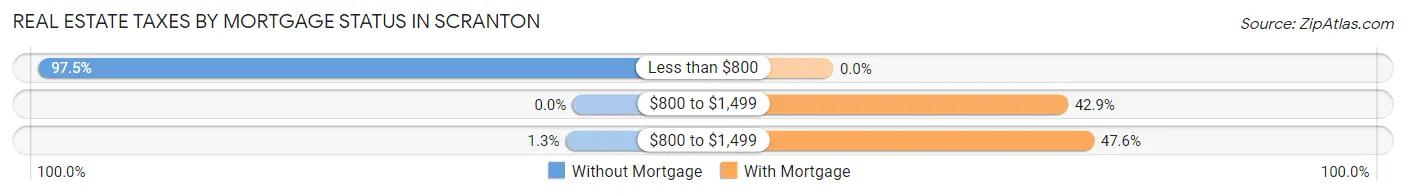
| Property Taxes | Without Mortgage | With Mortgage |
| Less than $800 | 78 (97.5%) | 0 (0.0%) |
| $800 to $1,499 | 0 (0.0%) | 18 (42.9%) |
| $800 to $1,499 | 1 (1.3%) | 20 (47.6%) |
| Total | 80 (100.0%) | 42 (100.0%) |
Health & Disability in Scranton
Health Insurance Coverage by Age in Scranton
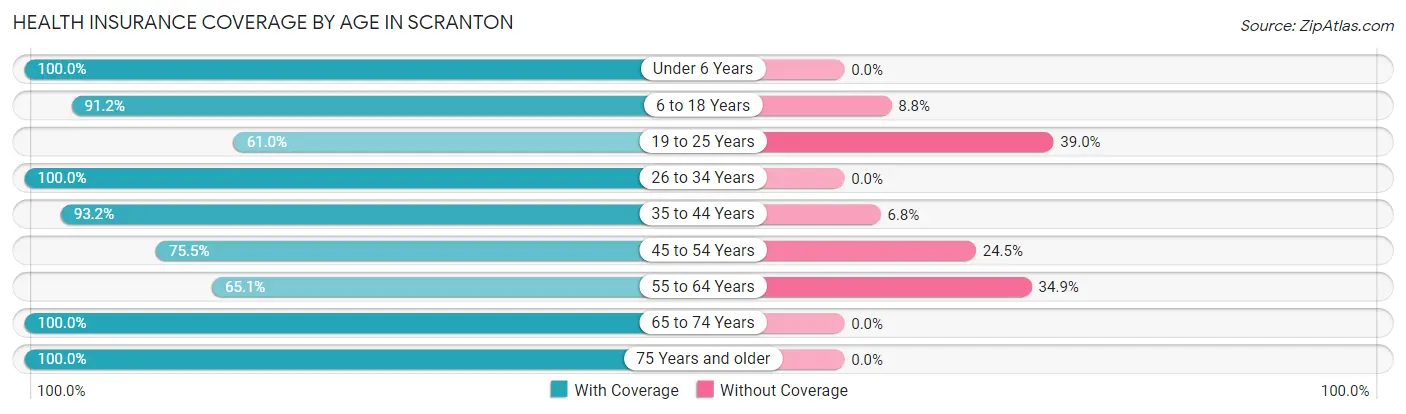
| Age Bracket | With Coverage | Without Coverage |
| Under 6 Years | 35 (100.0%) | 0 (0.0%) |
| 6 to 18 Years | 125 (91.2%) | 12 (8.8%) |
| 19 to 25 Years | 61 (61.0%) | 39 (39.0%) |
| 26 to 34 Years | 73 (100.0%) | 0 (0.0%) |
| 35 to 44 Years | 69 (93.2%) | 5 (6.8%) |
| 45 to 54 Years | 120 (75.5%) | 39 (24.5%) |
| 55 to 64 Years | 54 (65.1%) | 29 (34.9%) |
| 65 to 74 Years | 83 (100.0%) | 0 (0.0%) |
| 75 Years and older | 50 (100.0%) | 0 (0.0%) |
| Total | 670 (84.4%) | 124 (15.6%) |
Health Insurance Coverage by Citizenship Status in Scranton
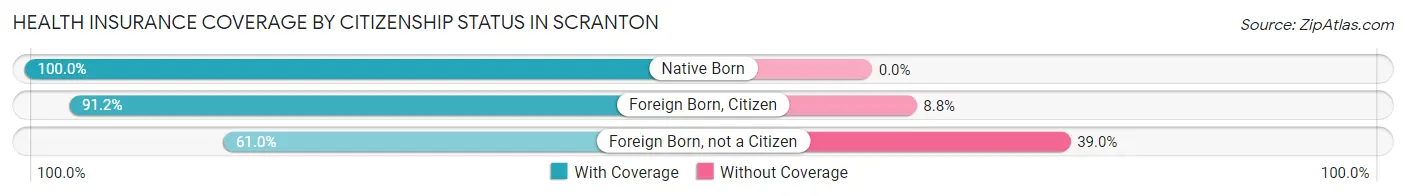
| Citizenship Status | With Coverage | Without Coverage |
| Native Born | 35 (100.0%) | 0 (0.0%) |
| Foreign Born, Citizen | 125 (91.2%) | 12 (8.8%) |
| Foreign Born, not a Citizen | 61 (61.0%) | 39 (39.0%) |
Health Insurance Coverage by Household Income in Scranton
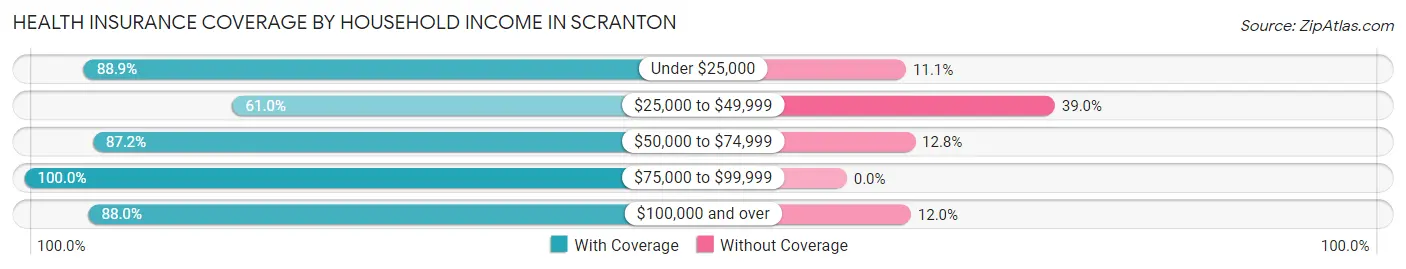
| Household Income | With Coverage | Without Coverage |
| Under $25,000 | 216 (88.9%) | 27 (11.1%) |
| $25,000 to $49,999 | 72 (61.0%) | 46 (39.0%) |
| $50,000 to $74,999 | 184 (87.2%) | 27 (12.8%) |
| $75,000 to $99,999 | 22 (100.0%) | 0 (0.0%) |
| $100,000 and over | 176 (88.0%) | 24 (12.0%) |
Public vs Private Health Insurance Coverage by Age in Scranton
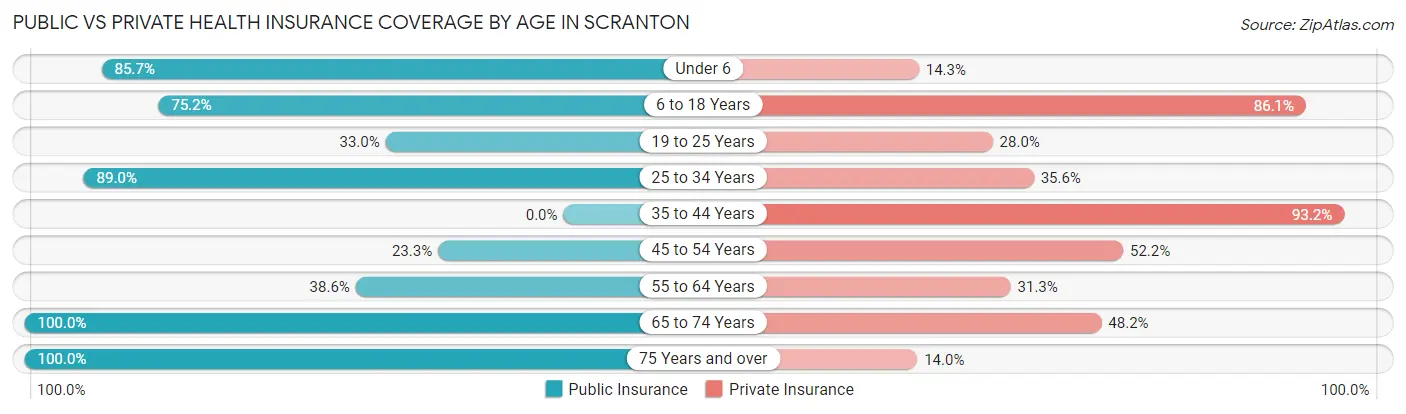
| Age Bracket | Public Insurance | Private Insurance |
| Under 6 | 30 (85.7%) | 5 (14.3%) |
| 6 to 18 Years | 103 (75.2%) | 118 (86.1%) |
| 19 to 25 Years | 33 (33.0%) | 28 (28.0%) |
| 25 to 34 Years | 65 (89.0%) | 26 (35.6%) |
| 35 to 44 Years | 0 (0.0%) | 69 (93.2%) |
| 45 to 54 Years | 37 (23.3%) | 83 (52.2%) |
| 55 to 64 Years | 32 (38.6%) | 26 (31.3%) |
| 65 to 74 Years | 83 (100.0%) | 40 (48.2%) |
| 75 Years and over | 50 (100.0%) | 7 (14.0%) |
| Total | 433 (54.5%) | 402 (50.6%) |
Disability Status by Sex by Age in Scranton
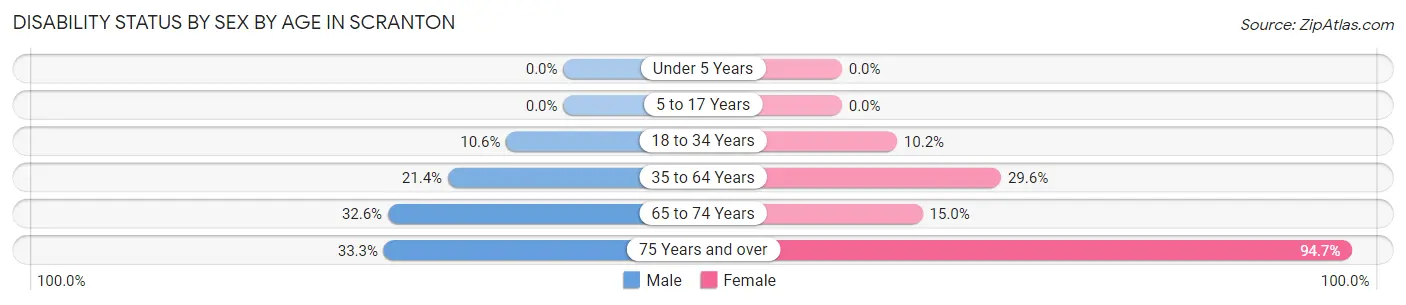
| Age Bracket | Male | Female |
| Under 5 Years | 0 (0.0%) | 0 (0.0%) |
| 5 to 17 Years | 0 (0.0%) | 0 (0.0%) |
| 18 to 34 Years | 9 (10.6%) | 9 (10.2%) |
| 35 to 64 Years | 30 (21.4%) | 52 (29.5%) |
| 65 to 74 Years | 14 (32.6%) | 6 (15.0%) |
| 75 Years and over | 4 (33.3%) | 36 (94.7%) |
Disability Class by Sex by Age in Scranton
Disability Class: Hearing Difficulty
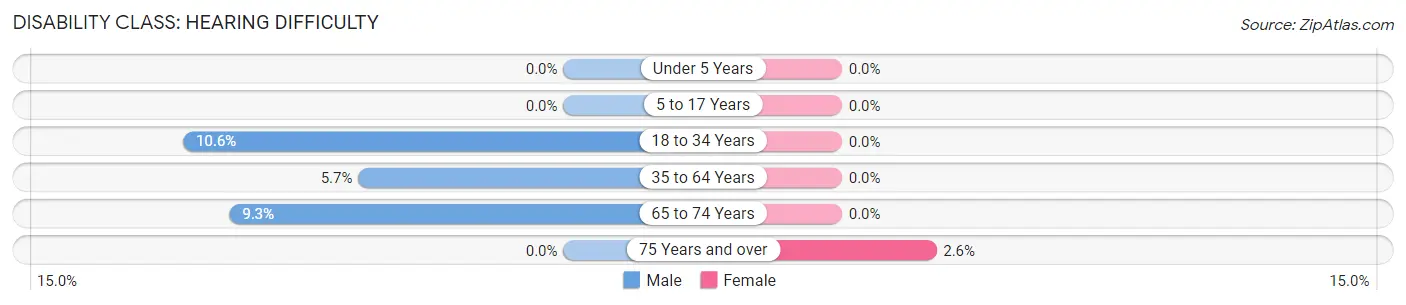
| Age Bracket | Male | Female |
| Under 5 Years | 0 (0.0%) | 0 (0.0%) |
| 5 to 17 Years | 0 (0.0%) | 0 (0.0%) |
| 18 to 34 Years | 9 (10.6%) | 0 (0.0%) |
| 35 to 64 Years | 8 (5.7%) | 0 (0.0%) |
| 65 to 74 Years | 4 (9.3%) | 0 (0.0%) |
| 75 Years and over | 0 (0.0%) | 1 (2.6%) |
Disability Class: Vision Difficulty
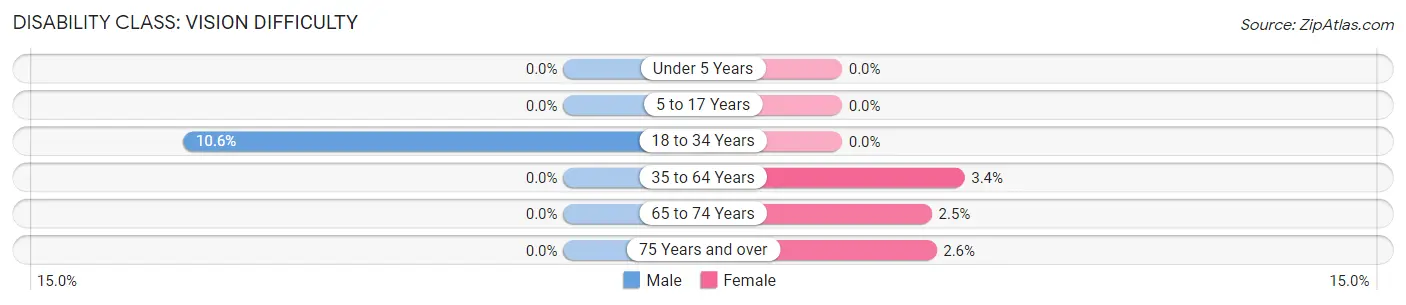
| Age Bracket | Male | Female |
| Under 5 Years | 0 (0.0%) | 0 (0.0%) |
| 5 to 17 Years | 0 (0.0%) | 0 (0.0%) |
| 18 to 34 Years | 9 (10.6%) | 0 (0.0%) |
| 35 to 64 Years | 0 (0.0%) | 6 (3.4%) |
| 65 to 74 Years | 0 (0.0%) | 1 (2.5%) |
| 75 Years and over | 0 (0.0%) | 1 (2.6%) |
Disability Class: Cognitive Difficulty
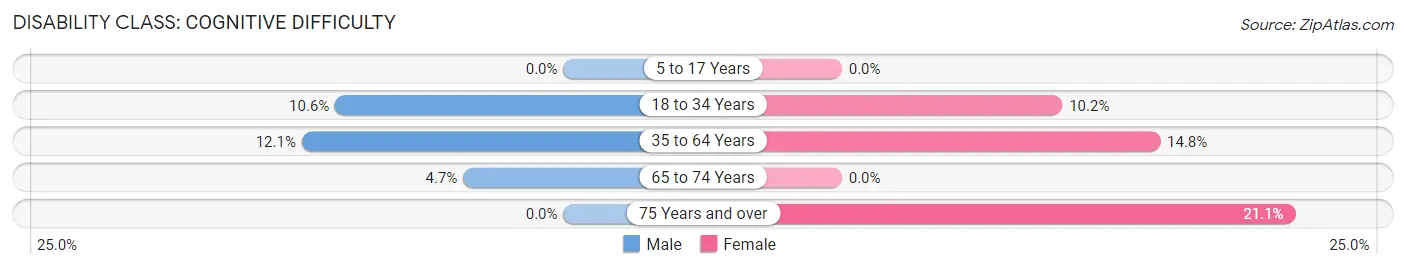
| Age Bracket | Male | Female |
| 5 to 17 Years | 0 (0.0%) | 0 (0.0%) |
| 18 to 34 Years | 9 (10.6%) | 9 (10.2%) |
| 35 to 64 Years | 17 (12.1%) | 26 (14.8%) |
| 65 to 74 Years | 2 (4.6%) | 0 (0.0%) |
| 75 Years and over | 0 (0.0%) | 8 (21.0%) |
Disability Class: Ambulatory Difficulty
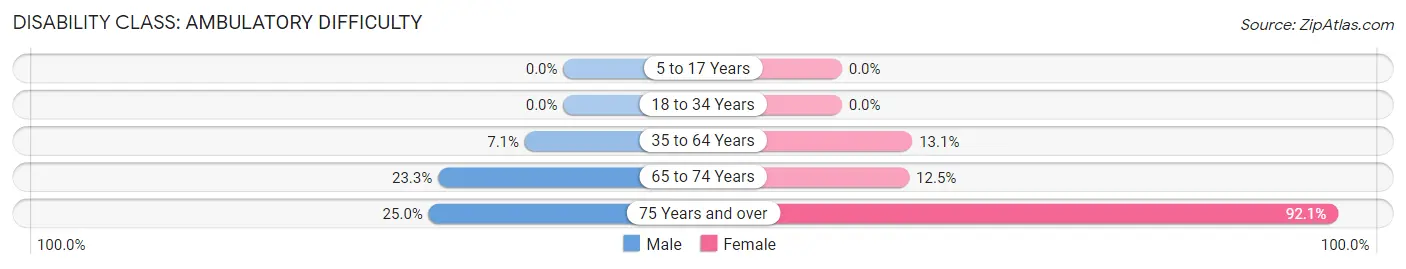
| Age Bracket | Male | Female |
| 5 to 17 Years | 0 (0.0%) | 0 (0.0%) |
| 18 to 34 Years | 0 (0.0%) | 0 (0.0%) |
| 35 to 64 Years | 10 (7.1%) | 23 (13.1%) |
| 65 to 74 Years | 10 (23.3%) | 5 (12.5%) |
| 75 Years and over | 3 (25.0%) | 35 (92.1%) |
Disability Class: Self-Care Difficulty
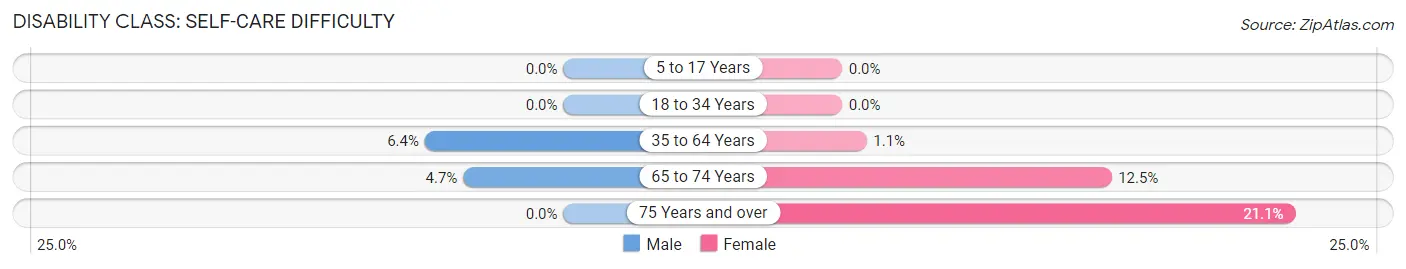
| Age Bracket | Male | Female |
| 5 to 17 Years | 0 (0.0%) | 0 (0.0%) |
| 18 to 34 Years | 0 (0.0%) | 0 (0.0%) |
| 35 to 64 Years | 9 (6.4%) | 2 (1.1%) |
| 65 to 74 Years | 2 (4.6%) | 5 (12.5%) |
| 75 Years and over | 0 (0.0%) | 8 (21.0%) |
Technology Access in Scranton
Computing Device Access in Scranton
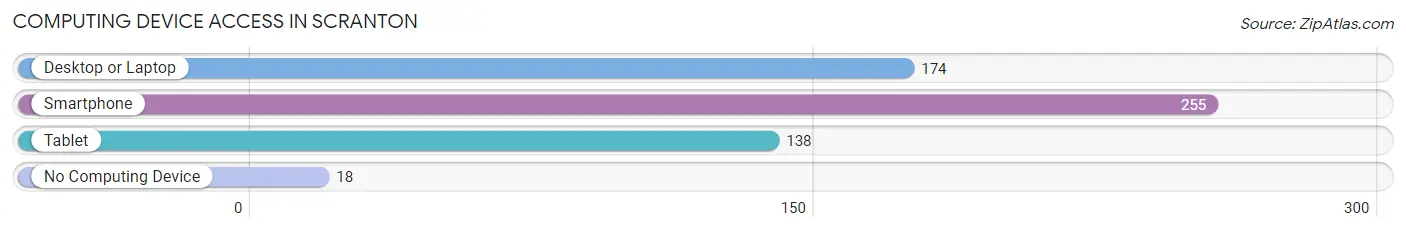
| Device Type | # Households | % Households |
| Desktop or Laptop | 174 | 63.5% |
| Smartphone | 255 | 93.1% |
| Tablet | 138 | 50.4% |
| No Computing Device | 18 | 6.6% |
| Total | 274 | 100.0% |
Internet Access in Scranton
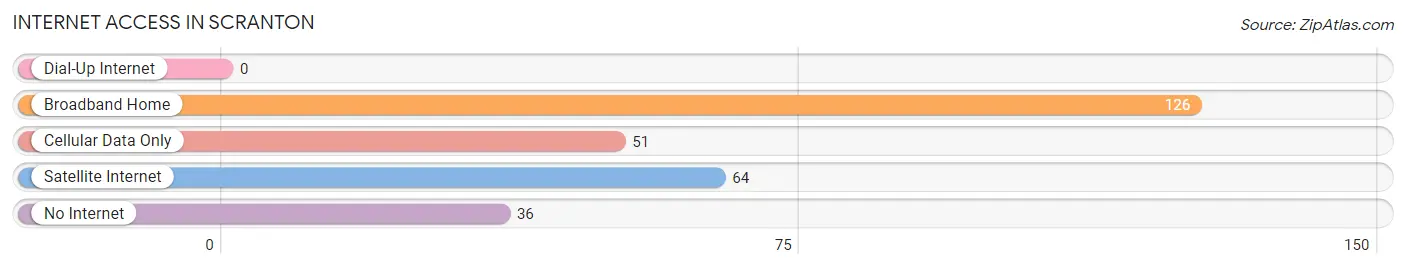
| Internet Type | # Households | % Households |
| Dial-Up Internet | 0 | 0.0% |
| Broadband Home | 126 | 46.0% |
| Cellular Data Only | 51 | 18.6% |
| Satellite Internet | 64 | 23.4% |
| No Internet | 36 | 13.1% |
| Total | 274 | 100.0% |
Scranton Summary
Scranton, South Carolina is a small town located in the Pee Dee region of the state. It is situated in the northeastern corner of Florence County, approximately 20 miles from the city of Florence. The town was founded in 1883 and is named after the city of Scranton, Pennsylvania.
Geography
Scranton is located in the Pee Dee region of South Carolina, which is known for its flat terrain and sandy soil. The town is situated in the northeastern corner of Florence County, approximately 20 miles from the city of Florence. The town is bordered by the Lynches River to the east and the Little Pee Dee River to the west. The town is located at an elevation of approximately 200 feet above sea level.
The climate in Scranton is classified as humid subtropical, with hot, humid summers and mild winters. The average annual temperature is around 70 degrees Fahrenheit, with an average high of around 90 degrees in the summer and an average low of around 50 degrees in the winter. The average annual precipitation is around 50 inches, with most of the rain falling in the summer months.
Economy
The economy of Scranton is largely based on agriculture. The town is home to several farms, which produce a variety of crops, including cotton, soybeans, corn, and peanuts. The town is also home to several manufacturing companies, which produce a variety of products, including furniture, textiles, and automotive parts.
The town is also home to several small businesses, including restaurants, retail stores, and service providers. The town is also home to several churches, which provide a variety of services to the community.
Demographics
As of the 2010 census, the population of Scranton was 1,845. The racial makeup of the town was 79.3% White, 17.2% African American, 0.3% Native American, 0.2% Asian, 0.1% Pacific Islander, and 2.9% from other races. The median household income was $30,938, and the median family income was $37,813.
The town is served by the Florence County School District, which includes two elementary schools, one middle school, and one high school. The town is also home to several churches, which provide a variety of services to the community.
Conclusion
Scranton, South Carolina is a small town located in the Pee Dee region of the state. It is situated in the northeastern corner of Florence County, approximately 20 miles from the city of Florence. The town was founded in 1883 and is named after the city of Scranton, Pennsylvania. The economy of Scranton is largely based on agriculture, with several farms producing a variety of crops. The town is also home to several manufacturing companies, small businesses, and churches. As of the 2010 census, the population of Scranton was 1,845. The racial makeup of the town was 79.3% White, 17.2% African American, 0.3% Native American, 0.2% Asian, 0.1% Pacific Islander, and 2.9% from other races. The median household income was $30,938, and the median family income was $37,813. The town is served by the Florence County School District, which includes two elementary schools, one middle school, and one high school.
Common Questions
What is Per Capita Income in Scranton?
Per Capita income in Scranton is $19,301.
What is the Median Household income in Scranton?
Median Household Income in Scranton is $28,750.
What is Inequality or Gini Index in Scranton?
Inequality or Gini Index in Scranton is 0.46.
What is the Total Population of Scranton?
Total Population of Scranton is 897.
What is the Total Male Population of Scranton?
Total Male Population of Scranton is 403.
What is the Total Female Population of Scranton?
Total Female Population of Scranton is 494.
What is the Ratio of Males per 100 Females in Scranton?
There are 81.58 Males per 100 Females in Scranton.
What is the Ratio of Females per 100 Males in Scranton?
There are 122.58 Females per 100 Males in Scranton.
What is the Median Population Age in Scranton?
Median Population Age in Scranton is 47.6 Years.
What is the Average Family Size in Scranton
Average Family Size in Scranton is 3.5 People.
What is the Average Household Size in Scranton
Average Household Size in Scranton is 2.9 People.
How Large is the Labor Force in Scranton?
There are 345 People in the Labor Forcein in Scranton.
What is the Percentage of People in the Labor Force in Scranton?
45.4% of People are in the Labor Force in Scranton.
What is the Unemployment Rate in Scranton?
Unemployment Rate in Scranton is 1.2%.