Loris, SC Map & Demographics
Loris Map
Loris Overview
$25,853
PER CAPITA INCOME
$41,500
AVG FAMILY INCOME
$34,564
AVG HOUSEHOLD INCOME
2.4%
WAGE / INCOME GAP [ % ]
97.6¢/ $1
WAGE / INCOME GAP [ $ ]
$9,814
FAMILY INCOME DEFICIT
0.52
INEQUALITY / GINI INDEX
2,513
TOTAL POPULATION
1,037
MALE POPULATION
1,476
FEMALE POPULATION
70.26
MALES / 100 FEMALES
142.33
FEMALES / 100 MALES
44.4
MEDIAN AGE
3.1
AVG FAMILY SIZE
2.2
AVG HOUSEHOLD SIZE
974
LABOR FORCE [ PEOPLE ]
49.2%
PERCENT IN LABOR FORCE
8.4%
UNEMPLOYMENT RATE
Loris Zip Codes
Loris Area Codes
Income in Loris
Income Overview in Loris
Per Capita Income in Loris is $25,853, while median incomes of families and households are $41,500 and $34,564 respectively.
| Characteristic | Number | Measure |
| Per Capita Income | 2,513 | $25,853 |
| Median Family Income | 614 | $41,500 |
| Mean Family Income | 614 | $74,672 |
| Median Household Income | 1,080 | $34,564 |
| Mean Household Income | 1,080 | $56,262 |
| Income Deficit | 614 | $9,814 |
| Wage / Income Gap (%) | 2,513 | 2.39% |
| Wage / Income Gap ($) | 2,513 | 97.61¢ per $1 |
| Gini / Inequality Index | 2,513 | 0.52 |
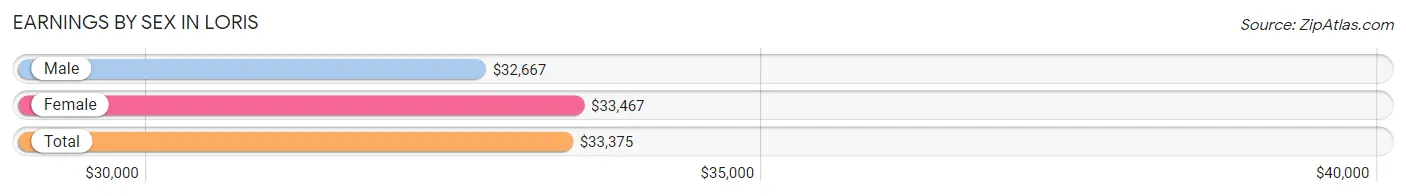
Earnings by Sex in Loris
Average Earnings in Loris are $33,375, $32,667 for men and $33,467 for women, a difference of 2.4%.
| Sex | Number | Average Earnings |
| Male | 346 (35.6%) | $32,667 |
| Female | 627 (64.4%) | $33,467 |
| Total | 973 (100.0%) | $33,375 |
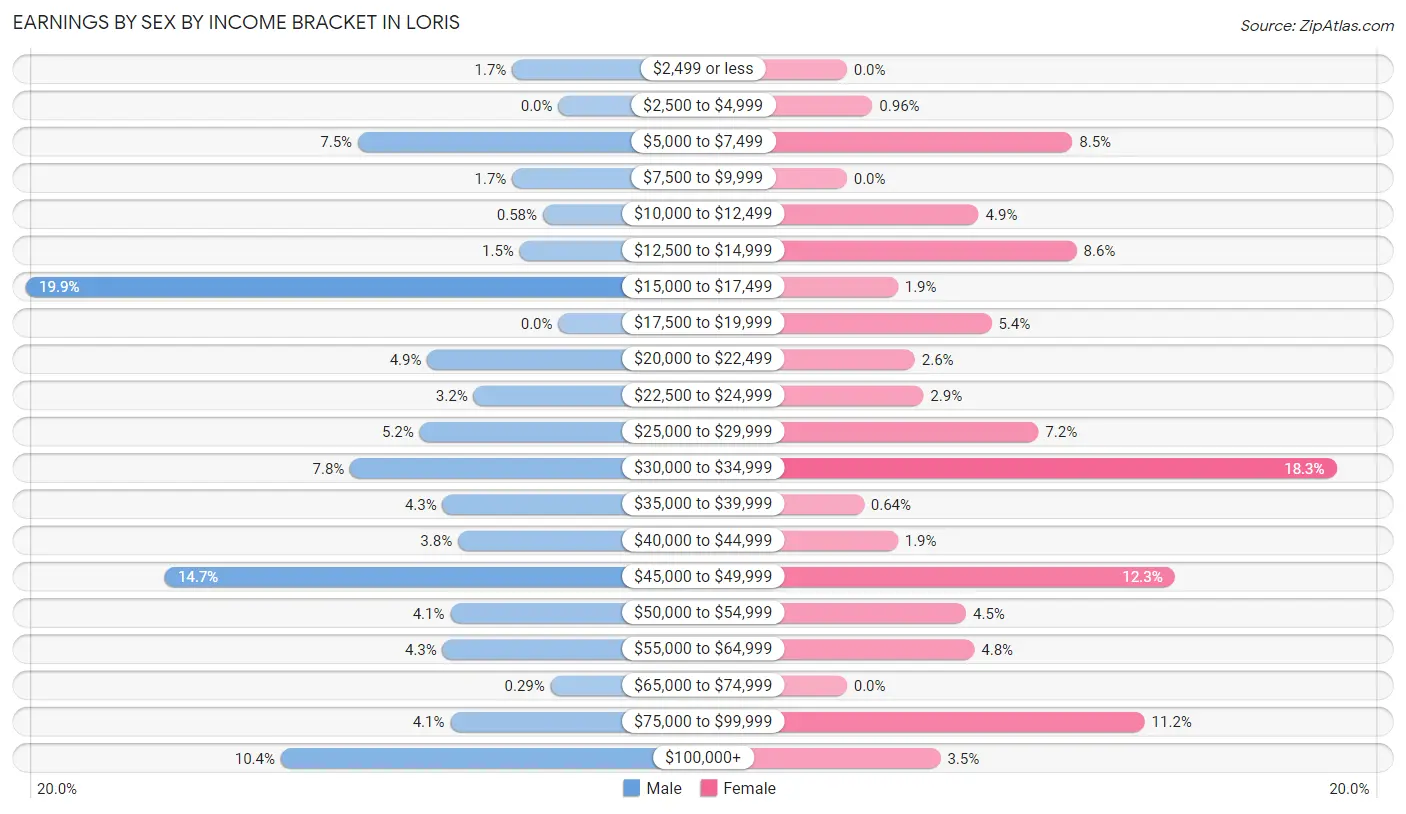
Earnings by Sex by Income Bracket in Loris
The most common earnings brackets in Loris are $15,000 to $17,499 for men (69 | 19.9%) and $30,000 to $34,999 for women (115 | 18.3%).
| Income | Male | Female |
| $2,499 or less | 6 (1.7%) | 0 (0.0%) |
| $2,500 to $4,999 | 0 (0.0%) | 6 (1.0%) |
| $5,000 to $7,499 | 26 (7.5%) | 53 (8.5%) |
| $7,500 to $9,999 | 6 (1.7%) | 0 (0.0%) |
| $10,000 to $12,499 | 2 (0.6%) | 31 (4.9%) |
| $12,500 to $14,999 | 5 (1.5%) | 54 (8.6%) |
| $15,000 to $17,499 | 69 (19.9%) | 12 (1.9%) |
| $17,500 to $19,999 | 0 (0.0%) | 34 (5.4%) |
| $20,000 to $22,499 | 17 (4.9%) | 16 (2.5%) |
| $22,500 to $24,999 | 11 (3.2%) | 18 (2.9%) |
| $25,000 to $29,999 | 18 (5.2%) | 45 (7.2%) |
| $30,000 to $34,999 | 27 (7.8%) | 115 (18.3%) |
| $35,000 to $39,999 | 15 (4.3%) | 4 (0.6%) |
| $40,000 to $44,999 | 13 (3.8%) | 12 (1.9%) |
| $45,000 to $49,999 | 51 (14.7%) | 77 (12.3%) |
| $50,000 to $54,999 | 14 (4.1%) | 28 (4.5%) |
| $55,000 to $64,999 | 15 (4.3%) | 30 (4.8%) |
| $65,000 to $74,999 | 1 (0.3%) | 0 (0.0%) |
| $75,000 to $99,999 | 14 (4.1%) | 70 (11.2%) |
| $100,000+ | 36 (10.4%) | 22 (3.5%) |
| Total | 346 (100.0%) | 627 (100.0%) |
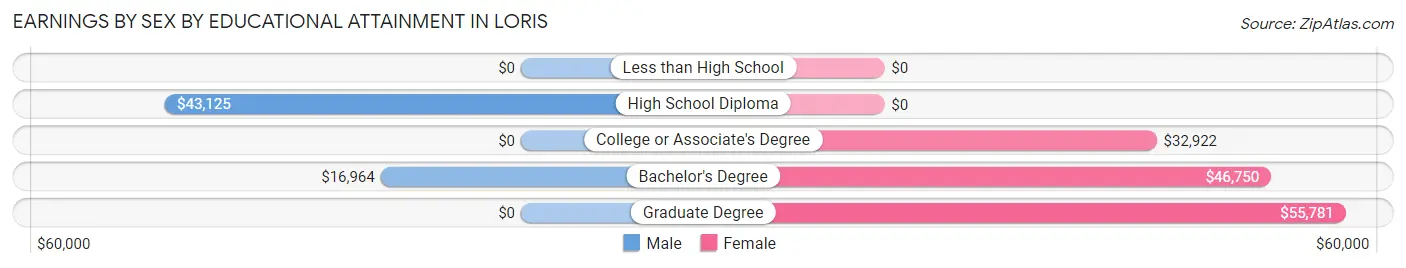
Earnings by Sex by Educational Attainment in Loris
Average earnings in Loris are $34,500 for men and $33,793 for women, a difference of 2.1%. Men with an educational attainment of high school diploma enjoy the highest average annual earnings of $43,125, while those with bachelor's degree education earn the least with $16,964. Women with an educational attainment of graduate degree earn the most with the average annual earnings of $55,781, while those with college or associate's degree education have the smallest earnings of $32,922.
| Educational Attainment | Male Income | Female Income |
| Less than High School | - | - |
| High School Diploma | $43,125 | $0 |
| College or Associate's Degree | - | - |
| Bachelor's Degree | $16,964 | $46,750 |
| Graduate Degree | - | - |
| Total | $34,500 | $33,793 |
Family Income in Loris
Family Income Brackets in Loris
According to the Loris family income data, there are 126 families falling into the $25,000 to $34,999 income range, which is the most common income bracket and makes up 20.5% of all families. Conversely, the $15,000 to $24,999 income bracket is the least frequent group with only 24 families (3.9%) belonging to this category.
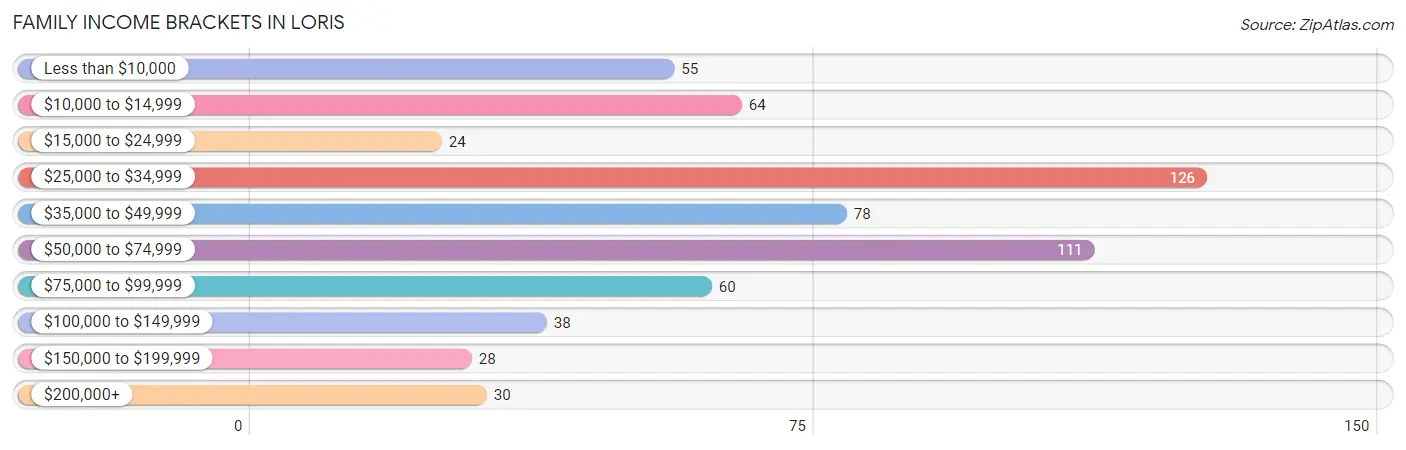
| Income Bracket | # Families | % Families |
| Less than $10,000 | 55 | 9.0% |
| $10,000 to $14,999 | 64 | 10.4% |
| $15,000 to $24,999 | 24 | 3.9% |
| $25,000 to $34,999 | 126 | 20.5% |
| $35,000 to $49,999 | 78 | 12.7% |
| $50,000 to $74,999 | 111 | 18.1% |
| $75,000 to $99,999 | 60 | 9.8% |
| $100,000 to $149,999 | 38 | 6.2% |
| $150,000 to $199,999 | 28 | 4.6% |
| $200,000+ | 30 | 4.9% |
Family Income by Famaliy Size in Loris
5-person families (59 | 9.6%) account for the highest median family income in Loris with $67,277 per family, while 2-person families (395 | 64.3%) have the highest median income of $17,103 per family member.
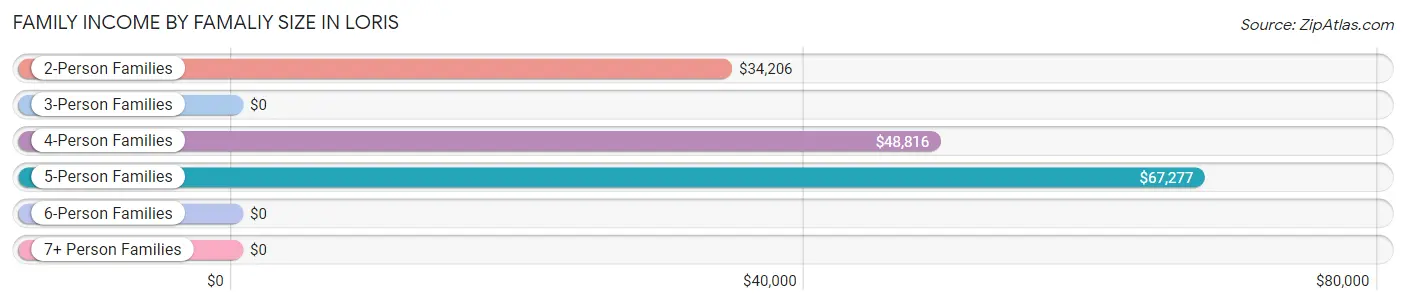
| Income Bracket | # Families | Median Income |
| 2-Person Families | 395 (64.3%) | $34,206 |
| 3-Person Families | 91 (14.8%) | $0 |
| 4-Person Families | 60 (9.8%) | $48,816 |
| 5-Person Families | 59 (9.6%) | $67,277 |
| 6-Person Families | 0 (0.0%) | $0 |
| 7+ Person Families | 9 (1.5%) | $0 |
| Total | 614 (100.0%) | $41,500 |
Family Income by Number of Earners in Loris
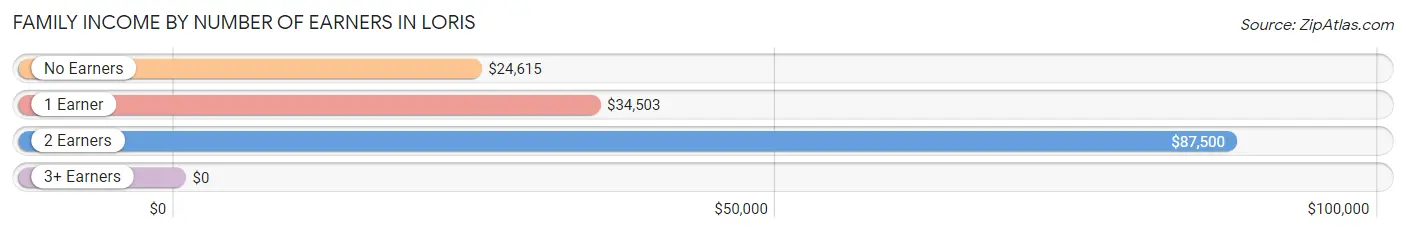
| Number of Earners | # Families | Median Income |
| No Earners | 160 (26.1%) | $24,615 |
| 1 Earner | 257 (41.9%) | $34,503 |
| 2 Earners | 190 (30.9%) | $87,500 |
| 3+ Earners | 7 (1.1%) | $0 |
| Total | 614 (100.0%) | $41,500 |
Household Income in Loris
Household Income Brackets in Loris
With 238 households falling in the category, the $25,000 to $34,999 income range is the most frequent in Loris, accounting for 22.0% of all households. In contrast, only 28 households (2.6%) fall into the $150,000 to $199,999 income bracket, making it the least populous group.
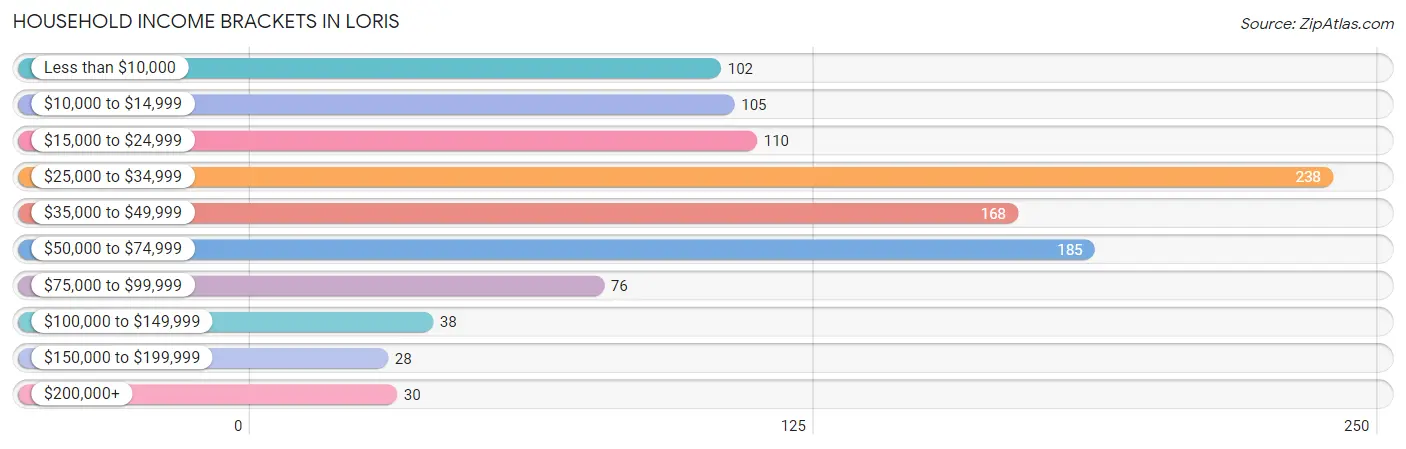
| Income Bracket | # Households | % Households |
| Less than $10,000 | 102 | 9.4% |
| $10,000 to $14,999 | 105 | 9.7% |
| $15,000 to $24,999 | 110 | 10.2% |
| $25,000 to $34,999 | 238 | 22.0% |
| $35,000 to $49,999 | 168 | 15.6% |
| $50,000 to $74,999 | 185 | 17.1% |
| $75,000 to $99,999 | 76 | 7.0% |
| $100,000 to $149,999 | 38 | 3.5% |
| $150,000 to $199,999 | 28 | 2.6% |
| $200,000+ | 30 | 2.8% |
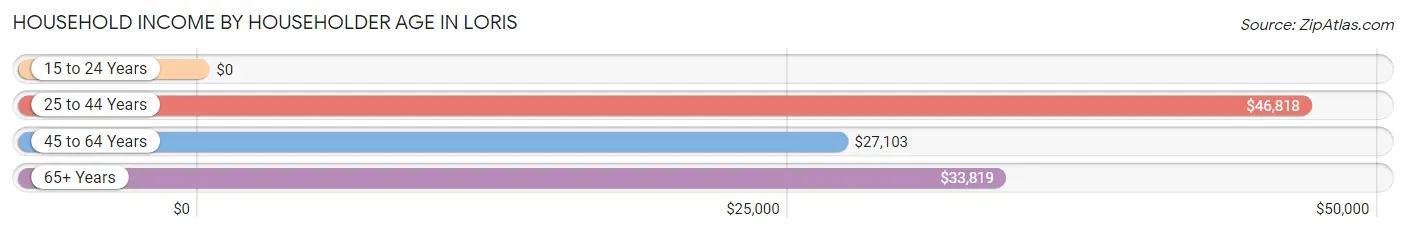
Household Income by Householder Age in Loris
The median household income in Loris is $34,564, with the highest median household income of $46,818 found in the 25 to 44 years age bracket for the primary householder. A total of 270 households (25.0%) fall into this category.
| Income Bracket | # Households | Median Income |
| 15 to 24 Years | 0 (0.0%) | $0 |
| 25 to 44 Years | 270 (25.0%) | $46,818 |
| 45 to 64 Years | 453 (41.9%) | $27,103 |
| 65+ Years | 357 (33.1%) | $33,819 |
| Total | 1,080 (100.0%) | $34,564 |
Poverty in Loris
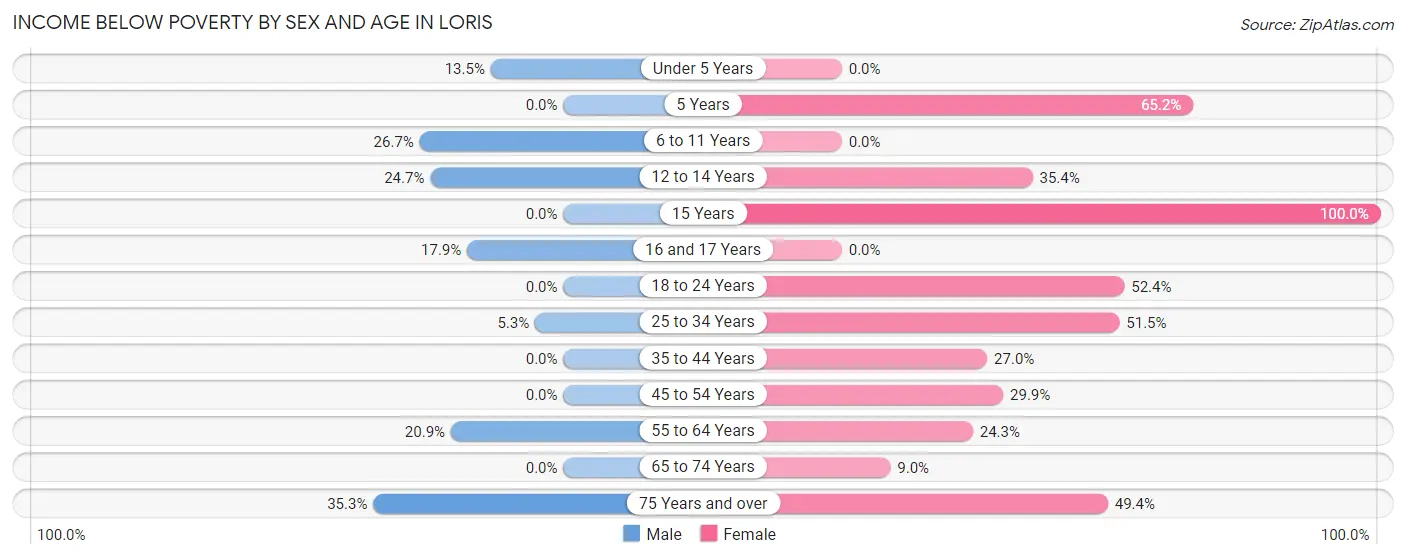
Income Below Poverty by Sex and Age in Loris
With 10.2% poverty level for males and 28.9% for females among the residents of Loris, 75 year old and over males and 15 year old females are the most vulnerable to poverty, with 6 males (35.3%) and 28 females (100.0%) in their respective age groups living below the poverty level.
| Age Bracket | Male | Female |
| Under 5 Years | 12 (13.5%) | 0 (0.0%) |
| 5 Years | 0 (0.0%) | 15 (65.2%) |
| 6 to 11 Years | 4 (26.7%) | 0 (0.0%) |
| 12 to 14 Years | 21 (24.7%) | 40 (35.4%) |
| 15 Years | 0 (0.0%) | 28 (100.0%) |
| 16 and 17 Years | 5 (17.9%) | 0 (0.0%) |
| 18 to 24 Years | 0 (0.0%) | 43 (52.4%) |
| 25 to 34 Years | 5 (5.3%) | 68 (51.5%) |
| 35 to 44 Years | 0 (0.0%) | 68 (27.0%) |
| 45 to 54 Years | 0 (0.0%) | 47 (29.9%) |
| 55 to 64 Years | 48 (20.9%) | 45 (24.3%) |
| 65 to 74 Years | 0 (0.0%) | 21 (9.0%) |
| 75 Years and over | 6 (35.3%) | 39 (49.4%) |
| Total | 101 (10.2%) | 414 (28.9%) |
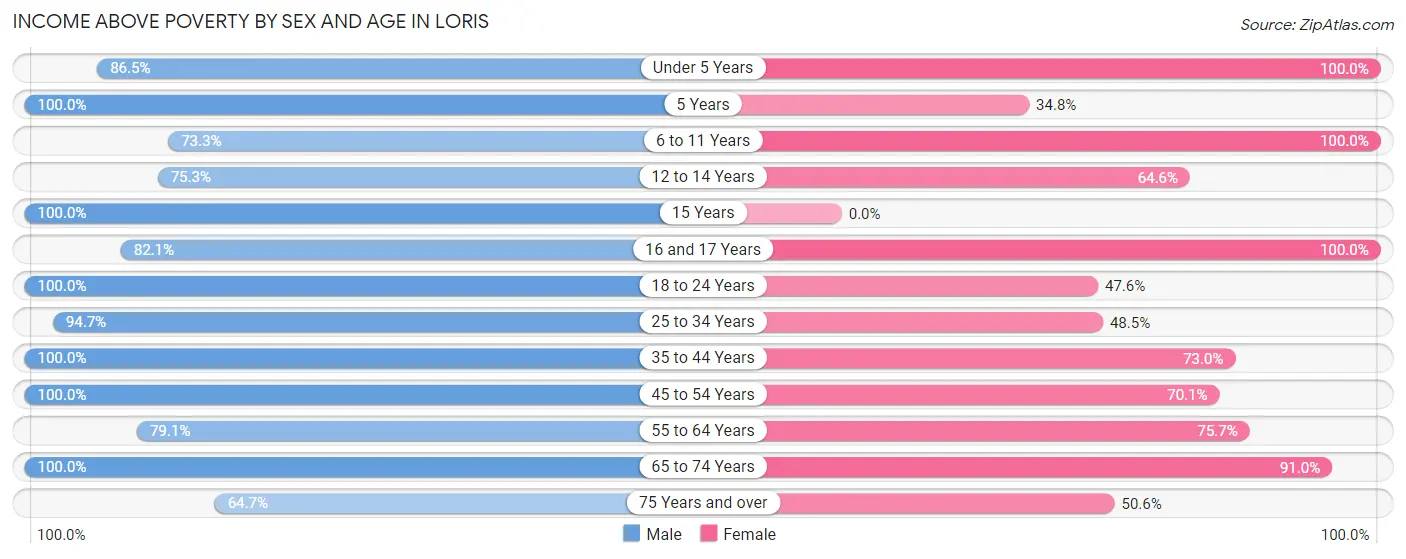
Income Above Poverty by Sex and Age in Loris
According to the poverty statistics in Loris, males aged 5 years and females aged under 5 years are the age groups that are most secure financially, with 100.0% of males and 100.0% of females in these age groups living above the poverty line.
| Age Bracket | Male | Female |
| Under 5 Years | 77 (86.5%) | 77 (100.0%) |
| 5 Years | 7 (100.0%) | 8 (34.8%) |
| 6 to 11 Years | 11 (73.3%) | 60 (100.0%) |
| 12 to 14 Years | 64 (75.3%) | 73 (64.6%) |
| 15 Years | 36 (100.0%) | 0 (0.0%) |
| 16 and 17 Years | 23 (82.1%) | 13 (100.0%) |
| 18 to 24 Years | 46 (100.0%) | 39 (47.6%) |
| 25 to 34 Years | 90 (94.7%) | 64 (48.5%) |
| 35 to 44 Years | 95 (100.0%) | 184 (73.0%) |
| 45 to 54 Years | 72 (100.0%) | 110 (70.1%) |
| 55 to 64 Years | 182 (79.1%) | 140 (75.7%) |
| 65 to 74 Years | 175 (100.0%) | 212 (91.0%) |
| 75 Years and over | 11 (64.7%) | 40 (50.6%) |
| Total | 889 (89.8%) | 1,020 (71.1%) |
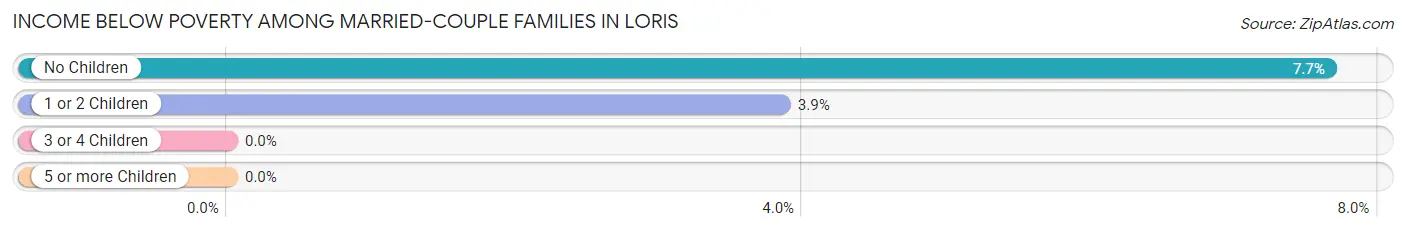
Income Below Poverty Among Married-Couple Families in Loris
The poverty statistics for married-couple families in Loris show that 5.6% or 18 of the total 321 families live below the poverty line. Families with no children have the highest poverty rate of 7.6%, comprising of 15 families. On the other hand, families with 3 or 4 children have the lowest poverty rate of 0.0%, which includes 0 families.
| Children | Above Poverty | Below Poverty |
| No Children | 181 (92.3%) | 15 (7.6%) |
| 1 or 2 Children | 75 (96.2%) | 3 (3.8%) |
| 3 or 4 Children | 38 (100.0%) | 0 (0.0%) |
| 5 or more Children | 9 (100.0%) | 0 (0.0%) |
| Total | 303 (94.4%) | 18 (5.6%) |
Income Below Poverty Among Single-Parent Households in Loris
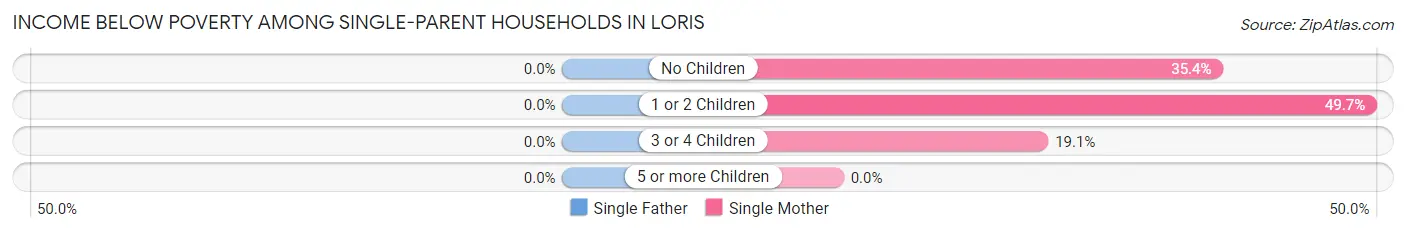
| Children | Single Father | Single Mother |
| No Children | 0 (0.0%) | 35 (35.3%) |
| 1 or 2 Children | 0 (0.0%) | 76 (49.7%) |
| 3 or 4 Children | 0 (0.0%) | 4 (19.1%) |
| 5 or more Children | 0 (0.0%) | 0 (0.0%) |
| Total | 0 (0.0%) | 115 (42.1%) |
Income Below Poverty Among Married-Couple vs Single-Parent Households in Loris
The poverty data for Loris shows that 18 of the married-couple family households (5.6%) and 115 of the single-parent households (39.3%) are living below the poverty level. Within the married-couple family households, those with no children have the highest poverty rate, with 15 households (7.6%) falling below the poverty line. Among the single-parent households, those with 1 or 2 children have the highest poverty rate, with 76 household (45.2%) living below poverty.
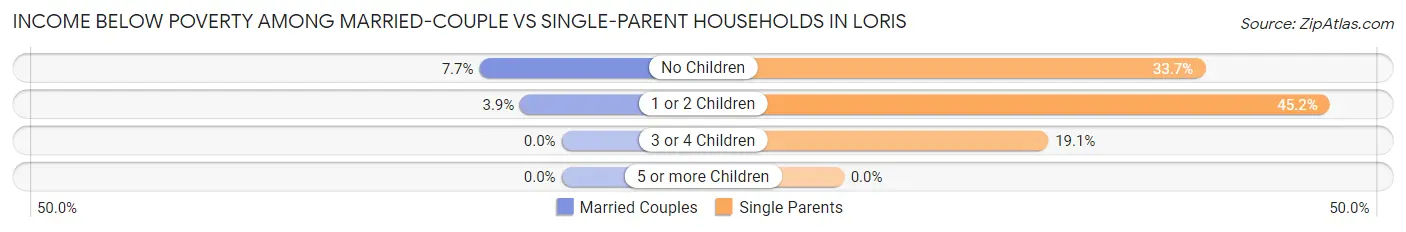
| Children | Married-Couple Families | Single-Parent Households |
| No Children | 15 (7.6%) | 35 (33.7%) |
| 1 or 2 Children | 3 (3.8%) | 76 (45.2%) |
| 3 or 4 Children | 0 (0.0%) | 4 (19.1%) |
| 5 or more Children | 0 (0.0%) | 0 (0.0%) |
| Total | 18 (5.6%) | 115 (39.3%) |
Race in Loris
The most populous races in Loris are White / Caucasian (1,437 | 57.2%), Black / African American (995 | 39.6%), and Two or more Races (47 | 1.9%).
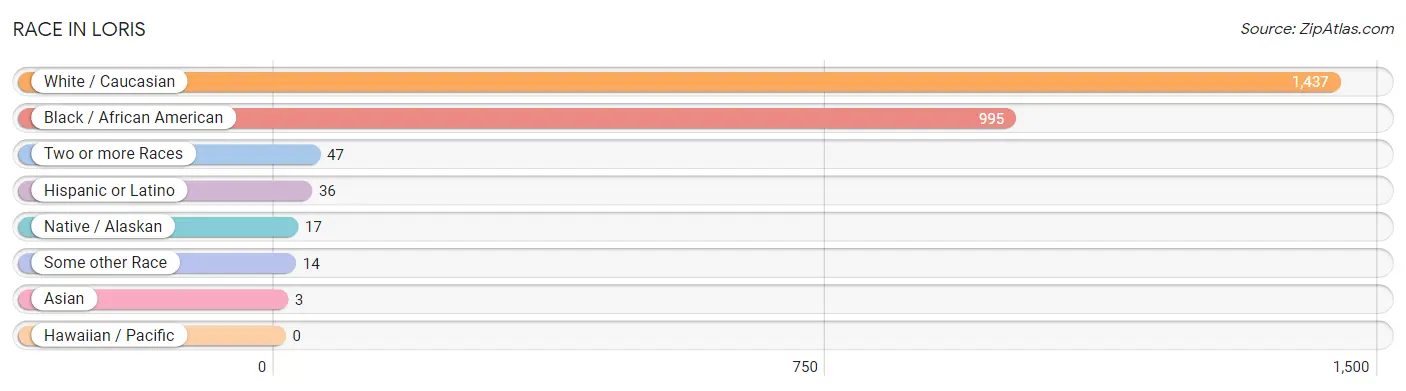
| Race | # Population | % Population |
| Asian | 3 | 0.1% |
| Black / African American | 995 | 39.6% |
| Hawaiian / Pacific | 0 | 0.0% |
| Hispanic or Latino | 36 | 1.4% |
| Native / Alaskan | 17 | 0.7% |
| White / Caucasian | 1,437 | 57.2% |
| Two or more Races | 47 | 1.9% |
| Some other Race | 14 | 0.6% |
| Total | 2,513 | 100.0% |
Ancestry in Loris
The most populous ancestries reported in Loris are English (382 | 15.2%), German (214 | 8.5%), American (140 | 5.6%), Polish (124 | 4.9%), and European (123 | 4.9%), together accounting for 39.1% of all Loris residents.
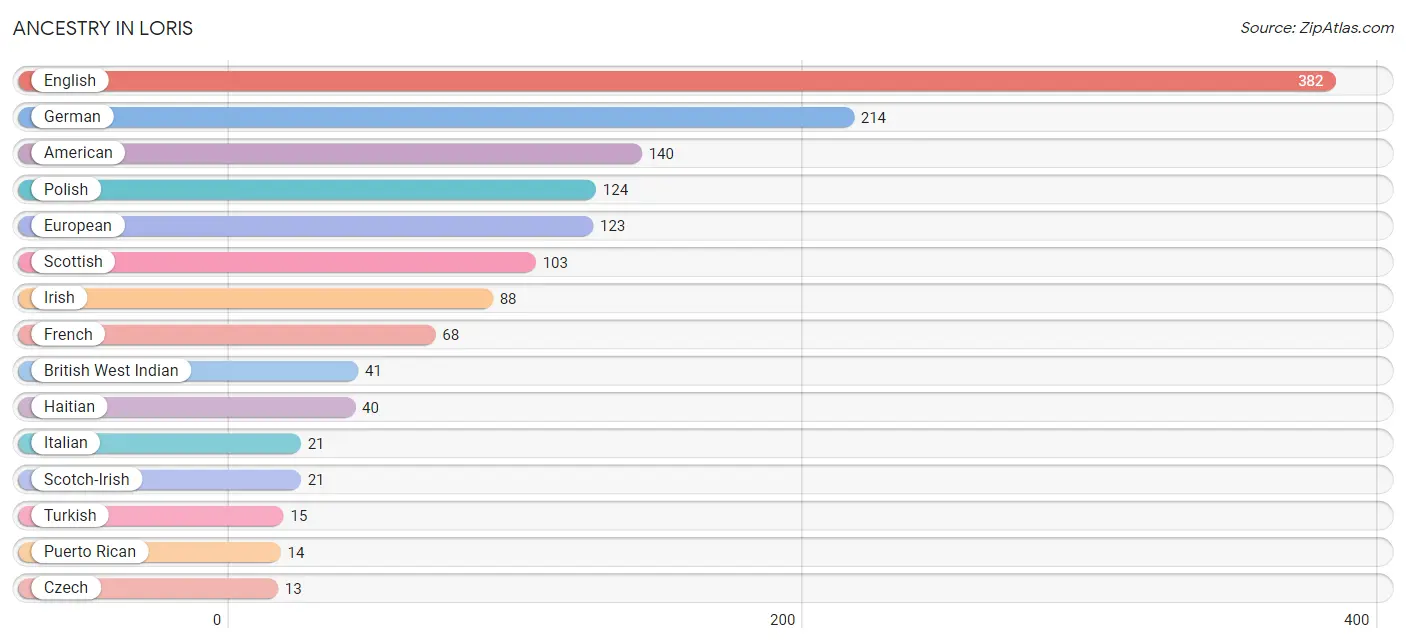
| Ancestry | # Population | % Population |
| American | 140 | 5.6% |
| Bhutanese | 3 | 0.1% |
| British West Indian | 41 | 1.6% |
| Central American | 10 | 0.4% |
| Cherokee | 5 | 0.2% |
| Czech | 13 | 0.5% |
| Dutch | 1 | 0.0% |
| English | 382 | 15.2% |
| European | 123 | 4.9% |
| French | 68 | 2.7% |
| French Canadian | 4 | 0.2% |
| German | 214 | 8.5% |
| Haitian | 40 | 1.6% |
| Hungarian | 11 | 0.4% |
| Irish | 88 | 3.5% |
| Italian | 21 | 0.8% |
| Lithuanian | 13 | 0.5% |
| Mexican | 12 | 0.5% |
| New Zealander | 4 | 0.2% |
| Norwegian | 7 | 0.3% |
| Panamanian | 10 | 0.4% |
| Polish | 124 | 4.9% |
| Puerto Rican | 14 | 0.6% |
| Scotch-Irish | 21 | 0.8% |
| Scottish | 103 | 4.1% |
| Slovak | 5 | 0.2% |
| Swiss | 3 | 0.1% |
| Turkish | 15 | 0.6% |
| Ukrainian | 4 | 0.2% | View All 29 Rows |
Immigrants in Loris
The most numerous immigrant groups reported in Loris came from Caribbean (14 | 0.6%), Haiti (14 | 0.6%), Latin America (14 | 0.6%), Asia (3 | 0.1%), and Eastern Asia (3 | 0.1%), together accounting for 1.9% of all Loris residents.
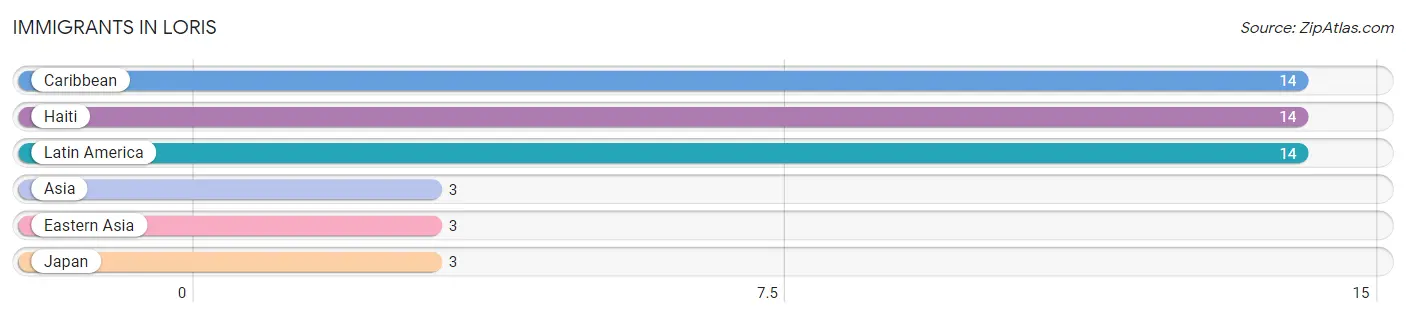
| Immigration Origin | # Population | % Population |
| Asia | 3 | 0.1% |
| Caribbean | 14 | 0.6% |
| Eastern Asia | 3 | 0.1% |
| Haiti | 14 | 0.6% |
| Japan | 3 | 0.1% |
| Latin America | 14 | 0.6% | View All 6 Rows |
Sex and Age in Loris
Sex and Age in Loris
The most populous age groups in Loris are 55 to 59 Years (178 | 17.2%) for men and 50 to 54 Years (132 | 8.9%) for women.
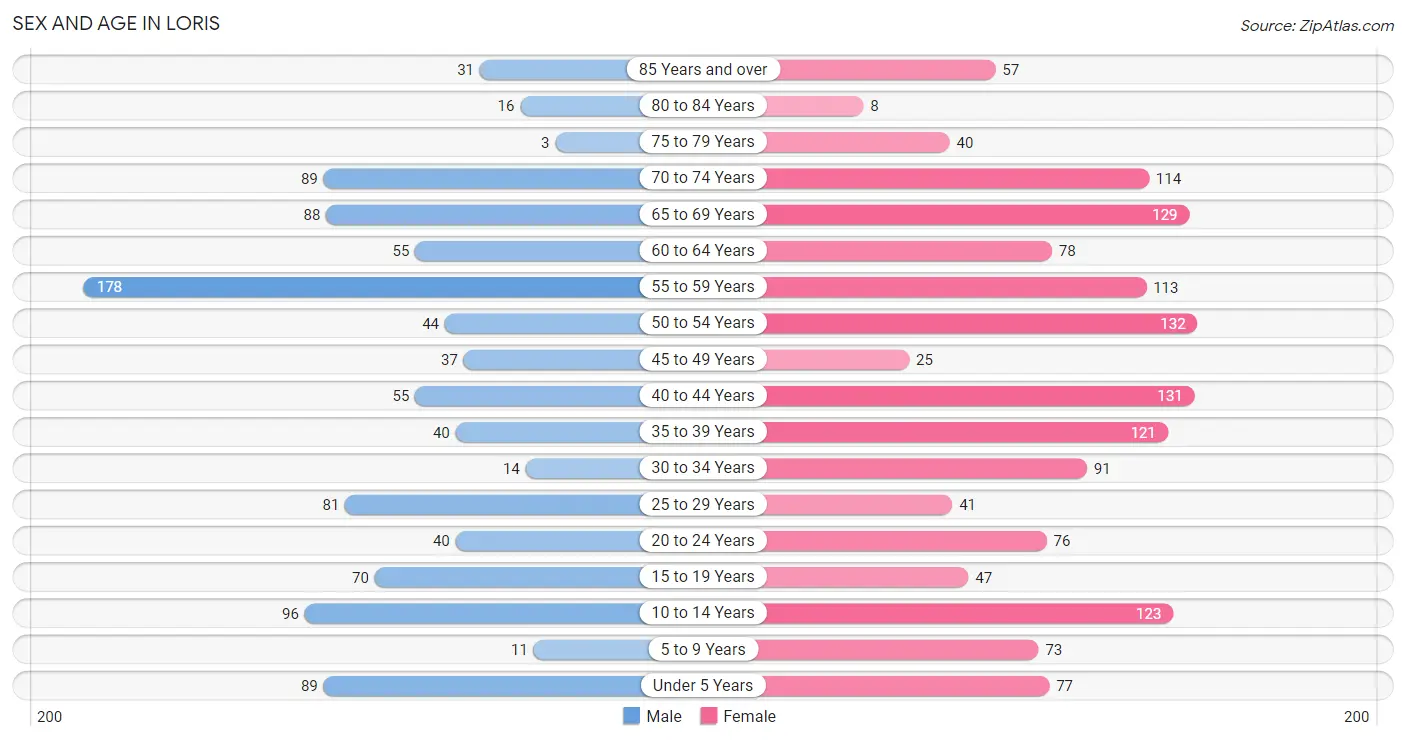
| Age Bracket | Male | Female |
| Under 5 Years | 89 (8.6%) | 77 (5.2%) |
| 5 to 9 Years | 11 (1.1%) | 73 (5.0%) |
| 10 to 14 Years | 96 (9.3%) | 123 (8.3%) |
| 15 to 19 Years | 70 (6.8%) | 47 (3.2%) |
| 20 to 24 Years | 40 (3.9%) | 76 (5.1%) |
| 25 to 29 Years | 81 (7.8%) | 41 (2.8%) |
| 30 to 34 Years | 14 (1.3%) | 91 (6.2%) |
| 35 to 39 Years | 40 (3.9%) | 121 (8.2%) |
| 40 to 44 Years | 55 (5.3%) | 131 (8.9%) |
| 45 to 49 Years | 37 (3.6%) | 25 (1.7%) |
| 50 to 54 Years | 44 (4.2%) | 132 (8.9%) |
| 55 to 59 Years | 178 (17.2%) | 113 (7.7%) |
| 60 to 64 Years | 55 (5.3%) | 78 (5.3%) |
| 65 to 69 Years | 88 (8.5%) | 129 (8.7%) |
| 70 to 74 Years | 89 (8.6%) | 114 (7.7%) |
| 75 to 79 Years | 3 (0.3%) | 40 (2.7%) |
| 80 to 84 Years | 16 (1.5%) | 8 (0.5%) |
| 85 Years and over | 31 (3.0%) | 57 (3.9%) |
| Total | 1,037 (100.0%) | 1,476 (100.0%) |
Families and Households in Loris
Median Family Size in Loris
The median family size in Loris is 3.08 persons per family, with married-couple families (321 | 52.3%) accounting for the largest median family size of 3.3 persons per family. On the other hand, single male/father families (20 | 3.3%) represent the smallest median family size with 2.15 persons per family.
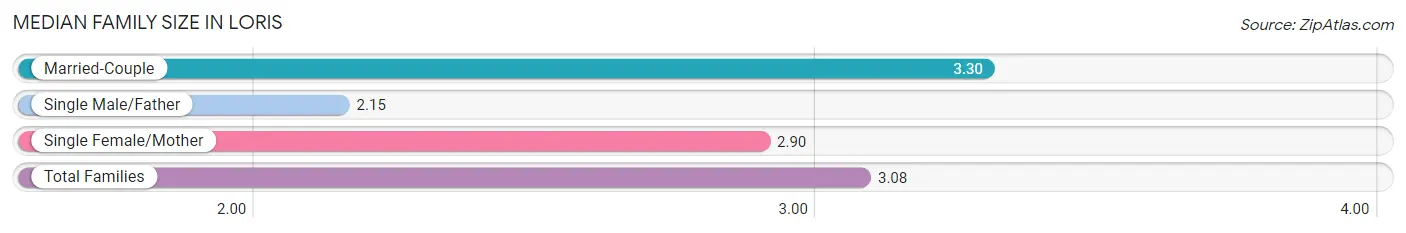
| Family Type | # Families | Family Size |
| Married-Couple | 321 (52.3%) | 3.30 |
| Single Male/Father | 20 (3.3%) | 2.15 |
| Single Female/Mother | 273 (44.5%) | 2.90 |
| Total Families | 614 (100.0%) | 3.08 |
Median Household Size in Loris
The median household size in Loris is 2.23 persons per household, with married-couple households (321 | 29.7%) accounting for the largest median household size of 3.3 persons per household. non-family households (466 | 43.1%) represent the smallest median household size with 1.05 persons per household.
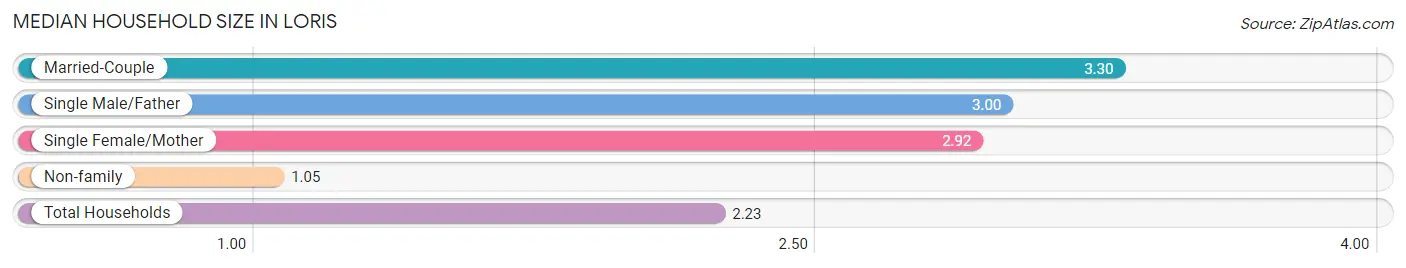
| Household Type | # Households | Household Size |
| Married-Couple | 321 (29.7%) | 3.30 |
| Single Male/Father | 20 (1.8%) | 3.00 |
| Single Female/Mother | 273 (25.3%) | 2.92 |
| Non-family | 466 (43.1%) | 1.05 |
| Total Households | 1,080 (100.0%) | 2.23 |
Household Size by Marriage Status in Loris
Out of a total of 1,080 households in Loris, 614 (56.9%) are family households, while 466 (43.1%) are nonfamily households. The most numerous type of family households are 2-person households, comprising 380, and the most common type of nonfamily households are 1-person households, comprising 442.
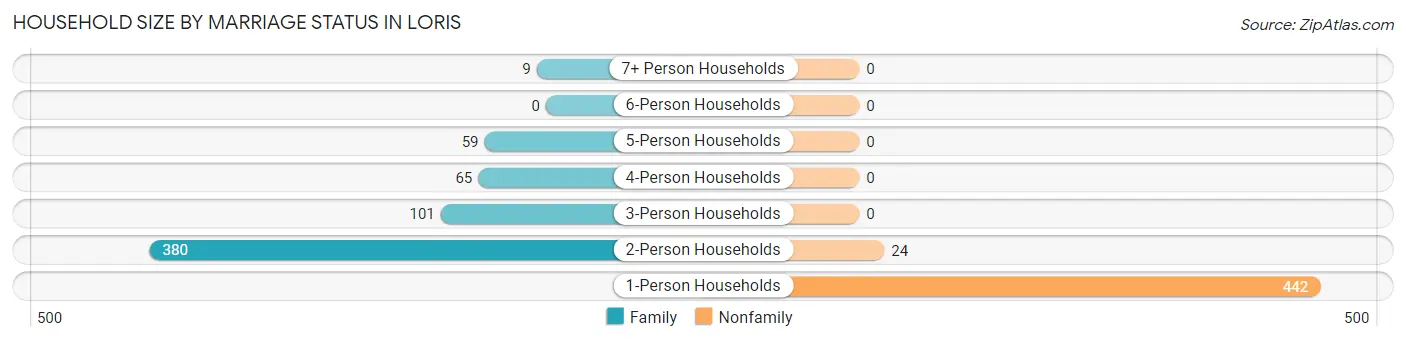
| Household Size | Family Households | Nonfamily Households |
| 1-Person Households | - | 442 (40.9%) |
| 2-Person Households | 380 (35.2%) | 24 (2.2%) |
| 3-Person Households | 101 (9.3%) | 0 (0.0%) |
| 4-Person Households | 65 (6.0%) | 0 (0.0%) |
| 5-Person Households | 59 (5.5%) | 0 (0.0%) |
| 6-Person Households | 0 (0.0%) | 0 (0.0%) |
| 7+ Person Households | 9 (0.8%) | 0 (0.0%) |
| Total | 614 (56.9%) | 466 (43.1%) |
Female Fertility in Loris
Fertility by Age in Loris
Average fertility rate in Loris is 9.0 births per 1,000 women. Women in the age bracket of 20 to 34 years have the highest fertility rate with 24.0 births per 1,000 women. Women in the age bracket of 20 to 34 years acount for 100.0% of all women with births.
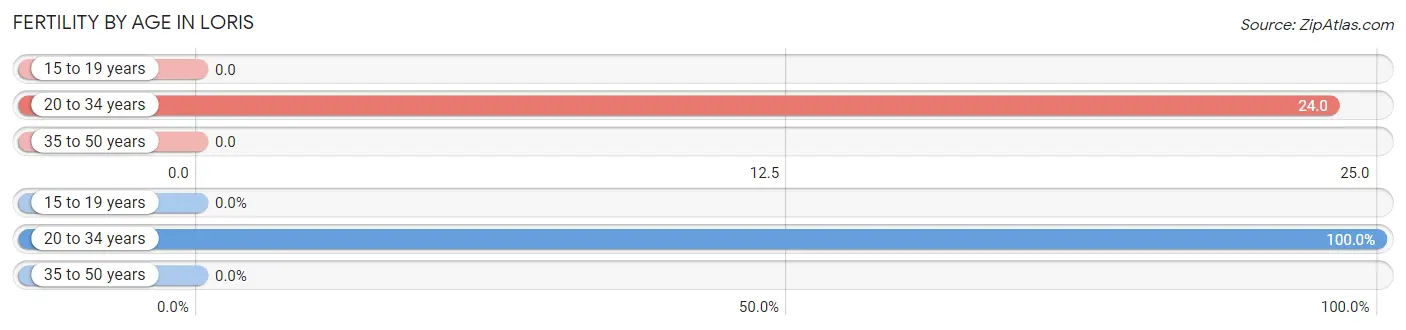
| Age Bracket | Women with Births | Births / 1,000 Women |
| 15 to 19 years | 0 (0.0%) | 0.0 |
| 20 to 34 years | 5 (100.0%) | 24.0 |
| 35 to 50 years | 0 (0.0%) | 0.0 |
| Total | 5 (100.0%) | 9.0 |
Fertility by Age by Marriage Status in Loris
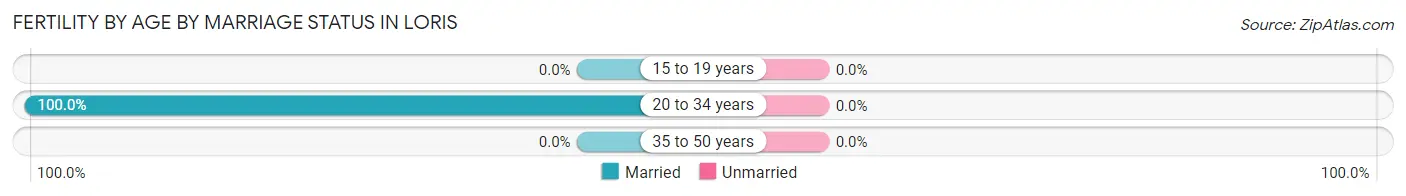
| Age Bracket | Married | Unmarried |
| 15 to 19 years | 0 (0.0%) | 0 (0.0%) |
| 20 to 34 years | 5 (100.0%) | 0 (0.0%) |
| 35 to 50 years | 0 (0.0%) | 0 (0.0%) |
| Total | 5 (100.0%) | 0 (0.0%) |
Fertility by Education in Loris
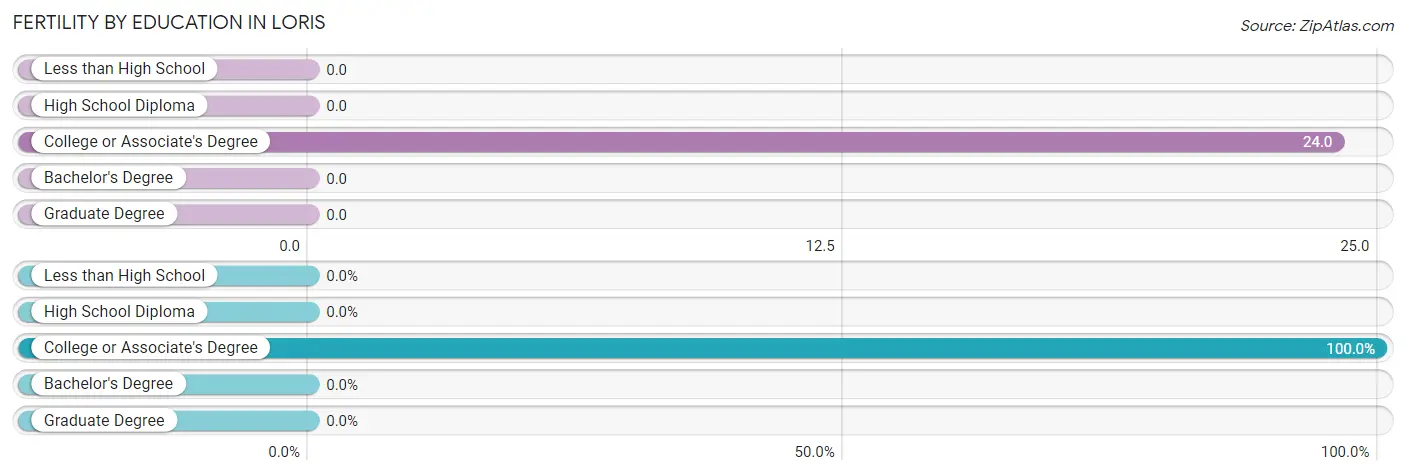
| Educational Attainment | Women with Births | Births / 1,000 Women |
| Less than High School | 0 (0.0%) | 0.0 |
| High School Diploma | 0 (0.0%) | 0.0 |
| College or Associate's Degree | 5 (100.0%) | 24.0 |
| Bachelor's Degree | 0 (0.0%) | 0.0 |
| Graduate Degree | 0 (0.0%) | 0.0 |
| Total | 5 (100.0%) | 9.0 |
Fertility by Education by Marriage Status in Loris
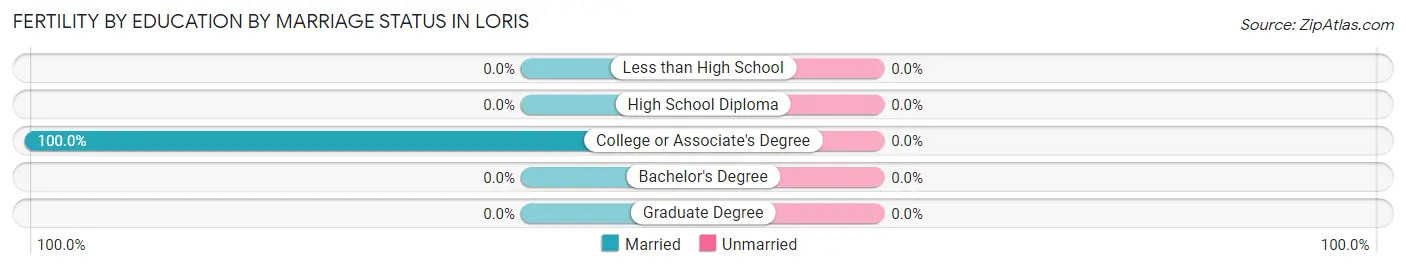
| Educational Attainment | Married | Unmarried |
| Less than High School | 0 (0.0%) | 0 (0.0%) |
| High School Diploma | 0 (0.0%) | 0 (0.0%) |
| College or Associate's Degree | 5 (100.0%) | 0 (0.0%) |
| Bachelor's Degree | 0 (0.0%) | 0 (0.0%) |
| Graduate Degree | 0 (0.0%) | 0 (0.0%) |
| Total | 5 (100.0%) | 0 (0.0%) |
Employment Characteristics in Loris
Employment by Class of Employer in Loris
Among the 810 employed individuals in Loris, private company employees (451 | 55.7%), state government employees (125 | 15.4%), and local government employees (117 | 14.4%) make up the most common classes of employment.
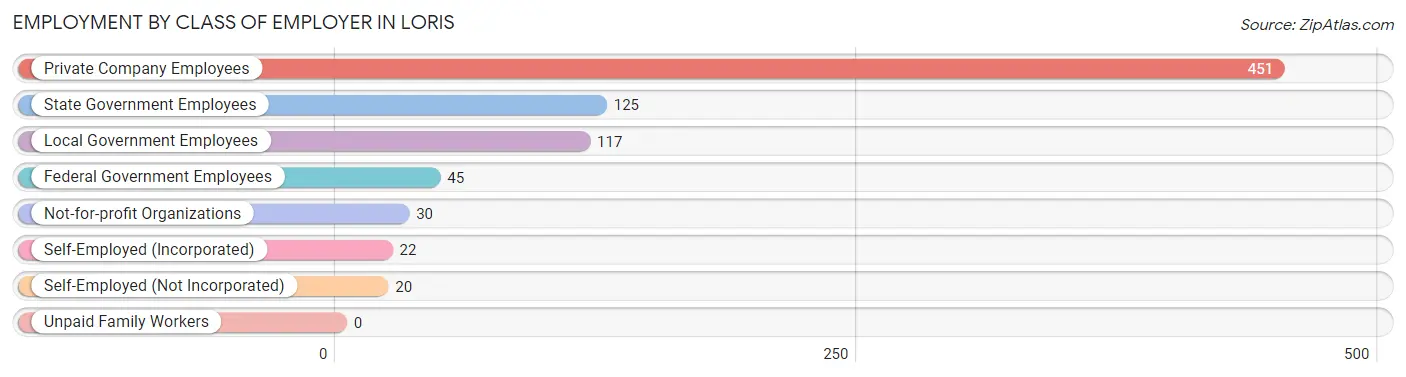
| Employer Class | # Employees | % Employees |
| Private Company Employees | 451 | 55.7% |
| Self-Employed (Incorporated) | 22 | 2.7% |
| Self-Employed (Not Incorporated) | 20 | 2.5% |
| Not-for-profit Organizations | 30 | 3.7% |
| Local Government Employees | 117 | 14.4% |
| State Government Employees | 125 | 15.4% |
| Federal Government Employees | 45 | 5.6% |
| Unpaid Family Workers | 0 | 0.0% |
| Total | 810 | 100.0% |
Employment Status by Age in Loris
According to the labor force statistics for Loris, out of the total population over 16 years of age (1,980), 49.2% or 974 individuals are in the labor force, with 8.4% or 82 of them unemployed. The age group with the highest labor force participation rate is 30 to 34 years, with 94.3% or 99 individuals in the labor force. Within the labor force, the 20 to 24 years age range has the highest percentage of unemployed individuals, with 24.1% or 26 of them being unemployed.
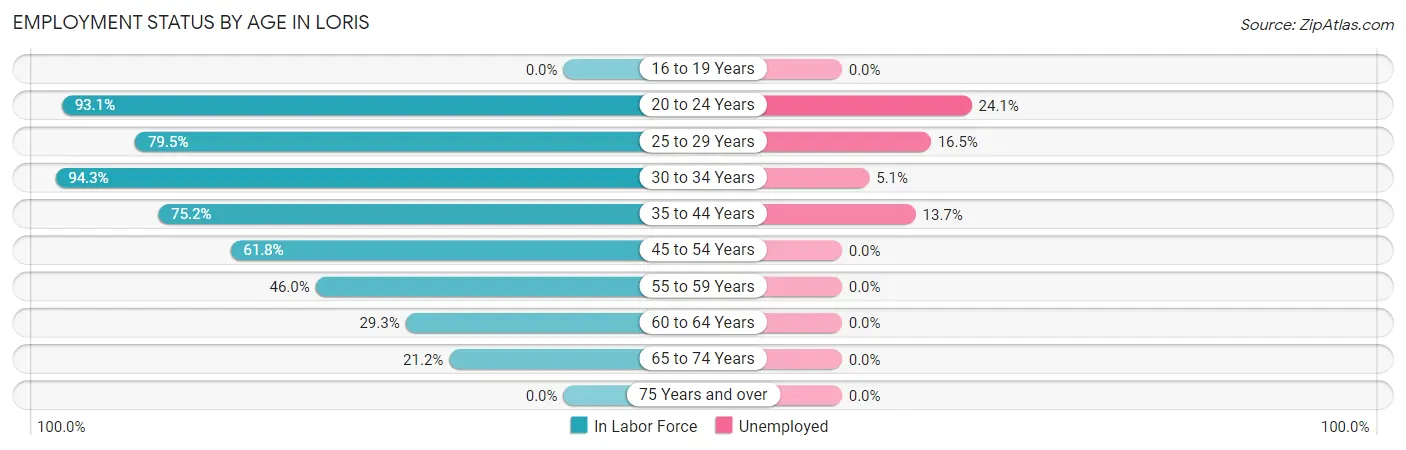
| Age Bracket | In Labor Force | Unemployed |
| 16 to 19 Years | 0 (0.0%) | 0 (0.0%) |
| 20 to 24 Years | 108 (93.1%) | 26 (24.1%) |
| 25 to 29 Years | 97 (79.5%) | 16 (16.5%) |
| 30 to 34 Years | 99 (94.3%) | 5 (5.1%) |
| 35 to 44 Years | 261 (75.2%) | 36 (13.7%) |
| 45 to 54 Years | 147 (61.8%) | 0 (0.0%) |
| 55 to 59 Years | 134 (46.0%) | 0 (0.0%) |
| 60 to 64 Years | 39 (29.3%) | 0 (0.0%) |
| 65 to 74 Years | 89 (21.2%) | 0 (0.0%) |
| 75 Years and over | 0 (0.0%) | 0 (0.0%) |
| Total | 974 (49.2%) | 82 (8.4%) |
Employment Status by Educational Attainment in Loris
According to labor force statistics for Loris, 62.9% of individuals (777) out of the total population between 25 and 64 years of age (1,236) are in the labor force, with 7.1% or 55 of them being unemployed. The group with the highest labor force participation rate are those with the educational attainment of bachelor's degree or higher, with 85.1% or 165 individuals in the labor force. Within the labor force, individuals with less than high school education have the highest percentage of unemployment, with 100.0% or 27 of them being unemployed.
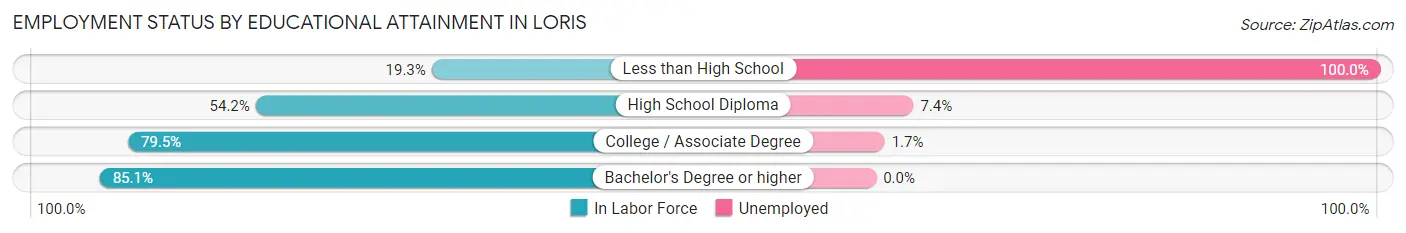
| Educational Attainment | In Labor Force | Unemployed |
| Less than High School | 27 (19.3%) | 140 (100.0%) |
| High School Diploma | 283 (54.2%) | 39 (7.4%) |
| College / Associate Degree | 302 (79.5%) | 6 (1.7%) |
| Bachelor's Degree or higher | 165 (85.1%) | 0 (0.0%) |
| Total | 777 (62.9%) | 88 (7.1%) |
Employment Occupations by Sex in Loris
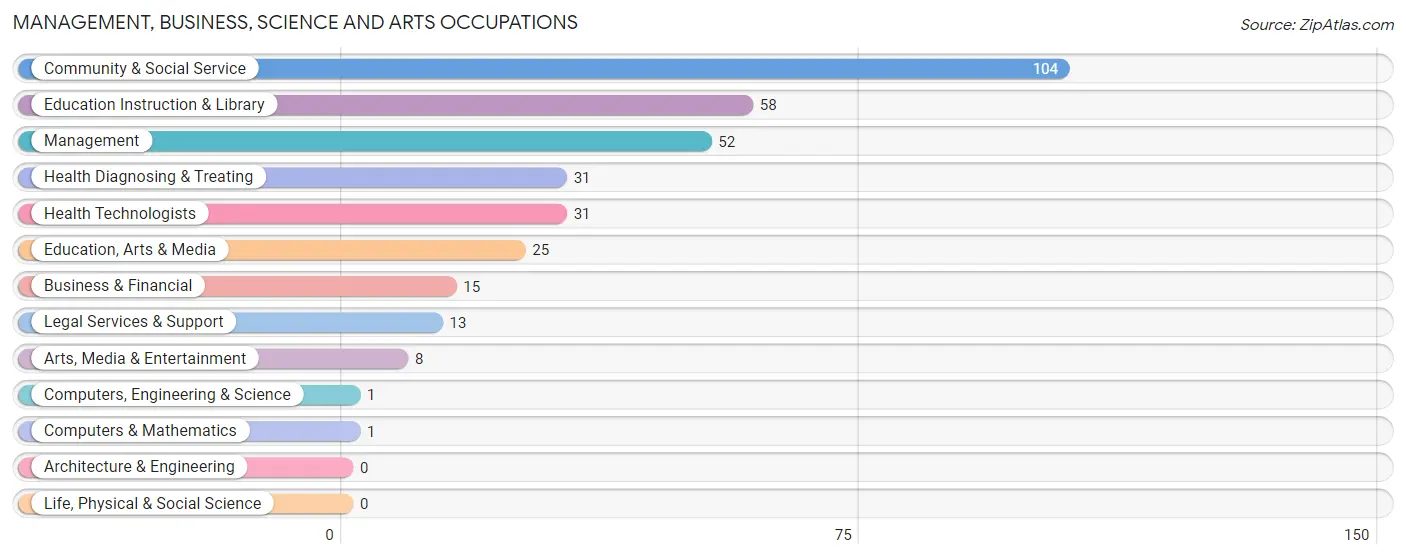
Management, Business, Science and Arts Occupations
The most common Management, Business, Science and Arts occupations in Loris are Community & Social Service (104 | 12.0%), Education Instruction & Library (58 | 6.7%), Management (52 | 6.0%), Health Diagnosing & Treating (31 | 3.6%), and Health Technologists (31 | 3.6%).
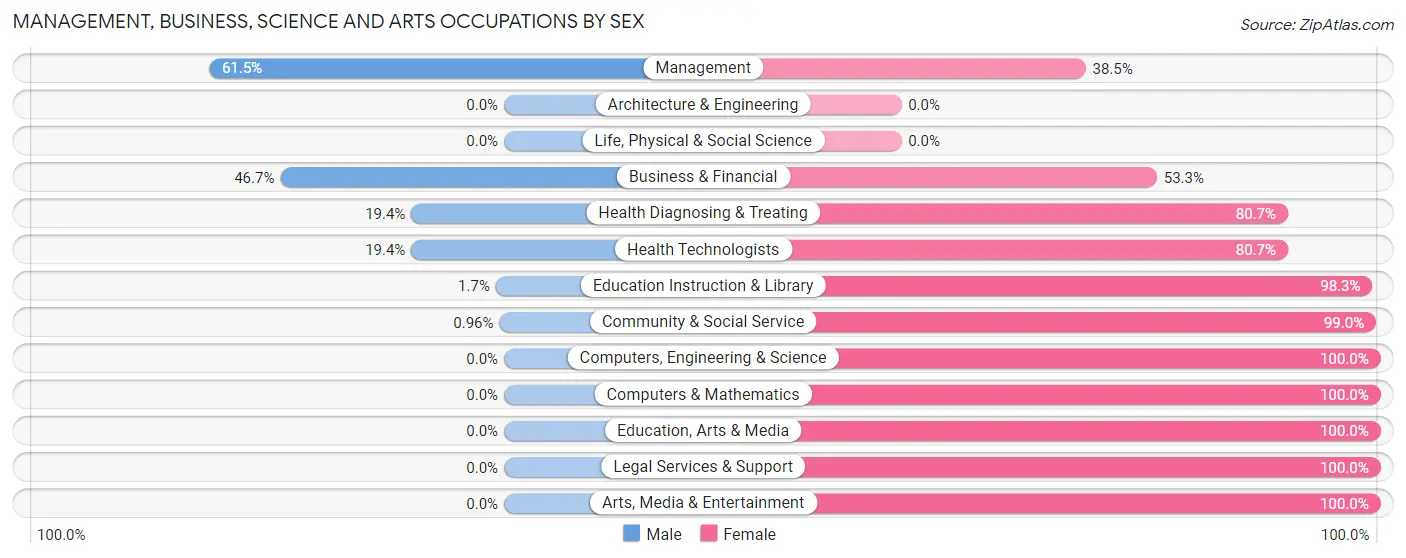
Management, Business, Science and Arts Occupations by Sex
Within the Management, Business, Science and Arts occupations in Loris, the most male-oriented occupations are Management (61.5%), Business & Financial (46.7%), and Health Diagnosing & Treating (19.4%), while the most female-oriented occupations are Computers, Engineering & Science (100.0%), Computers & Mathematics (100.0%), and Education, Arts & Media (100.0%).
| Occupation | Male | Female |
| Management | 32 (61.5%) | 20 (38.5%) |
| Business & Financial | 7 (46.7%) | 8 (53.3%) |
| Computers, Engineering & Science | 0 (0.0%) | 1 (100.0%) |
| Computers & Mathematics | 0 (0.0%) | 1 (100.0%) |
| Architecture & Engineering | 0 (0.0%) | 0 (0.0%) |
| Life, Physical & Social Science | 0 (0.0%) | 0 (0.0%) |
| Community & Social Service | 1 (1.0%) | 103 (99.0%) |
| Education, Arts & Media | 0 (0.0%) | 25 (100.0%) |
| Legal Services & Support | 0 (0.0%) | 13 (100.0%) |
| Education Instruction & Library | 1 (1.7%) | 57 (98.3%) |
| Arts, Media & Entertainment | 0 (0.0%) | 8 (100.0%) |
| Health Diagnosing & Treating | 6 (19.4%) | 25 (80.6%) |
| Health Technologists | 6 (19.4%) | 25 (80.6%) |
| Total (Category) | 46 (22.7%) | 157 (77.3%) |
| Total (Overall) | 283 (32.6%) | 584 (67.4%) |
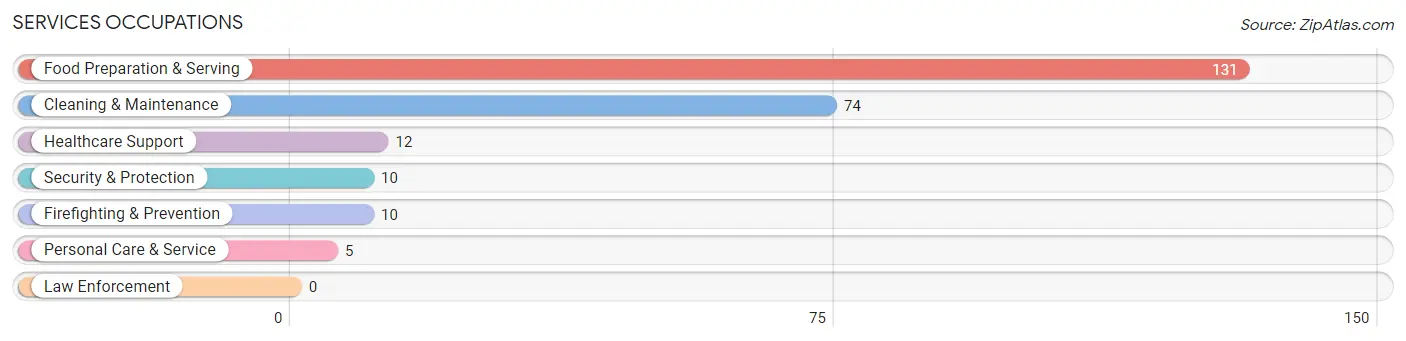
Services Occupations
The most common Services occupations in Loris are Food Preparation & Serving (131 | 15.1%), Cleaning & Maintenance (74 | 8.5%), Healthcare Support (12 | 1.4%), Security & Protection (10 | 1.1%), and Firefighting & Prevention (10 | 1.1%).
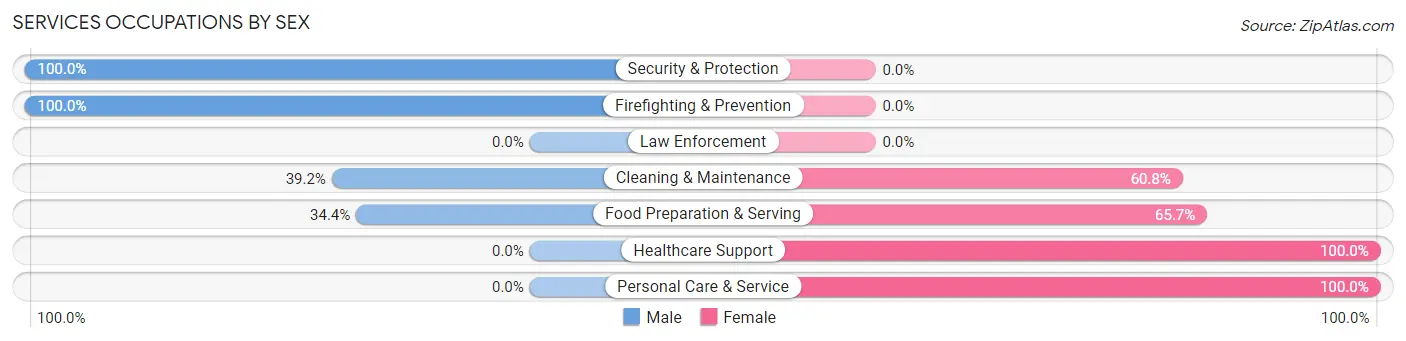
Services Occupations by Sex
Within the Services occupations in Loris, the most male-oriented occupations are Security & Protection (100.0%), Firefighting & Prevention (100.0%), and Cleaning & Maintenance (39.2%), while the most female-oriented occupations are Healthcare Support (100.0%), Personal Care & Service (100.0%), and Food Preparation & Serving (65.6%).
| Occupation | Male | Female |
| Healthcare Support | 0 (0.0%) | 12 (100.0%) |
| Security & Protection | 10 (100.0%) | 0 (0.0%) |
| Firefighting & Prevention | 10 (100.0%) | 0 (0.0%) |
| Law Enforcement | 0 (0.0%) | 0 (0.0%) |
| Food Preparation & Serving | 45 (34.4%) | 86 (65.6%) |
| Cleaning & Maintenance | 29 (39.2%) | 45 (60.8%) |
| Personal Care & Service | 0 (0.0%) | 5 (100.0%) |
| Total (Category) | 84 (36.2%) | 148 (63.8%) |
| Total (Overall) | 283 (32.6%) | 584 (67.4%) |
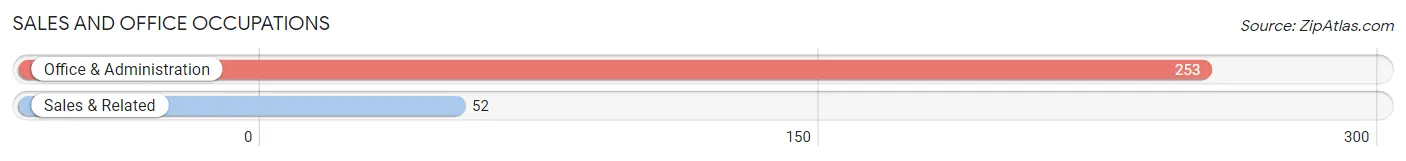
Sales and Office Occupations
The most common Sales and Office occupations in Loris are Office & Administration (253 | 29.2%), and Sales & Related (52 | 6.0%).
Sales and Office Occupations by Sex
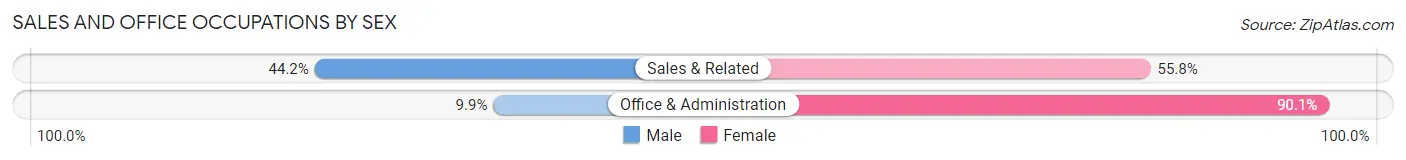
| Occupation | Male | Female |
| Sales & Related | 23 (44.2%) | 29 (55.8%) |
| Office & Administration | 25 (9.9%) | 228 (90.1%) |
| Total (Category) | 48 (15.7%) | 257 (84.3%) |
| Total (Overall) | 283 (32.6%) | 584 (67.4%) |
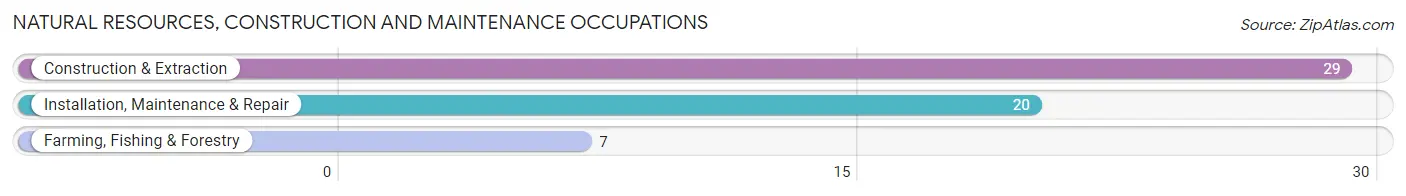
Natural Resources, Construction and Maintenance Occupations
The most common Natural Resources, Construction and Maintenance occupations in Loris are Construction & Extraction (29 | 3.3%), Installation, Maintenance & Repair (20 | 2.3%), and Farming, Fishing & Forestry (7 | 0.8%).
Natural Resources, Construction and Maintenance Occupations by Sex
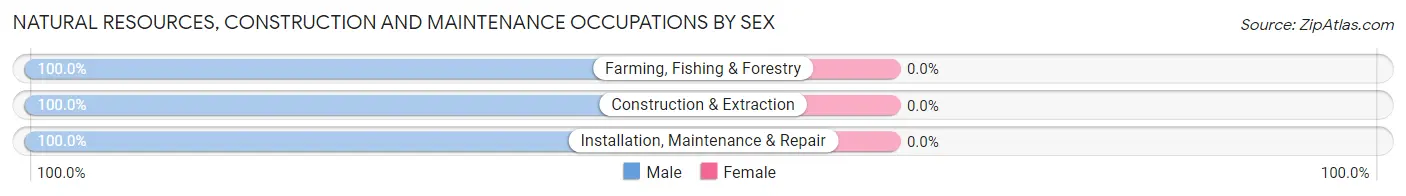
| Occupation | Male | Female |
| Farming, Fishing & Forestry | 7 (100.0%) | 0 (0.0%) |
| Construction & Extraction | 29 (100.0%) | 0 (0.0%) |
| Installation, Maintenance & Repair | 20 (100.0%) | 0 (0.0%) |
| Total (Category) | 56 (100.0%) | 0 (0.0%) |
| Total (Overall) | 283 (32.6%) | 584 (67.4%) |
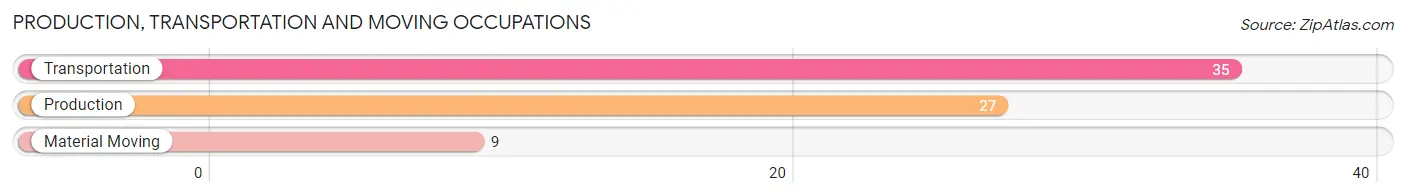
Production, Transportation and Moving Occupations
The most common Production, Transportation and Moving occupations in Loris are Transportation (35 | 4.0%), Production (27 | 3.1%), and Material Moving (9 | 1.0%).
Production, Transportation and Moving Occupations by Sex
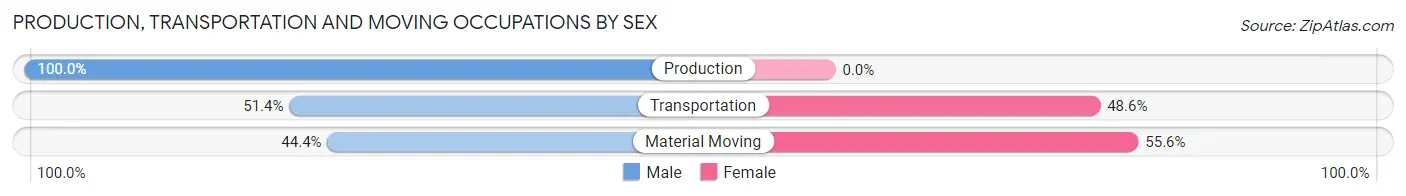
| Occupation | Male | Female |
| Production | 27 (100.0%) | 0 (0.0%) |
| Transportation | 18 (51.4%) | 17 (48.6%) |
| Material Moving | 4 (44.4%) | 5 (55.6%) |
| Total (Category) | 49 (69.0%) | 22 (31.0%) |
| Total (Overall) | 283 (32.6%) | 584 (67.4%) |
Employment Industries by Sex in Loris
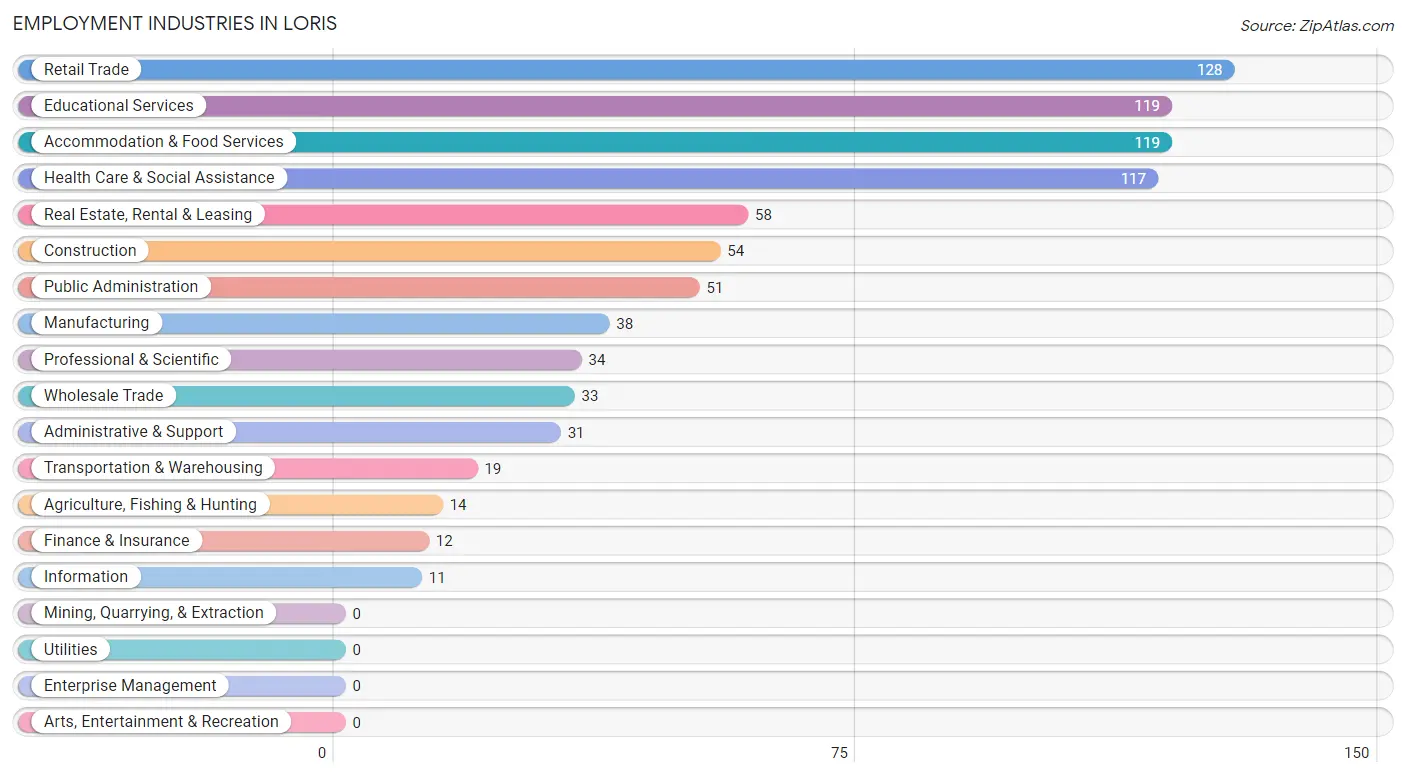
Employment Industries in Loris
The major employment industries in Loris include Retail Trade (128 | 14.8%), Educational Services (119 | 13.7%), Accommodation & Food Services (119 | 13.7%), Health Care & Social Assistance (117 | 13.5%), and Real Estate, Rental & Leasing (58 | 6.7%).
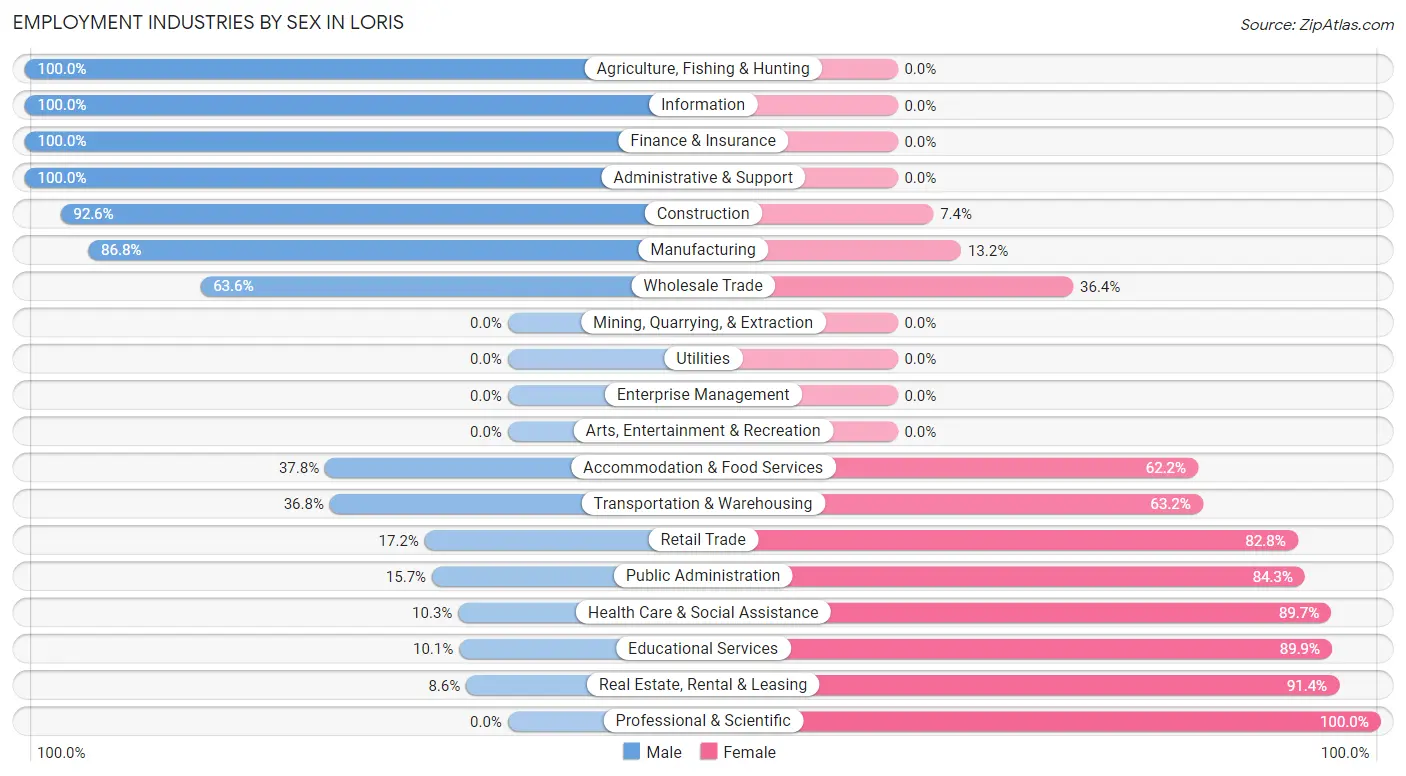
Employment Industries by Sex in Loris
The Loris industries that see more men than women are Agriculture, Fishing & Hunting (100.0%), Information (100.0%), and Finance & Insurance (100.0%), whereas the industries that tend to have a higher number of women are Professional & Scientific (100.0%), Real Estate, Rental & Leasing (91.4%), and Educational Services (89.9%).
| Industry | Male | Female |
| Agriculture, Fishing & Hunting | 14 (100.0%) | 0 (0.0%) |
| Mining, Quarrying, & Extraction | 0 (0.0%) | 0 (0.0%) |
| Construction | 50 (92.6%) | 4 (7.4%) |
| Manufacturing | 33 (86.8%) | 5 (13.2%) |
| Wholesale Trade | 21 (63.6%) | 12 (36.4%) |
| Retail Trade | 22 (17.2%) | 106 (82.8%) |
| Transportation & Warehousing | 7 (36.8%) | 12 (63.2%) |
| Utilities | 0 (0.0%) | 0 (0.0%) |
| Information | 11 (100.0%) | 0 (0.0%) |
| Finance & Insurance | 12 (100.0%) | 0 (0.0%) |
| Real Estate, Rental & Leasing | 5 (8.6%) | 53 (91.4%) |
| Professional & Scientific | 0 (0.0%) | 34 (100.0%) |
| Enterprise Management | 0 (0.0%) | 0 (0.0%) |
| Administrative & Support | 31 (100.0%) | 0 (0.0%) |
| Educational Services | 12 (10.1%) | 107 (89.9%) |
| Health Care & Social Assistance | 12 (10.3%) | 105 (89.7%) |
| Arts, Entertainment & Recreation | 0 (0.0%) | 0 (0.0%) |
| Accommodation & Food Services | 45 (37.8%) | 74 (62.2%) |
| Public Administration | 8 (15.7%) | 43 (84.3%) |
| Total | 283 (32.6%) | 584 (67.4%) |
Education in Loris
School Enrollment in Loris
The most common levels of schooling among the 487 students in Loris are high school (202 | 41.5%), middle school (107 | 22.0%), and nursery / preschool (65 | 13.4%).
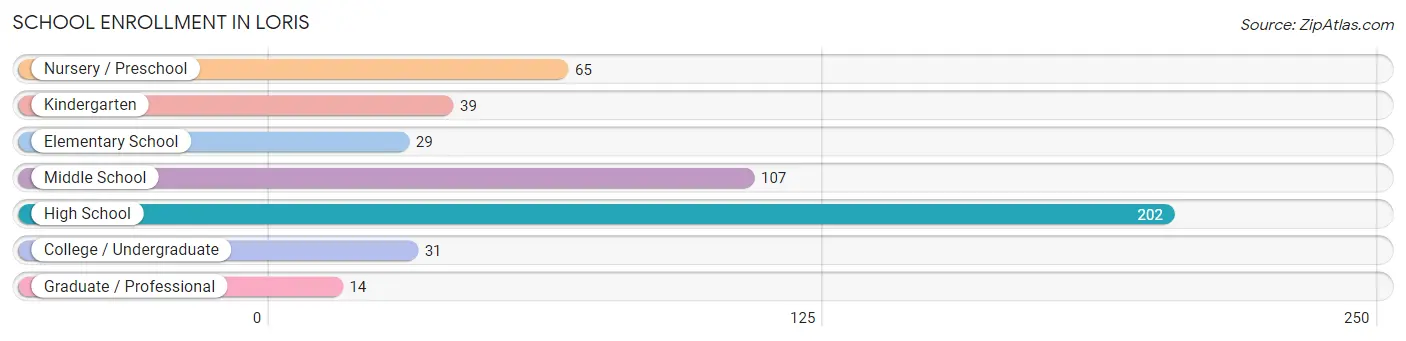
| School Level | # Students | % Students |
| Nursery / Preschool | 65 | 13.4% |
| Kindergarten | 39 | 8.0% |
| Elementary School | 29 | 5.9% |
| Middle School | 107 | 22.0% |
| High School | 202 | 41.5% |
| College / Undergraduate | 31 | 6.4% |
| Graduate / Professional | 14 | 2.9% |
| Total | 487 | 100.0% |
School Enrollment by Age by Funding Source in Loris
Out of a total of 487 students who are enrolled in schools in Loris, 64 (13.1%) attend a private institution, while the remaining 423 (86.9%) are enrolled in public schools. The age group of 25 to 34 year olds has the highest likelihood of being enrolled in private schools, with 6 (42.9% in the age bracket) enrolled. Conversely, the age group of 18 to 19 year olds has the lowest likelihood of being enrolled in a private school, with 12 (100.0% in the age bracket) attending a public institution.
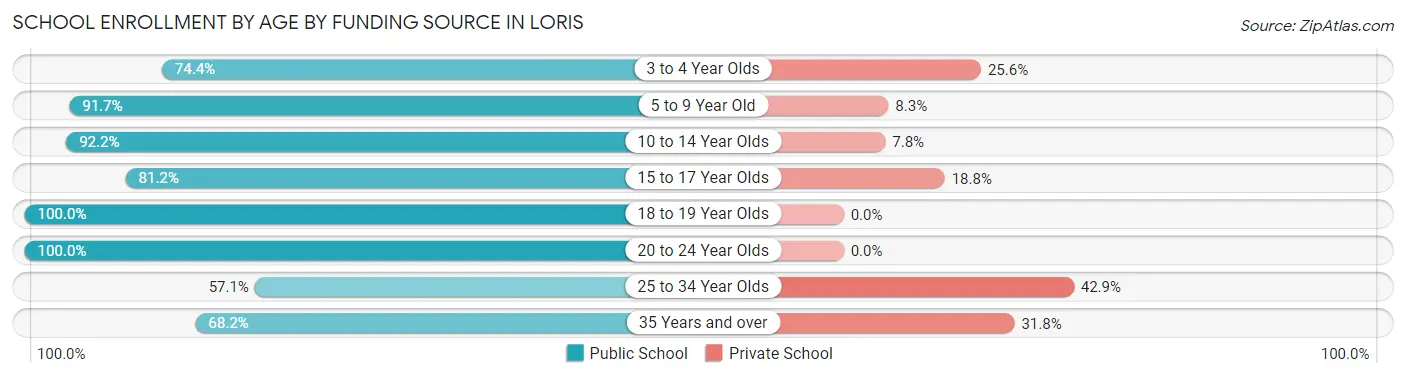
| Age Bracket | Public School | Private School |
| 3 to 4 Year Olds | 32 (74.4%) | 11 (25.6%) |
| 5 to 9 Year Old | 77 (91.7%) | 7 (8.3%) |
| 10 to 14 Year Olds | 202 (92.2%) | 17 (7.8%) |
| 15 to 17 Year Olds | 69 (81.2%) | 16 (18.8%) |
| 18 to 19 Year Olds | 12 (100.0%) | 0 (0.0%) |
| 20 to 24 Year Olds | 8 (100.0%) | 0 (0.0%) |
| 25 to 34 Year Olds | 8 (57.1%) | 6 (42.9%) |
| 35 Years and over | 15 (68.2%) | 7 (31.8%) |
| Total | 423 (86.9%) | 64 (13.1%) |
Educational Attainment by Field of Study in Loris
Science & technology (61 | 23.3%), education (60 | 22.9%), psychology (28 | 10.7%), business (28 | 10.7%), and liberal arts & history (22 | 8.4%) are the most common fields of study among 262 individuals in Loris who have obtained a bachelor's degree or higher.
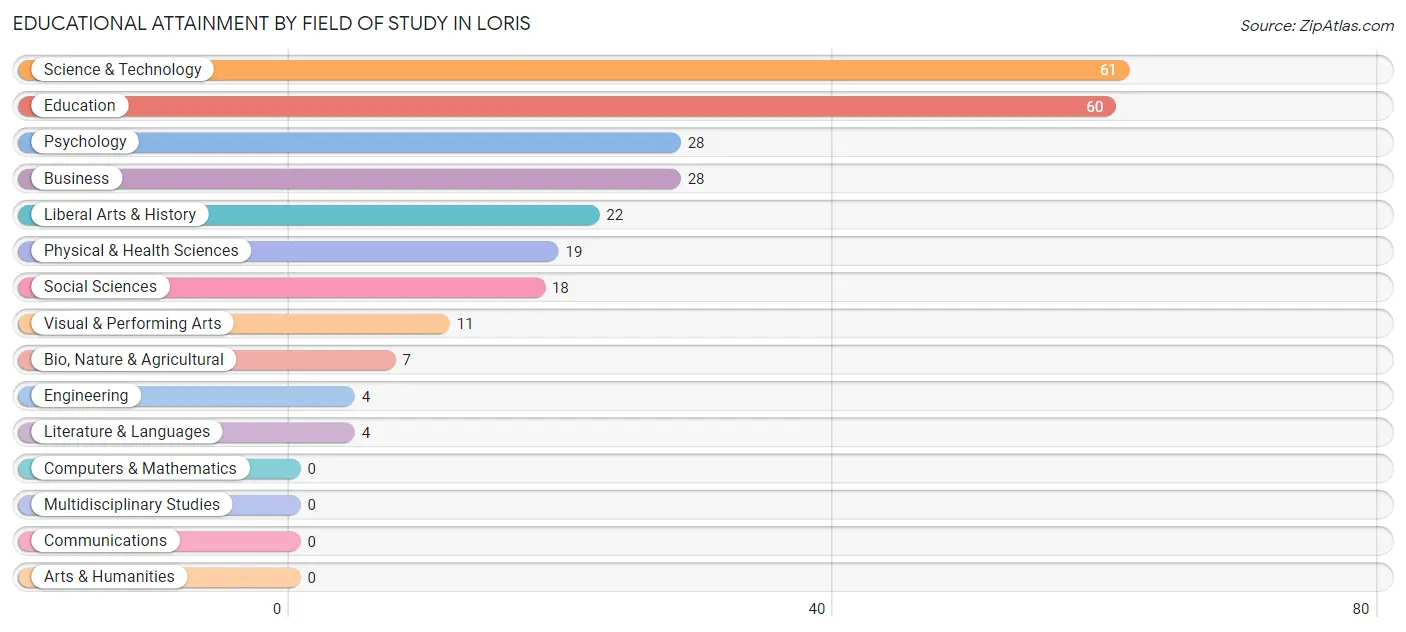
| Field of Study | # Graduates | % Graduates |
| Computers & Mathematics | 0 | 0.0% |
| Bio, Nature & Agricultural | 7 | 2.7% |
| Physical & Health Sciences | 19 | 7.2% |
| Psychology | 28 | 10.7% |
| Social Sciences | 18 | 6.9% |
| Engineering | 4 | 1.5% |
| Multidisciplinary Studies | 0 | 0.0% |
| Science & Technology | 61 | 23.3% |
| Business | 28 | 10.7% |
| Education | 60 | 22.9% |
| Literature & Languages | 4 | 1.5% |
| Liberal Arts & History | 22 | 8.4% |
| Visual & Performing Arts | 11 | 4.2% |
| Communications | 0 | 0.0% |
| Arts & Humanities | 0 | 0.0% |
| Total | 262 | 100.0% |
Transportation & Commute in Loris
Vehicle Availability by Sex in Loris
The most prevalent vehicle ownership categories in Loris are males with 2 vehicles (175, accounting for 58.7%) and females with 2 vehicles (203, making up 34.6%).
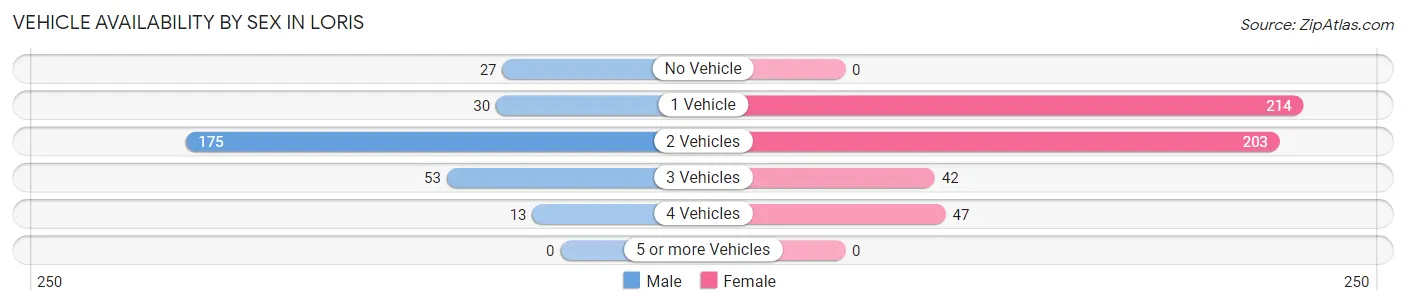
| Vehicles Available | Male | Female |
| No Vehicle | 27 (9.1%) | 0 (0.0%) |
| 1 Vehicle | 30 (10.1%) | 214 (42.3%) |
| 2 Vehicles | 175 (58.7%) | 203 (40.1%) |
| 3 Vehicles | 53 (17.8%) | 42 (8.3%) |
| 4 Vehicles | 13 (4.4%) | 47 (9.3%) |
| 5 or more Vehicles | 0 (0.0%) | 0 (0.0%) |
| Total | 298 (100.0%) | 506 (100.0%) |
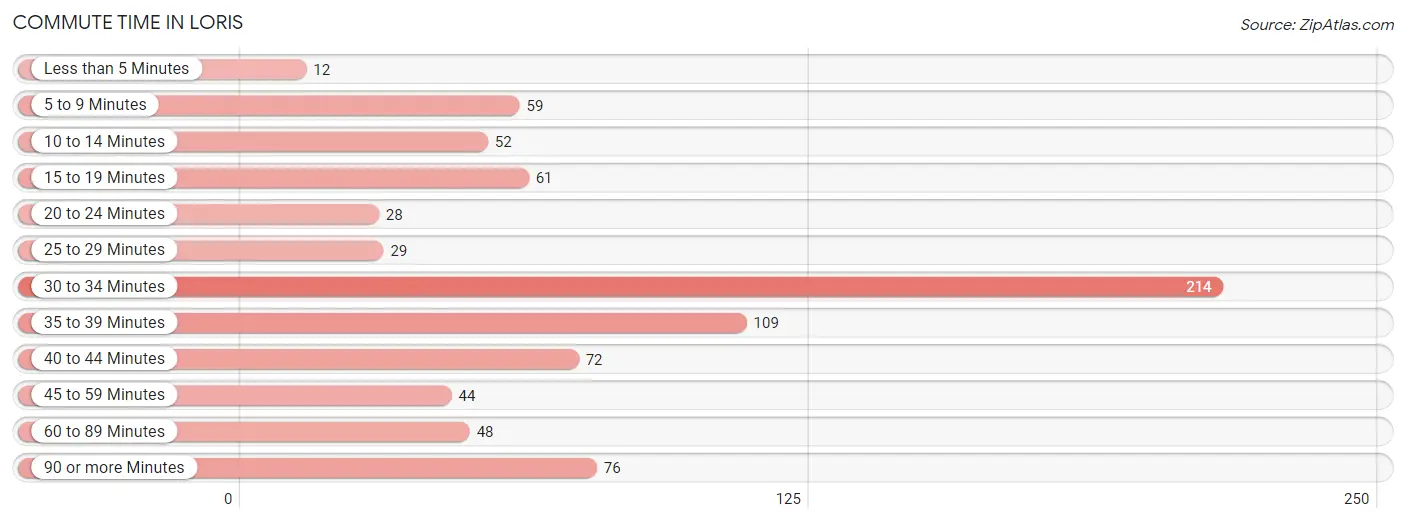
Commute Time in Loris
The most frequently occuring commute durations in Loris are 30 to 34 minutes (214 commuters, 26.6%), 35 to 39 minutes (109 commuters, 13.6%), and 90 or more minutes (76 commuters, 9.5%).
| Commute Time | # Commuters | % Commuters |
| Less than 5 Minutes | 12 | 1.5% |
| 5 to 9 Minutes | 59 | 7.3% |
| 10 to 14 Minutes | 52 | 6.5% |
| 15 to 19 Minutes | 61 | 7.6% |
| 20 to 24 Minutes | 28 | 3.5% |
| 25 to 29 Minutes | 29 | 3.6% |
| 30 to 34 Minutes | 214 | 26.6% |
| 35 to 39 Minutes | 109 | 13.6% |
| 40 to 44 Minutes | 72 | 9.0% |
| 45 to 59 Minutes | 44 | 5.5% |
| 60 to 89 Minutes | 48 | 6.0% |
| 90 or more Minutes | 76 | 9.5% |
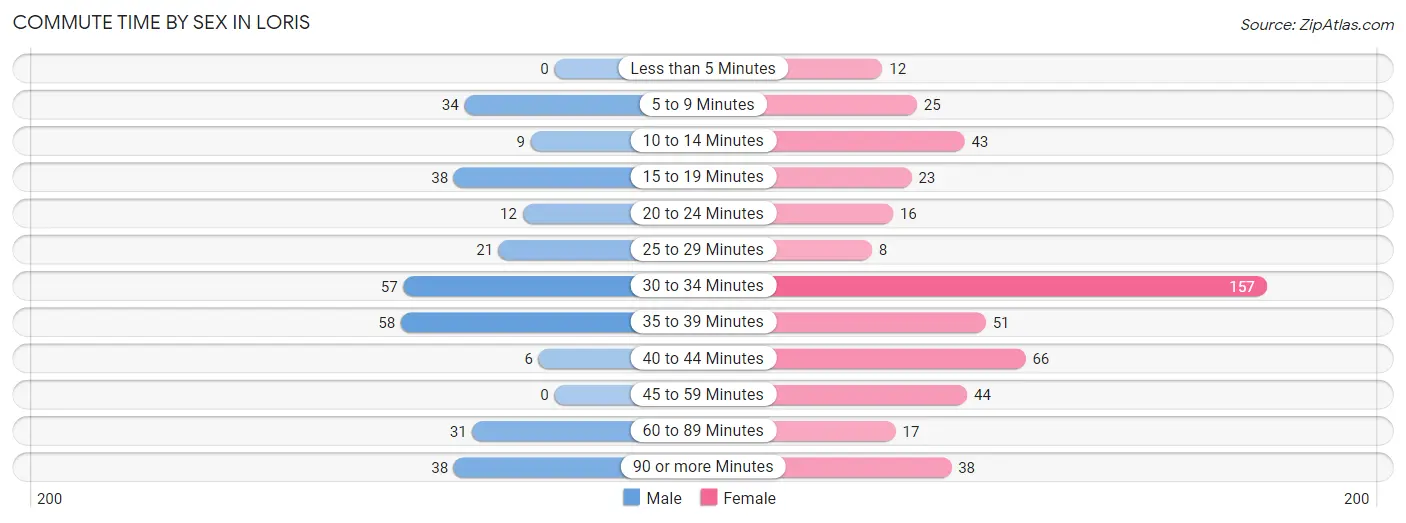
Commute Time by Sex in Loris
The most common commute times in Loris are 35 to 39 minutes (58 commuters, 19.1%) for males and 30 to 34 minutes (157 commuters, 31.4%) for females.
| Commute Time | Male | Female |
| Less than 5 Minutes | 0 (0.0%) | 12 (2.4%) |
| 5 to 9 Minutes | 34 (11.2%) | 25 (5.0%) |
| 10 to 14 Minutes | 9 (3.0%) | 43 (8.6%) |
| 15 to 19 Minutes | 38 (12.5%) | 23 (4.6%) |
| 20 to 24 Minutes | 12 (4.0%) | 16 (3.2%) |
| 25 to 29 Minutes | 21 (6.9%) | 8 (1.6%) |
| 30 to 34 Minutes | 57 (18.8%) | 157 (31.4%) |
| 35 to 39 Minutes | 58 (19.1%) | 51 (10.2%) |
| 40 to 44 Minutes | 6 (2.0%) | 66 (13.2%) |
| 45 to 59 Minutes | 0 (0.0%) | 44 (8.8%) |
| 60 to 89 Minutes | 31 (10.2%) | 17 (3.4%) |
| 90 or more Minutes | 38 (12.5%) | 38 (7.6%) |
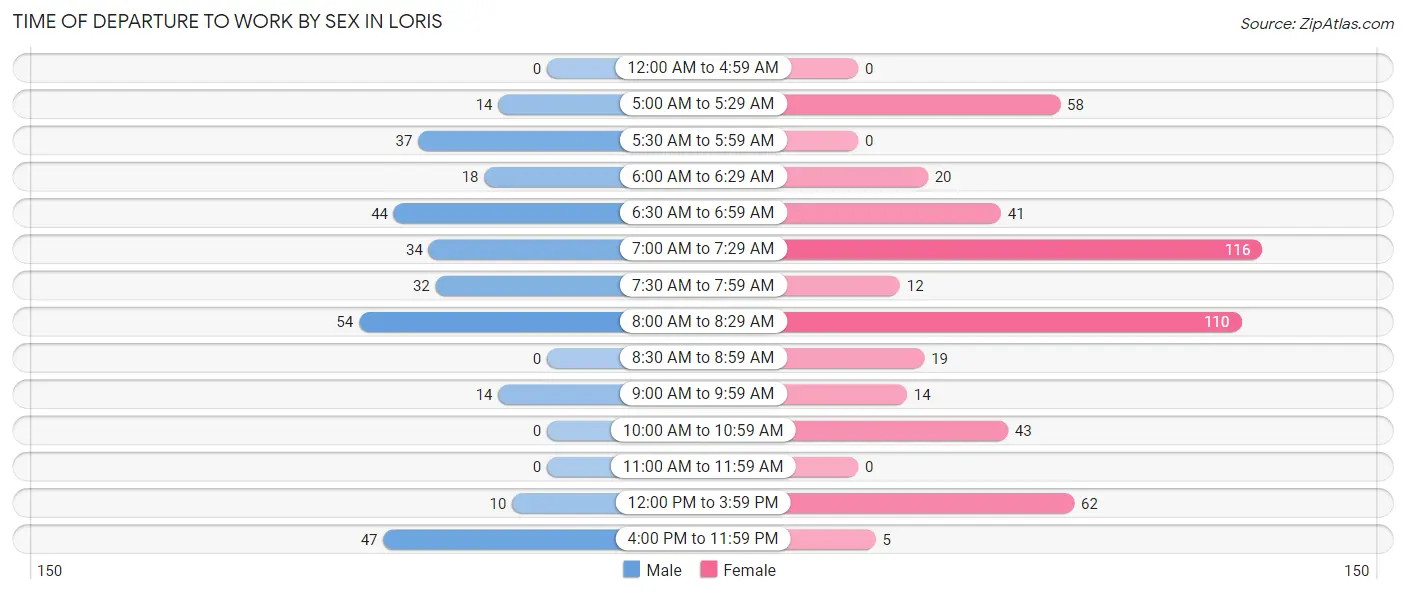
Time of Departure to Work by Sex in Loris
The most frequent times of departure to work in Loris are 8:00 AM to 8:29 AM (54, 17.8%) for males and 7:00 AM to 7:29 AM (116, 23.2%) for females.
| Time of Departure | Male | Female |
| 12:00 AM to 4:59 AM | 0 (0.0%) | 0 (0.0%) |
| 5:00 AM to 5:29 AM | 14 (4.6%) | 58 (11.6%) |
| 5:30 AM to 5:59 AM | 37 (12.2%) | 0 (0.0%) |
| 6:00 AM to 6:29 AM | 18 (5.9%) | 20 (4.0%) |
| 6:30 AM to 6:59 AM | 44 (14.5%) | 41 (8.2%) |
| 7:00 AM to 7:29 AM | 34 (11.2%) | 116 (23.2%) |
| 7:30 AM to 7:59 AM | 32 (10.5%) | 12 (2.4%) |
| 8:00 AM to 8:29 AM | 54 (17.8%) | 110 (22.0%) |
| 8:30 AM to 8:59 AM | 0 (0.0%) | 19 (3.8%) |
| 9:00 AM to 9:59 AM | 14 (4.6%) | 14 (2.8%) |
| 10:00 AM to 10:59 AM | 0 (0.0%) | 43 (8.6%) |
| 11:00 AM to 11:59 AM | 0 (0.0%) | 0 (0.0%) |
| 12:00 PM to 3:59 PM | 10 (3.3%) | 62 (12.4%) |
| 4:00 PM to 11:59 PM | 47 (15.5%) | 5 (1.0%) |
| Total | 304 (100.0%) | 500 (100.0%) |
Housing Occupancy in Loris
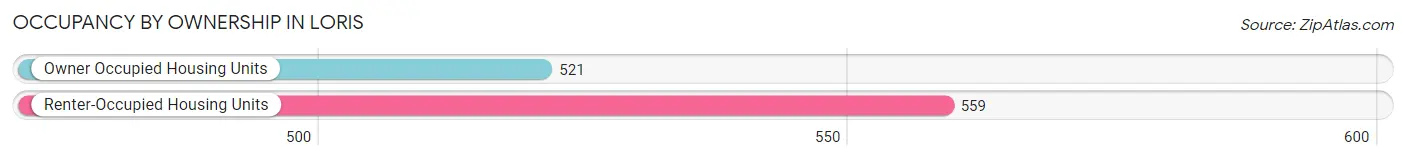
Occupancy by Ownership in Loris
Of the total 1,080 dwellings in Loris, owner-occupied units account for 521 (48.2%), while renter-occupied units make up 559 (51.8%).
| Occupancy | # Housing Units | % Housing Units |
| Owner Occupied Housing Units | 521 | 48.2% |
| Renter-Occupied Housing Units | 559 | 51.8% |
| Total Occupied Housing Units | 1,080 | 100.0% |
Occupancy by Household Size in Loris
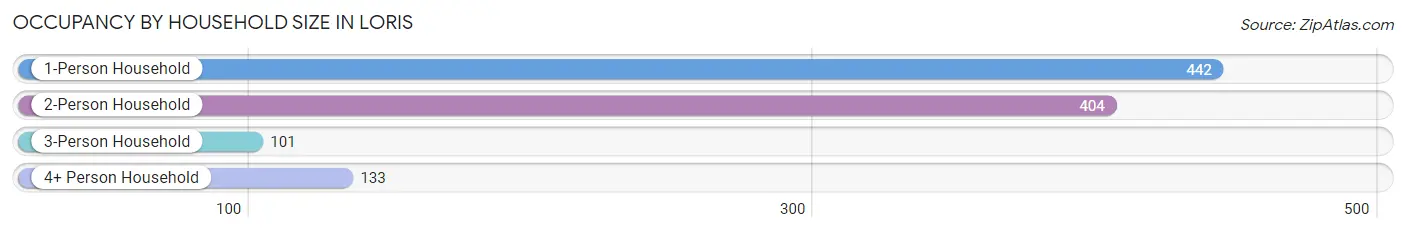
| Household Size | # Housing Units | % Housing Units |
| 1-Person Household | 442 | 40.9% |
| 2-Person Household | 404 | 37.4% |
| 3-Person Household | 101 | 9.3% |
| 4+ Person Household | 133 | 12.3% |
| Total Housing Units | 1,080 | 100.0% |
Occupancy by Ownership by Household Size in Loris
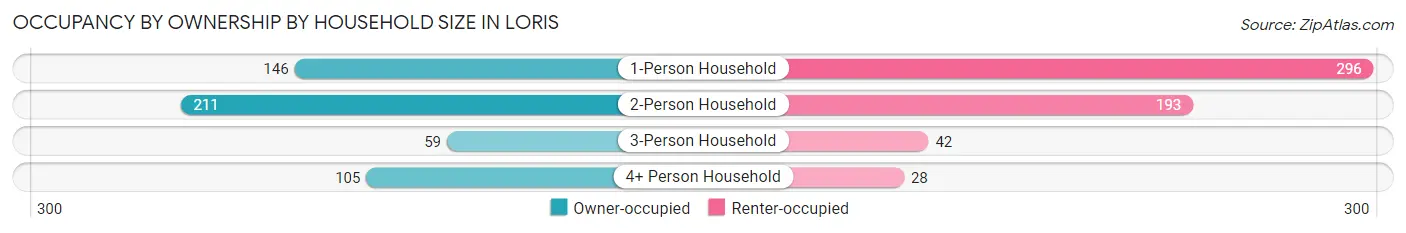
| Household Size | Owner-occupied | Renter-occupied |
| 1-Person Household | 146 (33.0%) | 296 (67.0%) |
| 2-Person Household | 211 (52.2%) | 193 (47.8%) |
| 3-Person Household | 59 (58.4%) | 42 (41.6%) |
| 4+ Person Household | 105 (78.9%) | 28 (21.0%) |
| Total Housing Units | 521 (48.2%) | 559 (51.8%) |
Occupancy by Educational Attainment in Loris
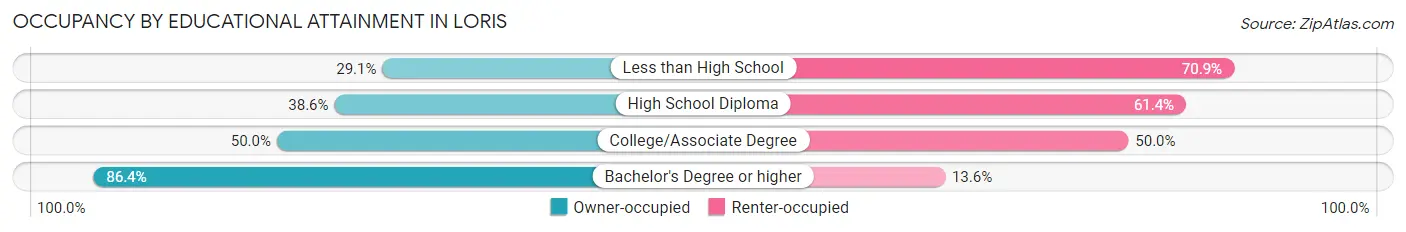
| Household Size | Owner-occupied | Renter-occupied |
| Less than High School | 41 (29.1%) | 100 (70.9%) |
| High School Diploma | 181 (38.6%) | 288 (61.4%) |
| College/Associate Degree | 147 (50.0%) | 147 (50.0%) |
| Bachelor's Degree or higher | 152 (86.4%) | 24 (13.6%) |
Occupancy by Age of Householder in Loris
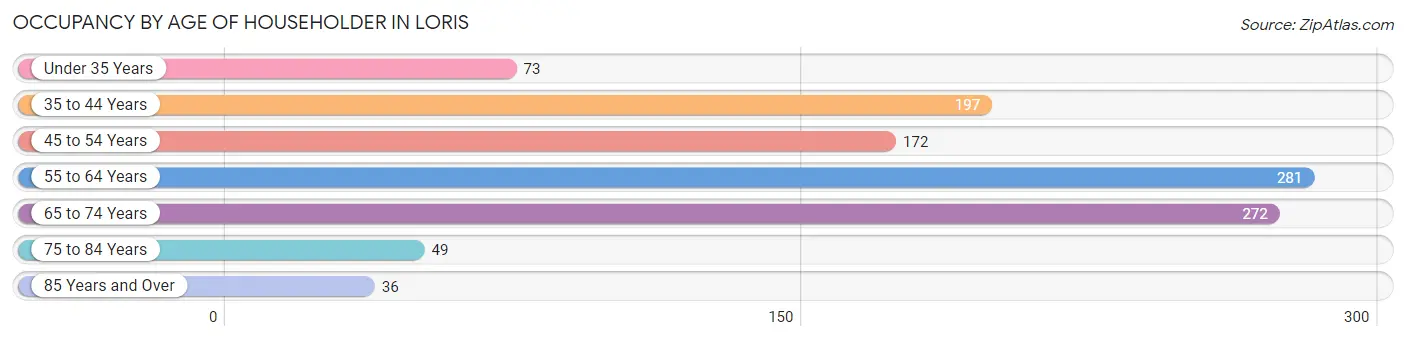
| Age Bracket | # Households | % Households |
| Under 35 Years | 73 | 6.8% |
| 35 to 44 Years | 197 | 18.2% |
| 45 to 54 Years | 172 | 15.9% |
| 55 to 64 Years | 281 | 26.0% |
| 65 to 74 Years | 272 | 25.2% |
| 75 to 84 Years | 49 | 4.5% |
| 85 Years and Over | 36 | 3.3% |
| Total | 1,080 | 100.0% |
Housing Finances in Loris
Median Income by Occupancy in Loris
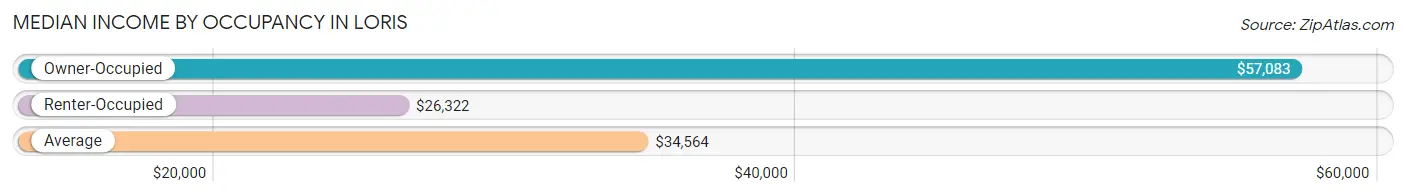
| Occupancy Type | # Households | Median Income |
| Owner-Occupied | 521 (48.2%) | $57,083 |
| Renter-Occupied | 559 (51.8%) | $26,322 |
| Average | 1,080 (100.0%) | $34,564 |
Occupancy by Householder Income Bracket in Loris
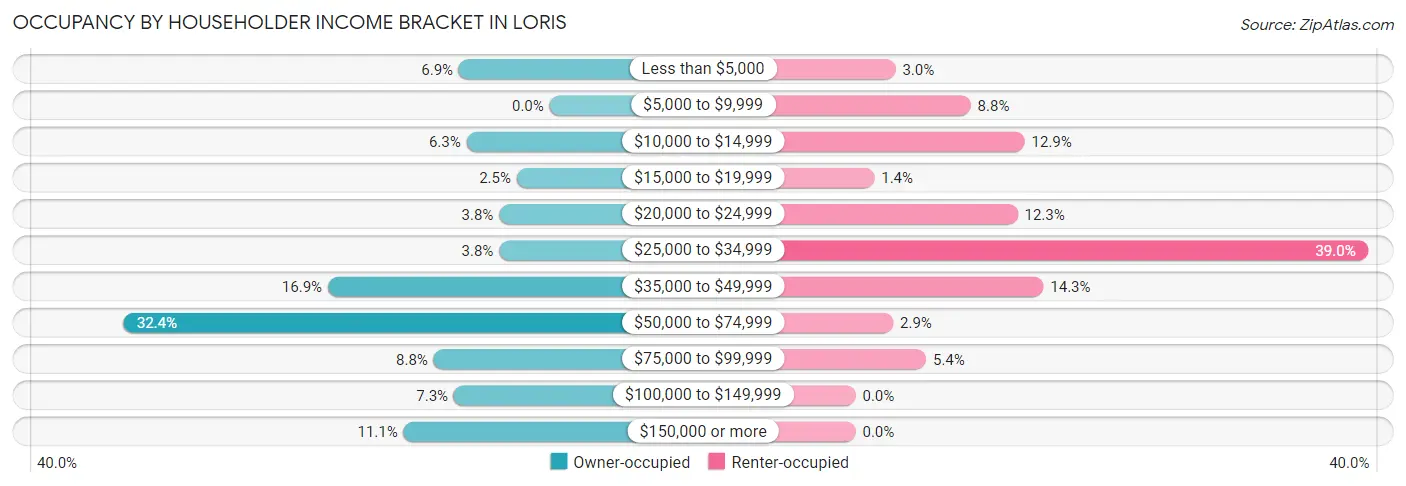
| Income Bracket | Owner-occupied | Renter-occupied |
| Less than $5,000 | 36 (6.9%) | 17 (3.0%) |
| $5,000 to $9,999 | 0 (0.0%) | 49 (8.8%) |
| $10,000 to $14,999 | 33 (6.3%) | 72 (12.9%) |
| $15,000 to $19,999 | 13 (2.5%) | 8 (1.4%) |
| $20,000 to $24,999 | 20 (3.8%) | 69 (12.3%) |
| $25,000 to $34,999 | 20 (3.8%) | 218 (39.0%) |
| $35,000 to $49,999 | 88 (16.9%) | 80 (14.3%) |
| $50,000 to $74,999 | 169 (32.4%) | 16 (2.9%) |
| $75,000 to $99,999 | 46 (8.8%) | 30 (5.4%) |
| $100,000 to $149,999 | 38 (7.3%) | 0 (0.0%) |
| $150,000 or more | 58 (11.1%) | 0 (0.0%) |
| Total | 521 (100.0%) | 559 (100.0%) |
Monthly Housing Cost Tiers in Loris
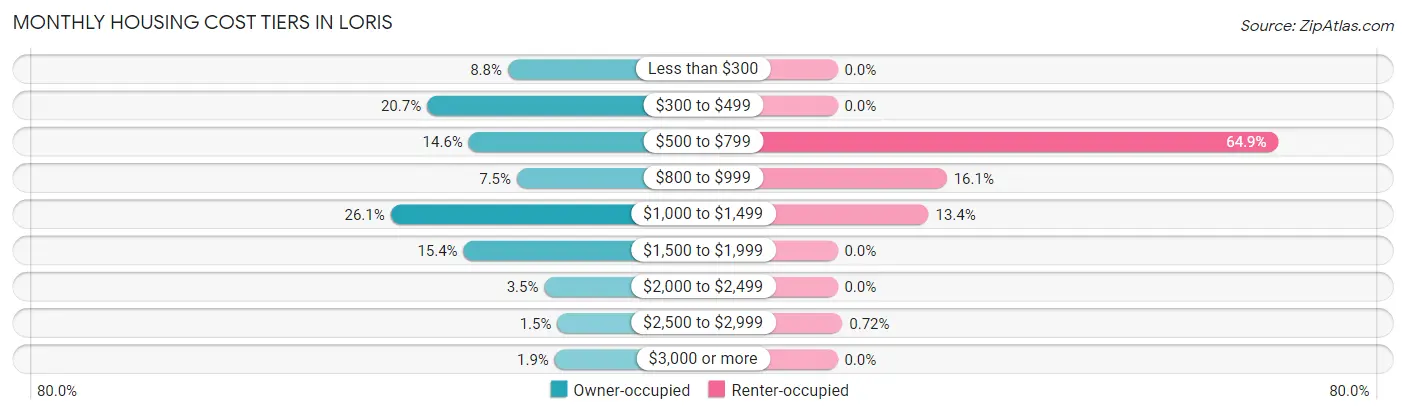
| Monthly Cost | Owner-occupied | Renter-occupied |
| Less than $300 | 46 (8.8%) | 0 (0.0%) |
| $300 to $499 | 108 (20.7%) | 0 (0.0%) |
| $500 to $799 | 76 (14.6%) | 363 (64.9%) |
| $800 to $999 | 39 (7.5%) | 90 (16.1%) |
| $1,000 to $1,499 | 136 (26.1%) | 75 (13.4%) |
| $1,500 to $1,999 | 80 (15.4%) | 0 (0.0%) |
| $2,000 to $2,499 | 18 (3.5%) | 0 (0.0%) |
| $2,500 to $2,999 | 8 (1.5%) | 4 (0.7%) |
| $3,000 or more | 10 (1.9%) | 0 (0.0%) |
| Total | 521 (100.0%) | 559 (100.0%) |
Physical Housing Characteristics in Loris
Housing Structures in Loris
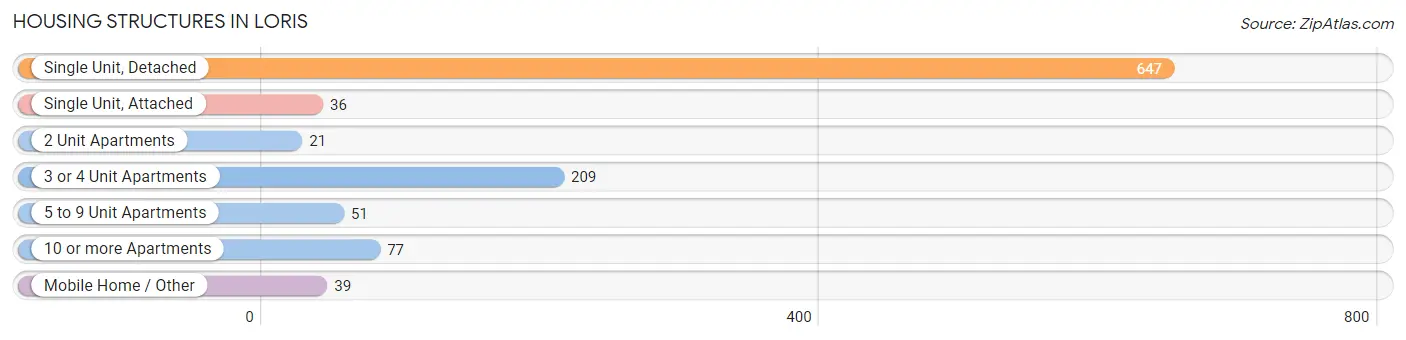
| Structure Type | # Housing Units | % Housing Units |
| Single Unit, Detached | 647 | 59.9% |
| Single Unit, Attached | 36 | 3.3% |
| 2 Unit Apartments | 21 | 1.9% |
| 3 or 4 Unit Apartments | 209 | 19.4% |
| 5 to 9 Unit Apartments | 51 | 4.7% |
| 10 or more Apartments | 77 | 7.1% |
| Mobile Home / Other | 39 | 3.6% |
| Total | 1,080 | 100.0% |
Housing Structures by Occupancy in Loris
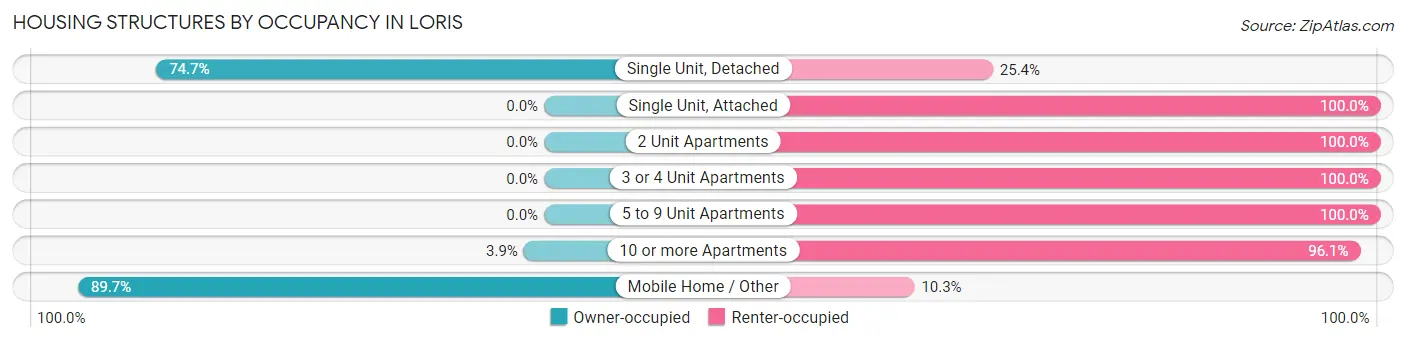
| Structure Type | Owner-occupied | Renter-occupied |
| Single Unit, Detached | 483 (74.7%) | 164 (25.4%) |
| Single Unit, Attached | 0 (0.0%) | 36 (100.0%) |
| 2 Unit Apartments | 0 (0.0%) | 21 (100.0%) |
| 3 or 4 Unit Apartments | 0 (0.0%) | 209 (100.0%) |
| 5 to 9 Unit Apartments | 0 (0.0%) | 51 (100.0%) |
| 10 or more Apartments | 3 (3.9%) | 74 (96.1%) |
| Mobile Home / Other | 35 (89.7%) | 4 (10.3%) |
| Total | 521 (48.2%) | 559 (51.8%) |
Housing Structures by Number of Rooms in Loris
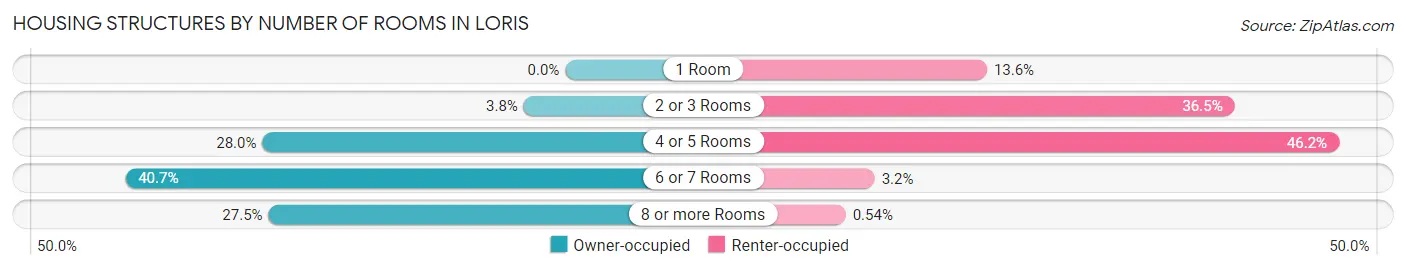
| Number of Rooms | Owner-occupied | Renter-occupied |
| 1 Room | 0 (0.0%) | 76 (13.6%) |
| 2 or 3 Rooms | 20 (3.8%) | 204 (36.5%) |
| 4 or 5 Rooms | 146 (28.0%) | 258 (46.2%) |
| 6 or 7 Rooms | 212 (40.7%) | 18 (3.2%) |
| 8 or more Rooms | 143 (27.5%) | 3 (0.5%) |
| Total | 521 (100.0%) | 559 (100.0%) |
Housing Structure by Heating Type in Loris
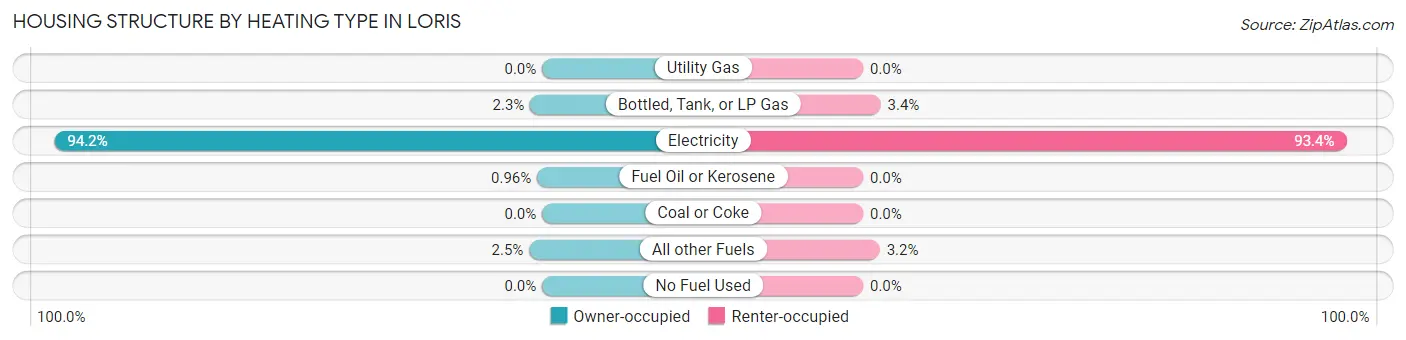
| Heating Type | Owner-occupied | Renter-occupied |
| Utility Gas | 0 (0.0%) | 0 (0.0%) |
| Bottled, Tank, or LP Gas | 12 (2.3%) | 19 (3.4%) |
| Electricity | 491 (94.2%) | 522 (93.4%) |
| Fuel Oil or Kerosene | 5 (1.0%) | 0 (0.0%) |
| Coal or Coke | 0 (0.0%) | 0 (0.0%) |
| All other Fuels | 13 (2.5%) | 18 (3.2%) |
| No Fuel Used | 0 (0.0%) | 0 (0.0%) |
| Total | 521 (100.0%) | 559 (100.0%) |
Household Vehicle Usage in Loris
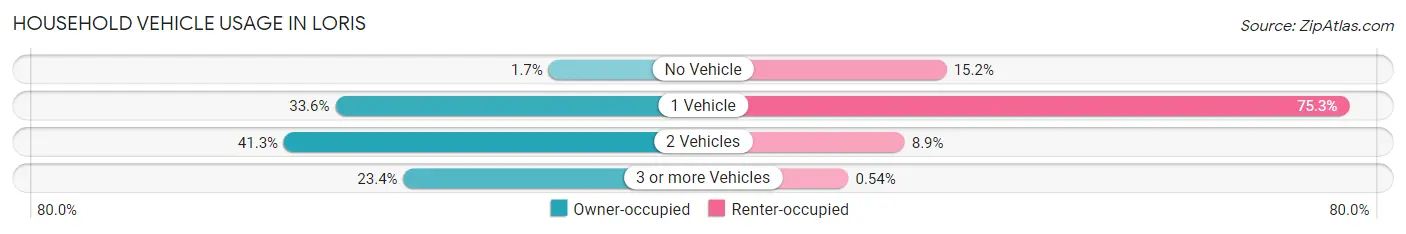
| Vehicles per Household | Owner-occupied | Renter-occupied |
| No Vehicle | 9 (1.7%) | 85 (15.2%) |
| 1 Vehicle | 175 (33.6%) | 421 (75.3%) |
| 2 Vehicles | 215 (41.3%) | 50 (8.9%) |
| 3 or more Vehicles | 122 (23.4%) | 3 (0.5%) |
| Total | 521 (100.0%) | 559 (100.0%) |
Real Estate & Mortgages in Loris
Real Estate and Mortgage Overview in Loris
| Characteristic | Without Mortgage | With Mortgage |
| Housing Units | 234 | 287 |
| Median Property Value | $173,400 | $204,500 |
| Median Household Income | $47,727 | $38 |
| Monthly Housing Costs | $435 | $10 |
| Real Estate Taxes | $948 | $8 |
Property Value by Mortgage Status in Loris
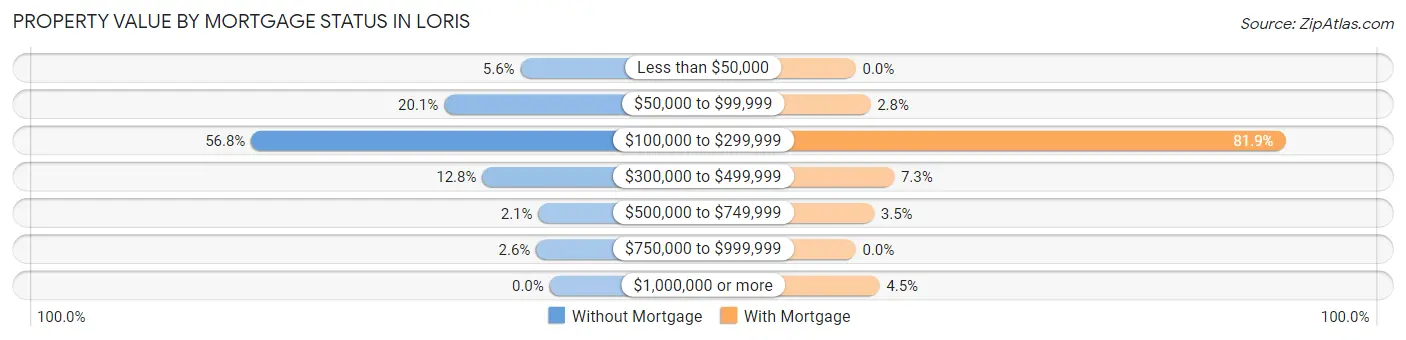
| Property Value | Without Mortgage | With Mortgage |
| Less than $50,000 | 13 (5.6%) | 0 (0.0%) |
| $50,000 to $99,999 | 47 (20.1%) | 8 (2.8%) |
| $100,000 to $299,999 | 133 (56.8%) | 235 (81.9%) |
| $300,000 to $499,999 | 30 (12.8%) | 21 (7.3%) |
| $500,000 to $749,999 | 5 (2.1%) | 10 (3.5%) |
| $750,000 to $999,999 | 6 (2.6%) | 0 (0.0%) |
| $1,000,000 or more | 0 (0.0%) | 13 (4.5%) |
| Total | 234 (100.0%) | 287 (100.0%) |
Household Income by Mortgage Status in Loris
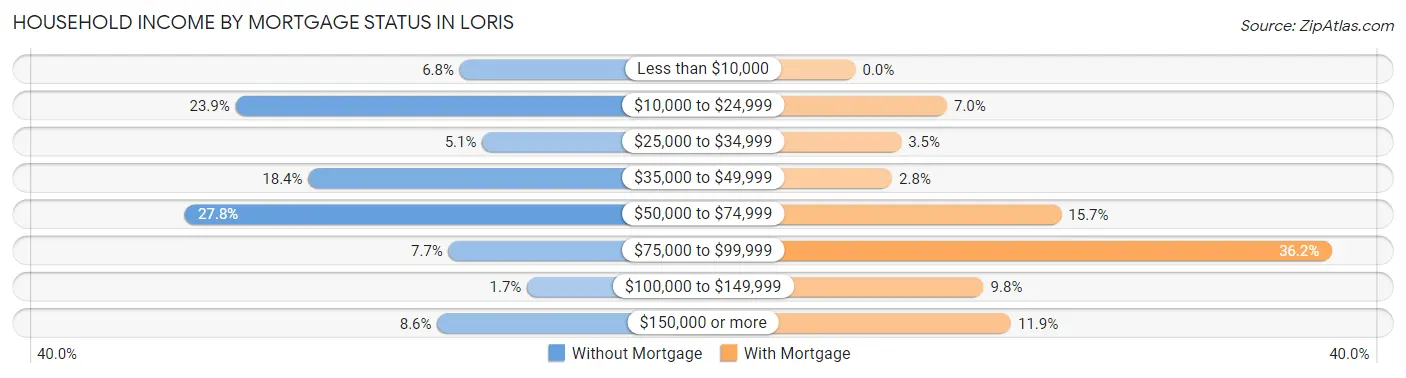
| Household Income | Without Mortgage | With Mortgage |
| Less than $10,000 | 16 (6.8%) | 0 (0.0%) |
| $10,000 to $24,999 | 56 (23.9%) | 20 (7.0%) |
| $25,000 to $34,999 | 12 (5.1%) | 10 (3.5%) |
| $35,000 to $49,999 | 43 (18.4%) | 8 (2.8%) |
| $50,000 to $74,999 | 65 (27.8%) | 45 (15.7%) |
| $75,000 to $99,999 | 18 (7.7%) | 104 (36.2%) |
| $100,000 to $149,999 | 4 (1.7%) | 28 (9.8%) |
| $150,000 or more | 20 (8.6%) | 34 (11.8%) |
| Total | 234 (100.0%) | 287 (100.0%) |
Property Value to Household Income Ratio in Loris
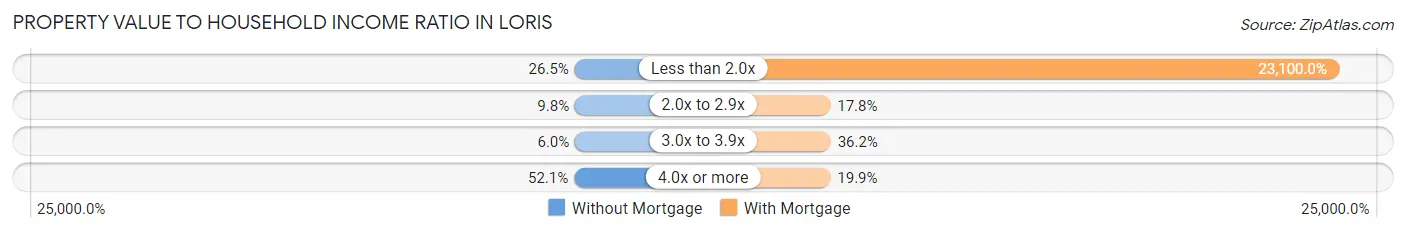
| Value-to-Income Ratio | Without Mortgage | With Mortgage |
| Less than 2.0x | 62 (26.5%) | 66,297 (23,100.0%) |
| 2.0x to 2.9x | 23 (9.8%) | 51 (17.8%) |
| 3.0x to 3.9x | 14 (6.0%) | 104 (36.2%) |
| 4.0x or more | 122 (52.1%) | 57 (19.9%) |
| Total | 234 (100.0%) | 287 (100.0%) |
Real Estate Taxes by Mortgage Status in Loris
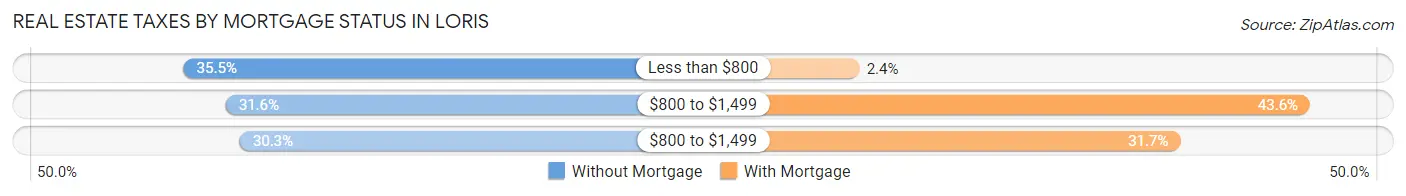
| Property Taxes | Without Mortgage | With Mortgage |
| Less than $800 | 83 (35.5%) | 7 (2.4%) |
| $800 to $1,499 | 74 (31.6%) | 125 (43.5%) |
| $800 to $1,499 | 71 (30.3%) | 91 (31.7%) |
| Total | 234 (100.0%) | 287 (100.0%) |
Health & Disability in Loris
Health Insurance Coverage by Age in Loris
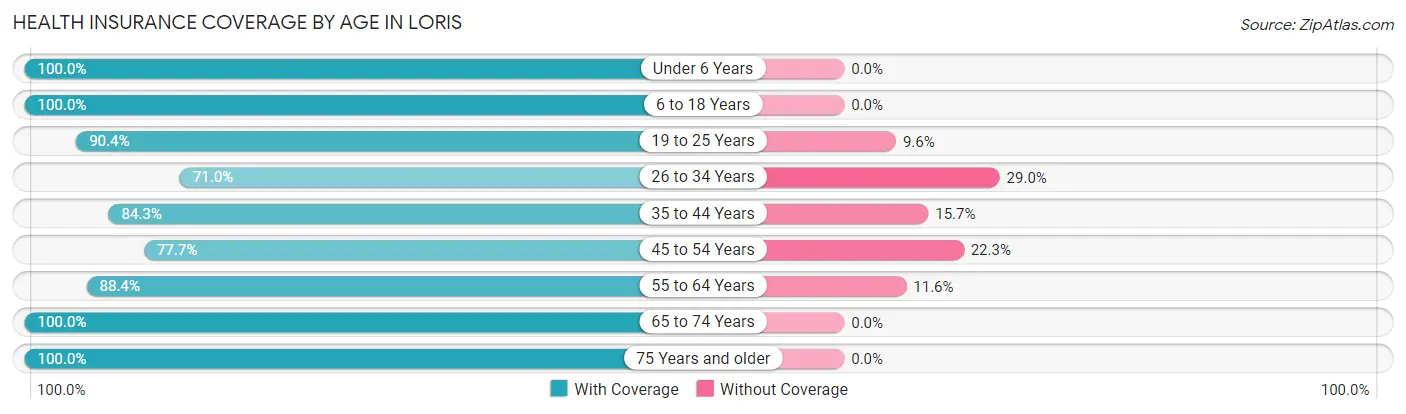
| Age Bracket | With Coverage | Without Coverage |
| Under 6 Years | 196 (100.0%) | 0 (0.0%) |
| 6 to 18 Years | 384 (100.0%) | 0 (0.0%) |
| 19 to 25 Years | 122 (90.4%) | 13 (9.6%) |
| 26 to 34 Years | 152 (71.0%) | 62 (29.0%) |
| 35 to 44 Years | 269 (84.3%) | 50 (15.7%) |
| 45 to 54 Years | 178 (77.7%) | 51 (22.3%) |
| 55 to 64 Years | 367 (88.4%) | 48 (11.6%) |
| 65 to 74 Years | 408 (100.0%) | 0 (0.0%) |
| 75 Years and older | 96 (100.0%) | 0 (0.0%) |
| Total | 2,172 (90.6%) | 224 (9.3%) |
Health Insurance Coverage by Citizenship Status in Loris
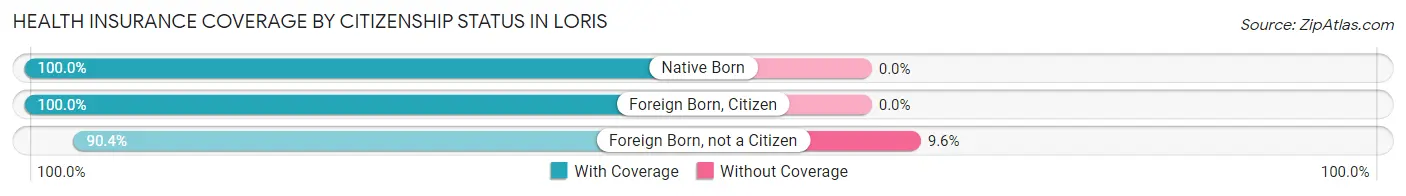
| Citizenship Status | With Coverage | Without Coverage |
| Native Born | 196 (100.0%) | 0 (0.0%) |
| Foreign Born, Citizen | 384 (100.0%) | 0 (0.0%) |
| Foreign Born, not a Citizen | 122 (90.4%) | 13 (9.6%) |
Health Insurance Coverage by Household Income in Loris
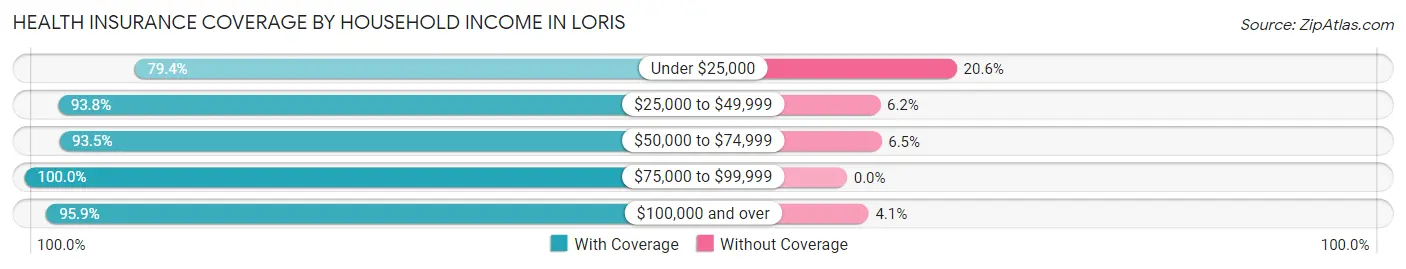
| Household Income | With Coverage | Without Coverage |
| Under $25,000 | 463 (79.4%) | 120 (20.6%) |
| $25,000 to $49,999 | 692 (93.8%) | 46 (6.2%) |
| $50,000 to $74,999 | 478 (93.5%) | 33 (6.5%) |
| $75,000 to $99,999 | 226 (100.0%) | 0 (0.0%) |
| $100,000 and over | 307 (95.9%) | 13 (4.1%) |
Public vs Private Health Insurance Coverage by Age in Loris
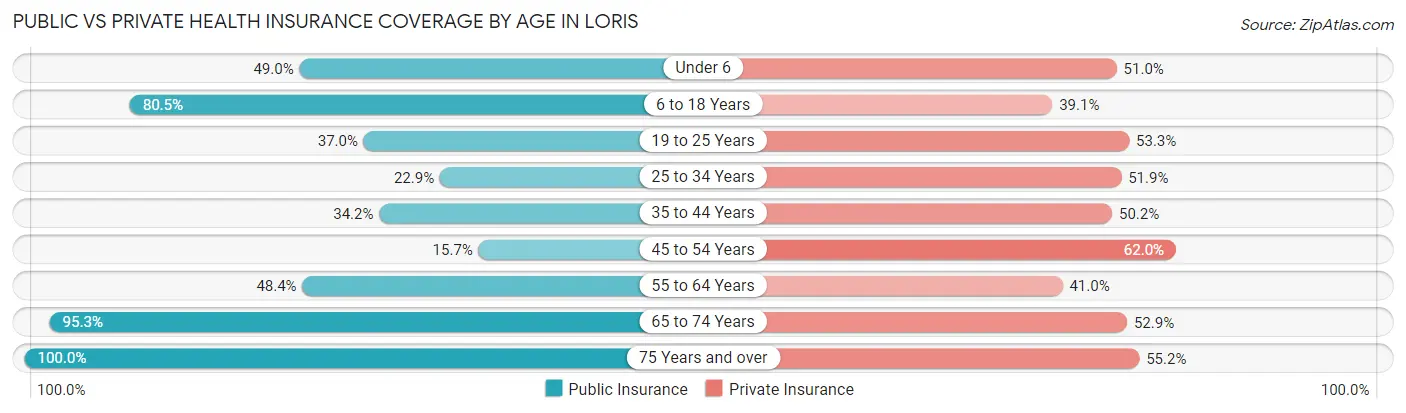
| Age Bracket | Public Insurance | Private Insurance |
| Under 6 | 96 (49.0%) | 100 (51.0%) |
| 6 to 18 Years | 309 (80.5%) | 150 (39.1%) |
| 19 to 25 Years | 50 (37.0%) | 72 (53.3%) |
| 25 to 34 Years | 49 (22.9%) | 111 (51.9%) |
| 35 to 44 Years | 109 (34.2%) | 160 (50.2%) |
| 45 to 54 Years | 36 (15.7%) | 142 (62.0%) |
| 55 to 64 Years | 201 (48.4%) | 170 (41.0%) |
| 65 to 74 Years | 389 (95.3%) | 216 (52.9%) |
| 75 Years and over | 96 (100.0%) | 53 (55.2%) |
| Total | 1,335 (55.7%) | 1,174 (49.0%) |
Disability Status by Sex by Age in Loris
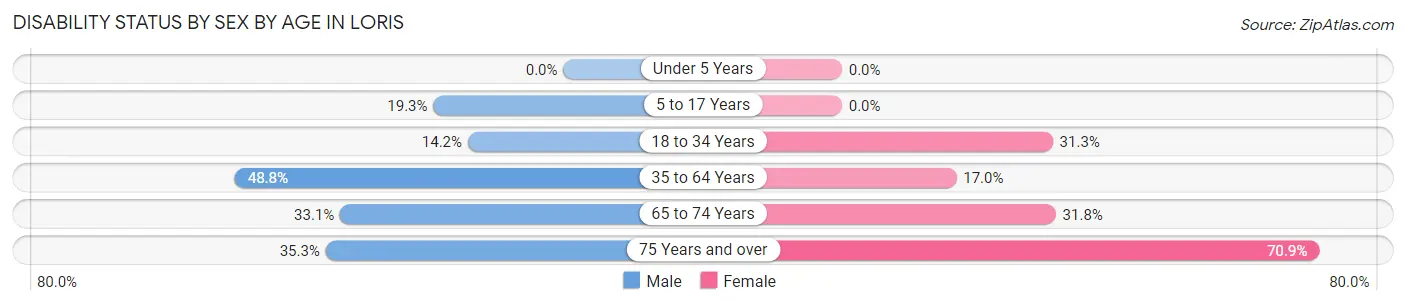
| Age Bracket | Male | Female |
| Under 5 Years | 0 (0.0%) | 0 (0.0%) |
| 5 to 17 Years | 33 (19.3%) | 0 (0.0%) |
| 18 to 34 Years | 20 (14.2%) | 67 (31.3%) |
| 35 to 64 Years | 180 (48.8%) | 101 (17.0%) |
| 65 to 74 Years | 58 (33.1%) | 74 (31.8%) |
| 75 Years and over | 6 (35.3%) | 56 (70.9%) |
Disability Class by Sex by Age in Loris
Disability Class: Hearing Difficulty
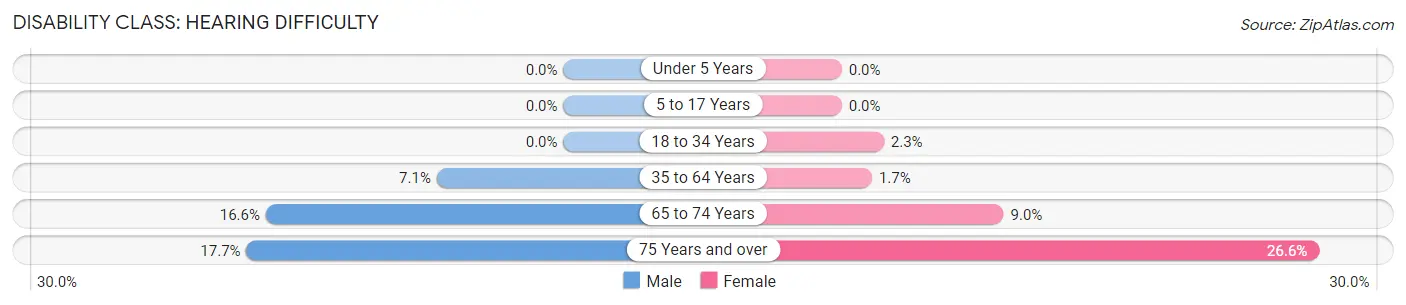
| Age Bracket | Male | Female |
| Under 5 Years | 0 (0.0%) | 0 (0.0%) |
| 5 to 17 Years | 0 (0.0%) | 0 (0.0%) |
| 18 to 34 Years | 0 (0.0%) | 5 (2.3%) |
| 35 to 64 Years | 26 (7.0%) | 10 (1.7%) |
| 65 to 74 Years | 29 (16.6%) | 21 (9.0%) |
| 75 Years and over | 3 (17.6%) | 21 (26.6%) |
Disability Class: Vision Difficulty
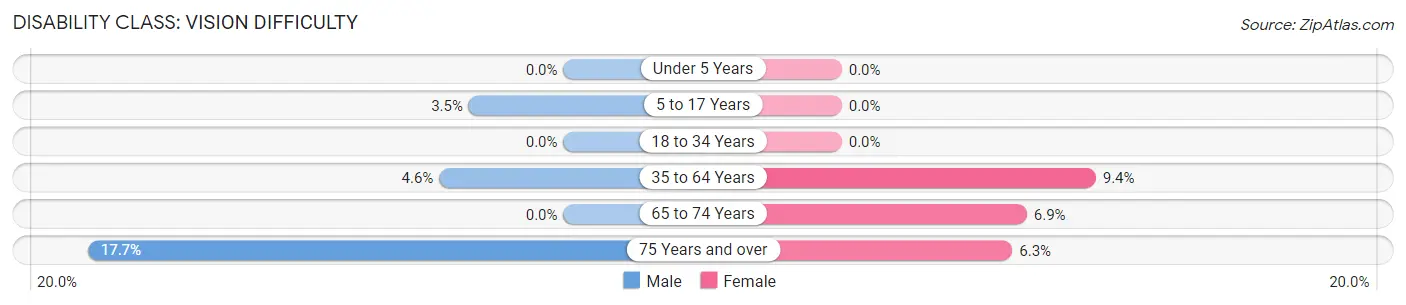
| Age Bracket | Male | Female |
| Under 5 Years | 0 (0.0%) | 0 (0.0%) |
| 5 to 17 Years | 6 (3.5%) | 0 (0.0%) |
| 18 to 34 Years | 0 (0.0%) | 0 (0.0%) |
| 35 to 64 Years | 17 (4.6%) | 56 (9.4%) |
| 65 to 74 Years | 0 (0.0%) | 16 (6.9%) |
| 75 Years and over | 3 (17.6%) | 5 (6.3%) |
Disability Class: Cognitive Difficulty
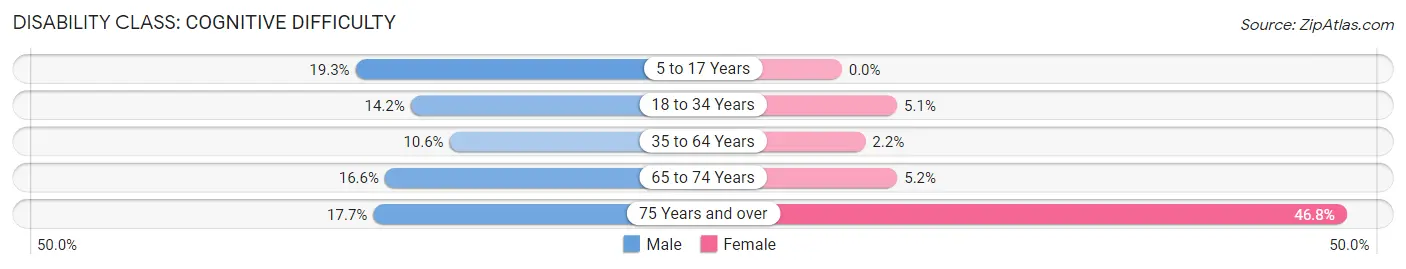
| Age Bracket | Male | Female |
| 5 to 17 Years | 33 (19.3%) | 0 (0.0%) |
| 18 to 34 Years | 20 (14.2%) | 11 (5.1%) |
| 35 to 64 Years | 39 (10.6%) | 13 (2.2%) |
| 65 to 74 Years | 29 (16.6%) | 12 (5.1%) |
| 75 Years and over | 3 (17.6%) | 37 (46.8%) |
Disability Class: Ambulatory Difficulty
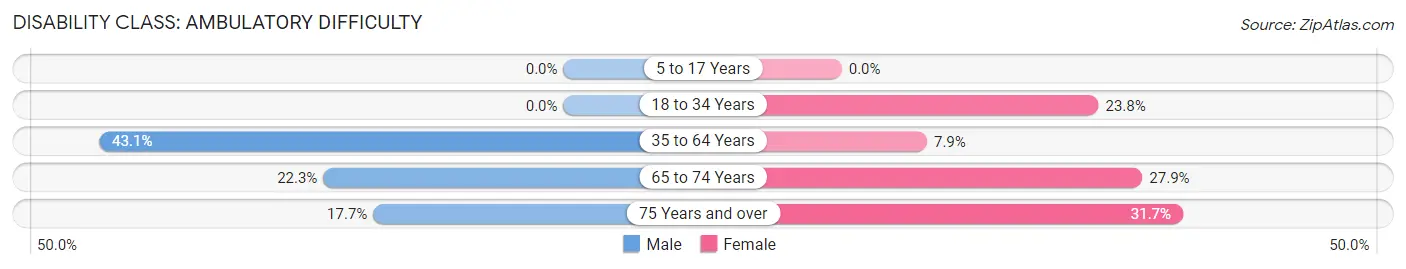
| Age Bracket | Male | Female |
| 5 to 17 Years | 0 (0.0%) | 0 (0.0%) |
| 18 to 34 Years | 0 (0.0%) | 51 (23.8%) |
| 35 to 64 Years | 159 (43.1%) | 47 (7.9%) |
| 65 to 74 Years | 39 (22.3%) | 65 (27.9%) |
| 75 Years and over | 3 (17.6%) | 25 (31.7%) |
Disability Class: Self-Care Difficulty
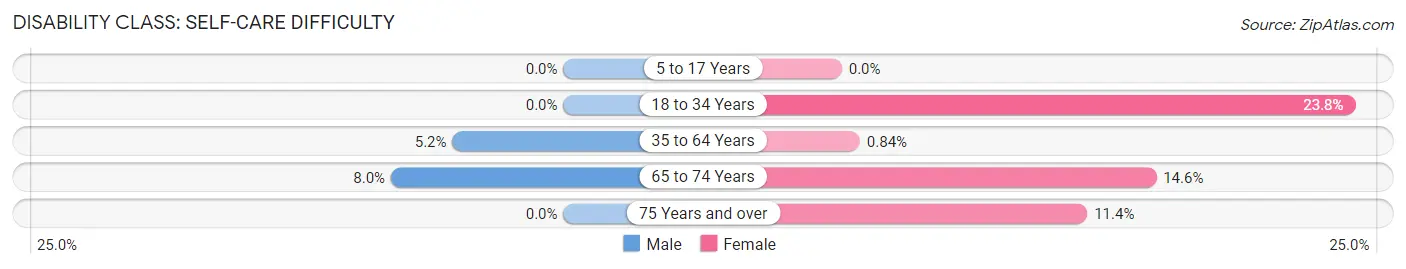
| Age Bracket | Male | Female |
| 5 to 17 Years | 0 (0.0%) | 0 (0.0%) |
| 18 to 34 Years | 0 (0.0%) | 51 (23.8%) |
| 35 to 64 Years | 19 (5.1%) | 5 (0.8%) |
| 65 to 74 Years | 14 (8.0%) | 34 (14.6%) |
| 75 Years and over | 0 (0.0%) | 9 (11.4%) |
Technology Access in Loris
Computing Device Access in Loris
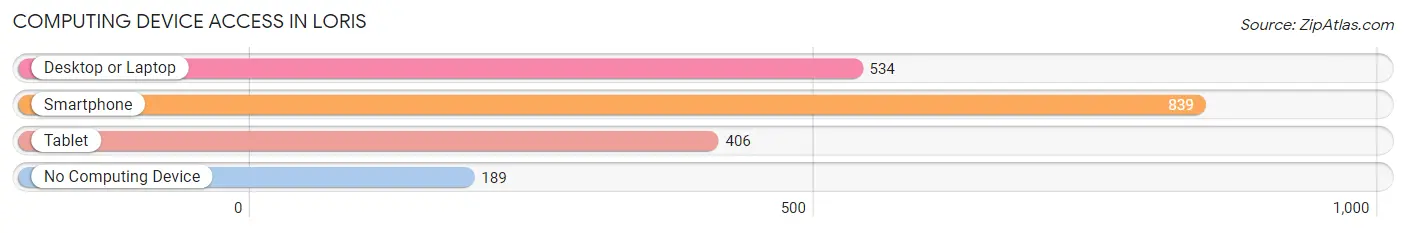
| Device Type | # Households | % Households |
| Desktop or Laptop | 534 | 49.4% |
| Smartphone | 839 | 77.7% |
| Tablet | 406 | 37.6% |
| No Computing Device | 189 | 17.5% |
| Total | 1,080 | 100.0% |
Internet Access in Loris
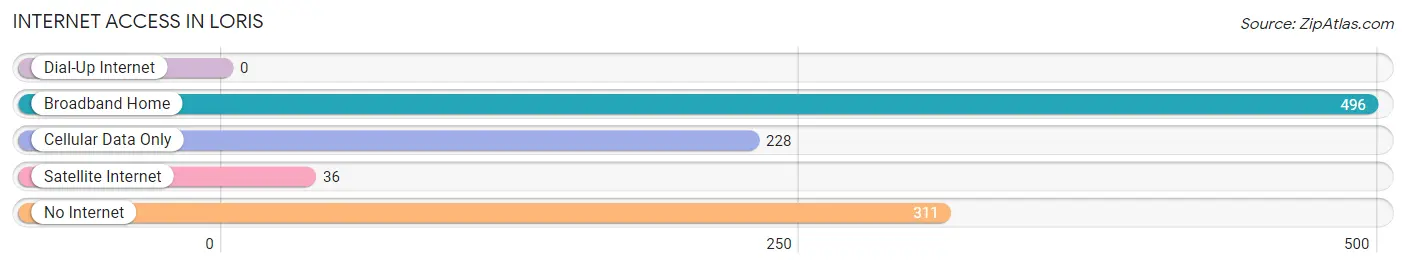
| Internet Type | # Households | % Households |
| Dial-Up Internet | 0 | 0.0% |
| Broadband Home | 496 | 45.9% |
| Cellular Data Only | 228 | 21.1% |
| Satellite Internet | 36 | 3.3% |
| No Internet | 311 | 28.8% |
| Total | 1,080 | 100.0% |
Loris Summary
Loris is a small town located in Horry County, South Carolina. It is situated in the northeastern part of the state, approximately 25 miles from the Atlantic Ocean. The town is part of the Myrtle Beach metropolitan area and is home to a population of approximately 2,500 people.
Geography
Loris is located in the northeastern part of South Carolina, approximately 25 miles from the Atlantic Ocean. The town is situated in the Waccamaw Neck region of the state, which is characterized by its flat terrain and sandy soil. The town is bordered by the Waccamaw River to the north and the Little Pee Dee River to the south. The town is located in the Pee Dee region of the state, which is known for its agricultural production.
The climate in Loris is humid subtropical, with hot, humid summers and mild winters. The average annual temperature is around 70 degrees Fahrenheit, with an average high of around 90 degrees in the summer and an average low of around 50 degrees in the winter. The town receives an average of 48 inches of precipitation per year, with most of it falling in the summer months.
Economy
The economy of Loris is largely based on agriculture and tourism. The town is home to several farms that produce a variety of crops, including corn, soybeans, cotton, and peanuts. The town is also home to several seafood processing plants, which process and package seafood for distribution throughout the region.
The town is also a popular tourist destination, with many visitors coming to the area to enjoy the beaches, fishing, and other outdoor activities. The town is home to several restaurants, hotels, and other businesses that cater to tourists.
Demographics
As of the 2010 census, the population of Loris was 2,500. The racial makeup of the town was 79.2% White, 17.2% African American, 0.8% Native American, 0.4% Asian, 0.2% Pacific Islander, and 2.4% from other races. The median household income was $31,250, and the median family income was $37,500.
Conclusion
Loris is a small town located in Horry County, South Carolina. It is situated in the northeastern part of the state, approximately 25 miles from the Atlantic Ocean. The town is part of the Myrtle Beach metropolitan area and is home to a population of approximately 2,500 people. The economy of Loris is largely based on agriculture and tourism, and the town is home to several farms and seafood processing plants. The racial makeup of the town is 79.2% White, 17.2% African American, 0.8% Native American, 0.4% Asian, 0.2% Pacific Islander, and 2.4% from other races. The median household income was $31,250, and the median family income was $37,500.
Common Questions
What is Per Capita Income in Loris?
Per Capita income in Loris is $25,853.
What is the Median Family Income in Loris?
Median Family Income in Loris is $41,500.
What is the Median Household income in Loris?
Median Household Income in Loris is $34,564.
What is Income or Wage Gap in Loris?
Income or Wage Gap in Loris is 2.4%.
Women in Loris earn 97.6 cents for every dollar earned by a man.
What is Family Income Deficit in Loris?
Family Income Deficit in Loris is $9,814.
Families that are below poverty line in Loris earn $9,814 less on average than the poverty threshold level.
What is Inequality or Gini Index in Loris?
Inequality or Gini Index in Loris is 0.52.
What is the Total Population of Loris?
Total Population of Loris is 2,513.
What is the Total Male Population of Loris?
Total Male Population of Loris is 1,037.
What is the Total Female Population of Loris?
Total Female Population of Loris is 1,476.
What is the Ratio of Males per 100 Females in Loris?
There are 70.26 Males per 100 Females in Loris.
What is the Ratio of Females per 100 Males in Loris?
There are 142.33 Females per 100 Males in Loris.
What is the Median Population Age in Loris?
Median Population Age in Loris is 44.4 Years.
What is the Average Family Size in Loris
Average Family Size in Loris is 3.1 People.
What is the Average Household Size in Loris
Average Household Size in Loris is 2.2 People.
How Large is the Labor Force in Loris?
There are 974 People in the Labor Forcein in Loris.
What is the Percentage of People in the Labor Force in Loris?
49.2% of People are in the Labor Force in Loris.
What is the Unemployment Rate in Loris?
Unemployment Rate in Loris is 8.4%.