Hartsville, SC Map & Demographics
Hartsville Map
Hartsville Overview
$25,911
PER CAPITA INCOME
$58,542
AVG FAMILY INCOME
$46,230
AVG HOUSEHOLD INCOME
27.3%
WAGE / INCOME GAP [ % ]
72.7¢/ $1
WAGE / INCOME GAP [ $ ]
0.51
INEQUALITY / GINI INDEX
7,450
TOTAL POPULATION
3,475
MALE POPULATION
3,975
FEMALE POPULATION
87.42
MALES / 100 FEMALES
114.39
FEMALES / 100 MALES
29.8
MEDIAN AGE
3.2
AVG FAMILY SIZE
2.5
AVG HOUSEHOLD SIZE
3,118
LABOR FORCE [ PEOPLE ]
58.6%
PERCENT IN LABOR FORCE
9.2%
UNEMPLOYMENT RATE
Hartsville Zip Codes
Hartsville Area Codes
Income in Hartsville
Income Overview in Hartsville
Per Capita Income in Hartsville is $25,911, while median incomes of families and households are $58,542 and $46,230 respectively.
| Characteristic | Number | Measure |
| Per Capita Income | 7,450 | $25,911 |
| Median Family Income | 1,692 | $58,542 |
| Mean Family Income | 1,692 | $84,558 |
| Median Household Income | 2,756 | $46,230 |
| Mean Household Income | 2,756 | $68,625 |
| Income Deficit | 1,692 | $0 |
| Wage / Income Gap (%) | 7,450 | 27.33% |
| Wage / Income Gap ($) | 7,450 | 72.67¢ per $1 |
| Gini / Inequality Index | 7,450 | 0.51 |
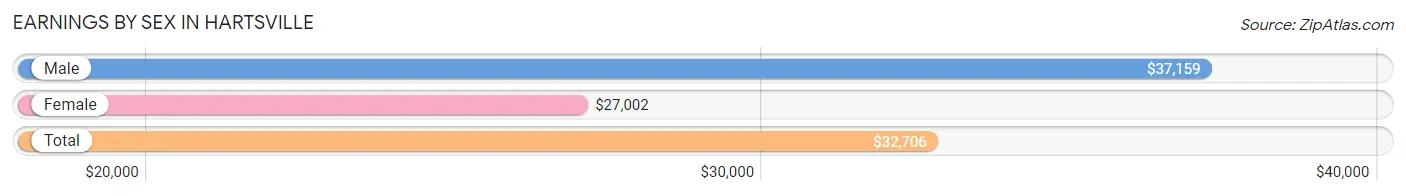
Earnings by Sex in Hartsville
Average Earnings in Hartsville are $32,706, $37,159 for men and $27,002 for women, a difference of 27.3%.
| Sex | Number | Average Earnings |
| Male | 1,347 (41.0%) | $37,159 |
| Female | 1,935 (59.0%) | $27,002 |
| Total | 3,282 (100.0%) | $32,706 |
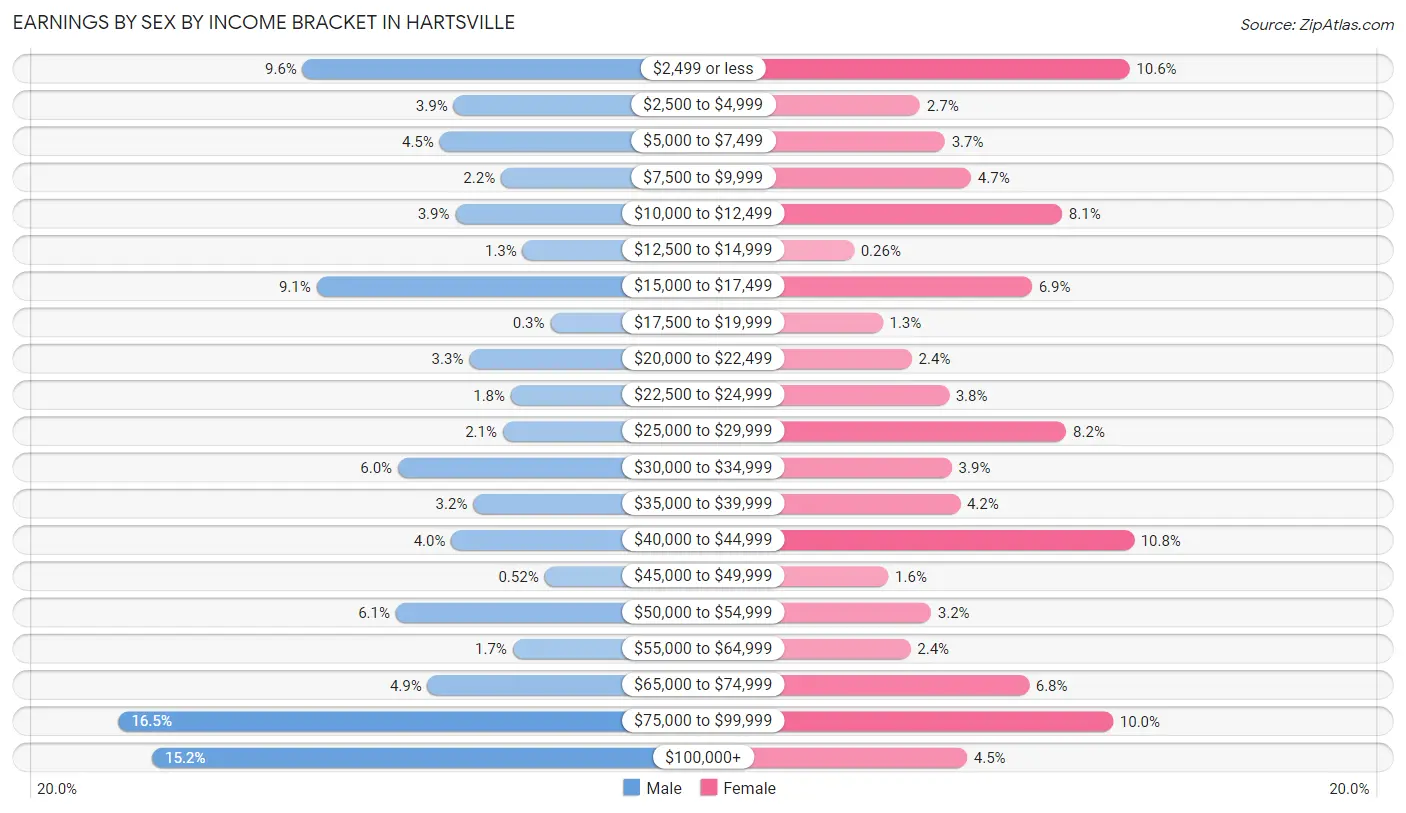
Earnings by Sex by Income Bracket in Hartsville
The most common earnings brackets in Hartsville are $75,000 to $99,999 for men (222 | 16.5%) and $40,000 to $44,999 for women (208 | 10.7%).
| Income | Male | Female |
| $2,499 or less | 129 (9.6%) | 205 (10.6%) |
| $2,500 to $4,999 | 53 (3.9%) | 53 (2.7%) |
| $5,000 to $7,499 | 60 (4.4%) | 71 (3.7%) |
| $7,500 to $9,999 | 29 (2.1%) | 90 (4.6%) |
| $10,000 to $12,499 | 52 (3.9%) | 156 (8.1%) |
| $12,500 to $14,999 | 18 (1.3%) | 5 (0.3%) |
| $15,000 to $17,499 | 122 (9.1%) | 134 (6.9%) |
| $17,500 to $19,999 | 4 (0.3%) | 26 (1.3%) |
| $20,000 to $22,499 | 45 (3.3%) | 47 (2.4%) |
| $22,500 to $24,999 | 24 (1.8%) | 74 (3.8%) |
| $25,000 to $29,999 | 28 (2.1%) | 159 (8.2%) |
| $30,000 to $34,999 | 81 (6.0%) | 76 (3.9%) |
| $35,000 to $39,999 | 43 (3.2%) | 82 (4.2%) |
| $40,000 to $44,999 | 54 (4.0%) | 208 (10.7%) |
| $45,000 to $49,999 | 7 (0.5%) | 30 (1.5%) |
| $50,000 to $54,999 | 82 (6.1%) | 61 (3.2%) |
| $55,000 to $64,999 | 23 (1.7%) | 46 (2.4%) |
| $65,000 to $74,999 | 66 (4.9%) | 132 (6.8%) |
| $75,000 to $99,999 | 222 (16.5%) | 193 (10.0%) |
| $100,000+ | 205 (15.2%) | 87 (4.5%) |
| Total | 1,347 (100.0%) | 1,935 (100.0%) |
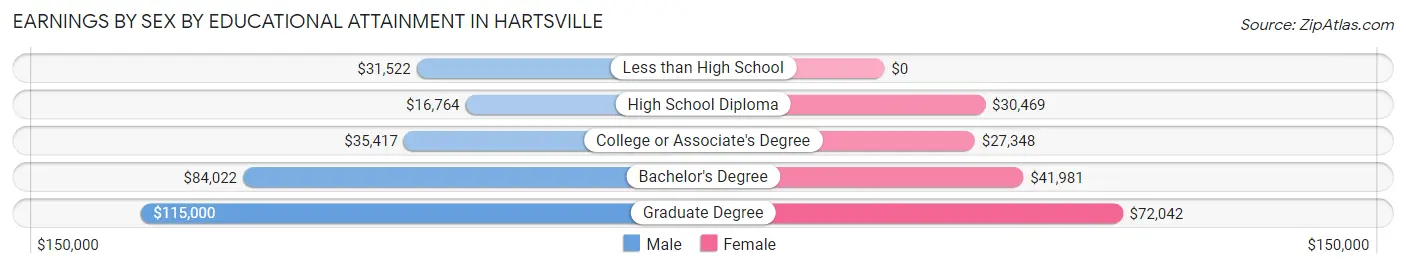
Earnings by Sex by Educational Attainment in Hartsville
Average earnings in Hartsville are $45,000 for men and $40,470 for women, a difference of 10.1%. Men with an educational attainment of graduate degree enjoy the highest average annual earnings of $115,000, while those with high school diploma education earn the least with $16,764. Women with an educational attainment of graduate degree earn the most with the average annual earnings of $72,042, while those with college or associate's degree education have the smallest earnings of $27,348.
| Educational Attainment | Male Income | Female Income |
| Less than High School | $31,522 | $0 |
| High School Diploma | $16,764 | $30,469 |
| College or Associate's Degree | $35,417 | $27,348 |
| Bachelor's Degree | $84,022 | $41,981 |
| Graduate Degree | $115,000 | $72,042 |
| Total | $45,000 | $40,470 |
Family Income in Hartsville
Family Income Brackets in Hartsville
According to the Hartsville family income data, there are 306 families falling into the $35,000 to $49,999 income range, which is the most common income bracket and makes up 18.1% of all families. Conversely, the $10,000 to $14,999 income bracket is the least frequent group with only 29 families (1.7%) belonging to this category.
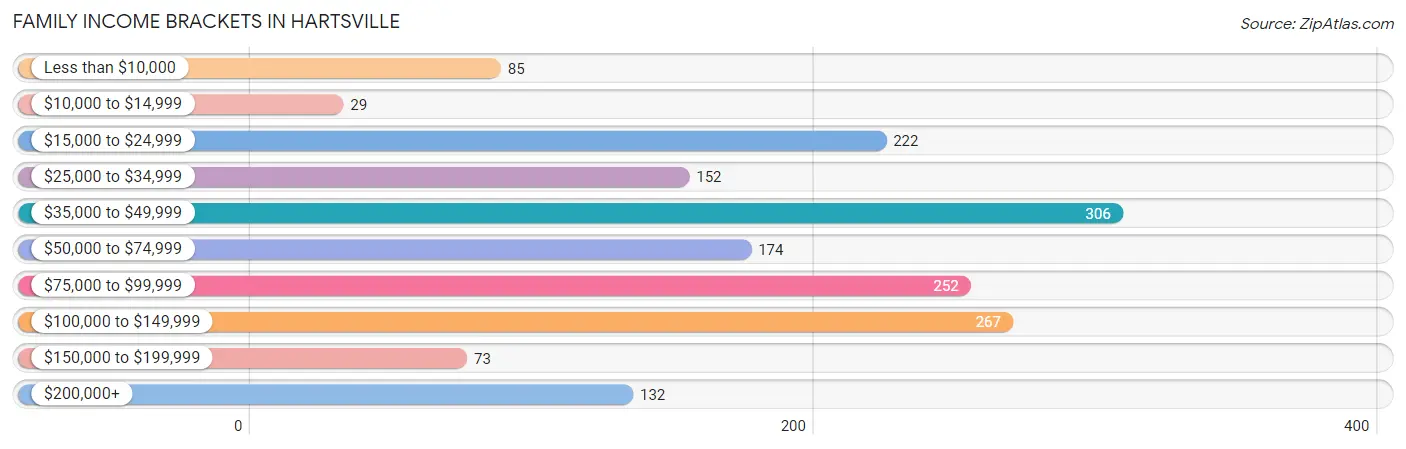
| Income Bracket | # Families | % Families |
| Less than $10,000 | 85 | 5.0% |
| $10,000 to $14,999 | 29 | 1.7% |
| $15,000 to $24,999 | 222 | 13.1% |
| $25,000 to $34,999 | 152 | 9.0% |
| $35,000 to $49,999 | 306 | 18.1% |
| $50,000 to $74,999 | 174 | 10.3% |
| $75,000 to $99,999 | 252 | 14.9% |
| $100,000 to $149,999 | 267 | 15.8% |
| $150,000 to $199,999 | 73 | 4.3% |
| $200,000+ | 132 | 7.8% |
Family Income by Famaliy Size in Hartsville
3-person families (441 | 26.1%) account for the highest median family income in Hartsville with $92,240 per family, while 3-person families (441 | 26.1%) have the highest median income of $30,747 per family member.
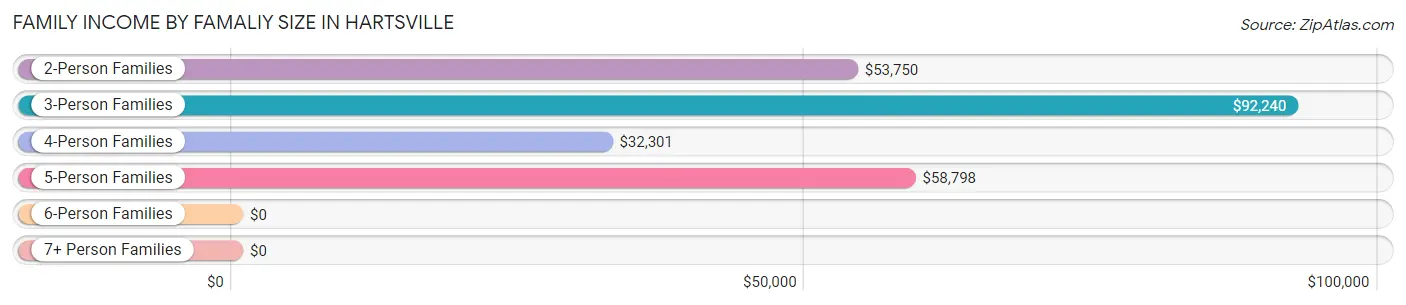
| Income Bracket | # Families | Median Income |
| 2-Person Families | 701 (41.4%) | $53,750 |
| 3-Person Families | 441 (26.1%) | $92,240 |
| 4-Person Families | 381 (22.5%) | $32,301 |
| 5-Person Families | 51 (3.0%) | $58,798 |
| 6-Person Families | 43 (2.5%) | $0 |
| 7+ Person Families | 75 (4.4%) | $0 |
| Total | 1,692 (100.0%) | $58,542 |
Family Income by Number of Earners in Hartsville
The median family income in Hartsville is $58,542, with families comprising 3+ earners (49) having the highest median family income of $147,009, while families with no earners (326) have the lowest median family income of $46,343, accounting for 2.9% and 19.3% of families, respectively.
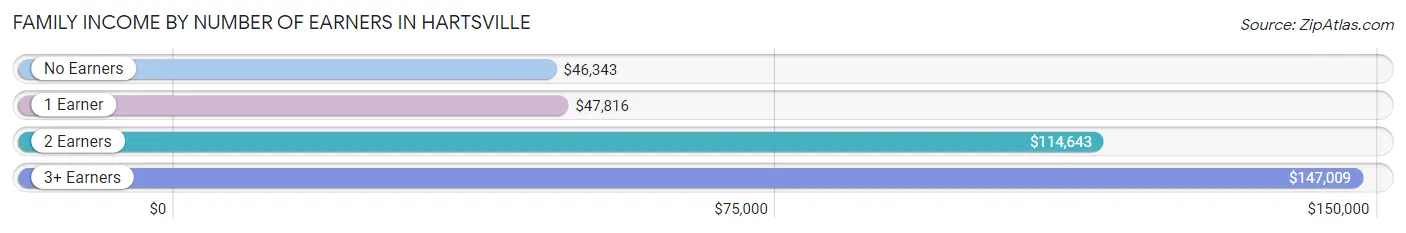
| Number of Earners | # Families | Median Income |
| No Earners | 326 (19.3%) | $46,343 |
| 1 Earner | 707 (41.8%) | $47,816 |
| 2 Earners | 610 (36.0%) | $114,643 |
| 3+ Earners | 49 (2.9%) | $147,009 |
| Total | 1,692 (100.0%) | $58,542 |
Household Income in Hartsville
Household Income Brackets in Hartsville
With 446 households falling in the category, the $35,000 to $49,999 income range is the most frequent in Hartsville, accounting for 16.2% of all households. In contrast, only 83 households (3.0%) fall into the $150,000 to $199,999 income bracket, making it the least populous group.
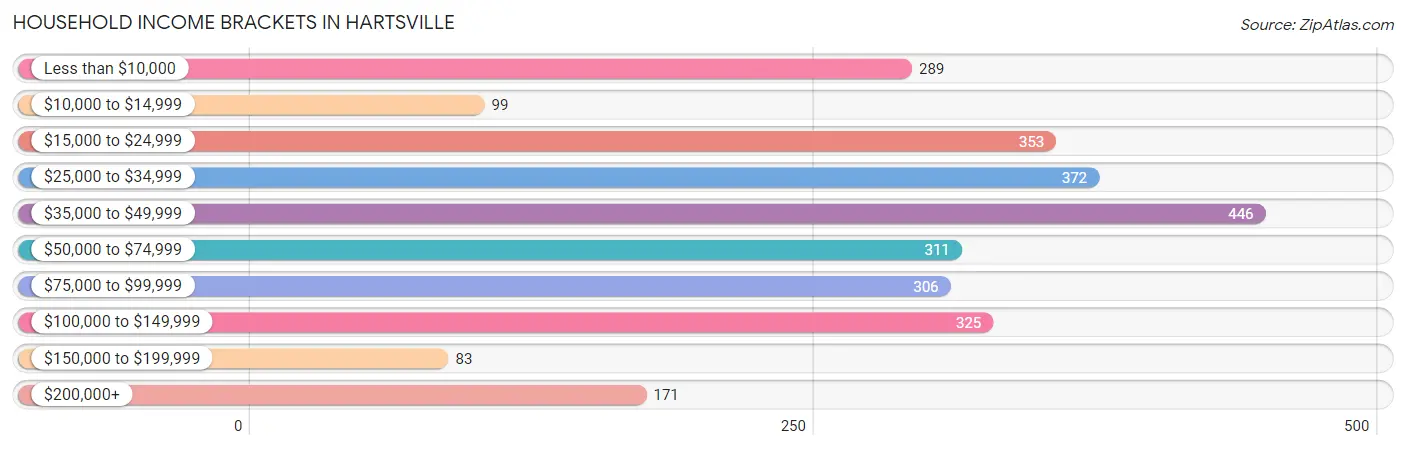
| Income Bracket | # Households | % Households |
| Less than $10,000 | 289 | 10.5% |
| $10,000 to $14,999 | 99 | 3.6% |
| $15,000 to $24,999 | 353 | 12.8% |
| $25,000 to $34,999 | 372 | 13.5% |
| $35,000 to $49,999 | 446 | 16.2% |
| $50,000 to $74,999 | 311 | 11.3% |
| $75,000 to $99,999 | 306 | 11.1% |
| $100,000 to $149,999 | 325 | 11.8% |
| $150,000 to $199,999 | 83 | 3.0% |
| $200,000+ | 171 | 6.2% |
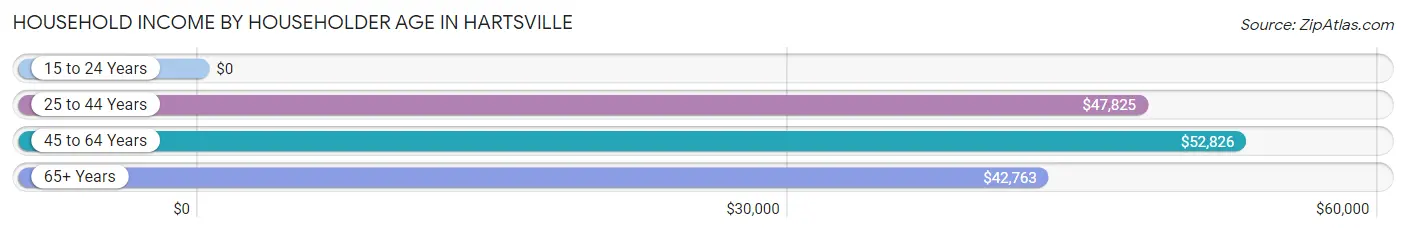
Household Income by Householder Age in Hartsville
The median household income in Hartsville is $46,230, with the highest median household income of $52,826 found in the 45 to 64 years age bracket for the primary householder. A total of 998 households (36.2%) fall into this category. Meanwhile, the 15 to 24 years age bracket for the primary householder has the lowest median household income of $0, with 114 households (4.1%) in this group.
| Income Bracket | # Households | Median Income |
| 15 to 24 Years | 114 (4.1%) | $0 |
| 25 to 44 Years | 918 (33.3%) | $47,825 |
| 45 to 64 Years | 998 (36.2%) | $52,826 |
| 65+ Years | 726 (26.3%) | $42,763 |
| Total | 2,756 (100.0%) | $46,230 |
Poverty in Hartsville
Income Below Poverty by Sex and Age in Hartsville
With 28.6% poverty level for males and 25.2% for females among the residents of Hartsville, 5 year old males and 5 year old females are the most vulnerable to poverty, with 20 males (83.3%) and 44 females (81.5%) in their respective age groups living below the poverty level.

| Age Bracket | Male | Female |
| Under 5 Years | 205 (63.5%) | 28 (11.2%) |
| 5 Years | 20 (83.3%) | 44 (81.5%) |
| 6 to 11 Years | 111 (20.3%) | 135 (33.2%) |
| 12 to 14 Years | 152 (54.3%) | 28 (23.5%) |
| 15 Years | 0 (0.0%) | 10 (14.7%) |
| 16 and 17 Years | 11 (25.6%) | 86 (72.3%) |
| 18 to 24 Years | 40 (32.8%) | 240 (62.8%) |
| 25 to 34 Years | 65 (15.4%) | 122 (31.5%) |
| 35 to 44 Years | 42 (16.9%) | 68 (14.1%) |
| 45 to 54 Years | 13 (3.5%) | 18 (4.2%) |
| 55 to 64 Years | 112 (30.1%) | 25 (6.0%) |
| 65 to 74 Years | 150 (42.1%) | 18 (7.0%) |
| 75 Years and over | 20 (15.1%) | 98 (34.6%) |
| Total | 941 (28.6%) | 920 (25.2%) |
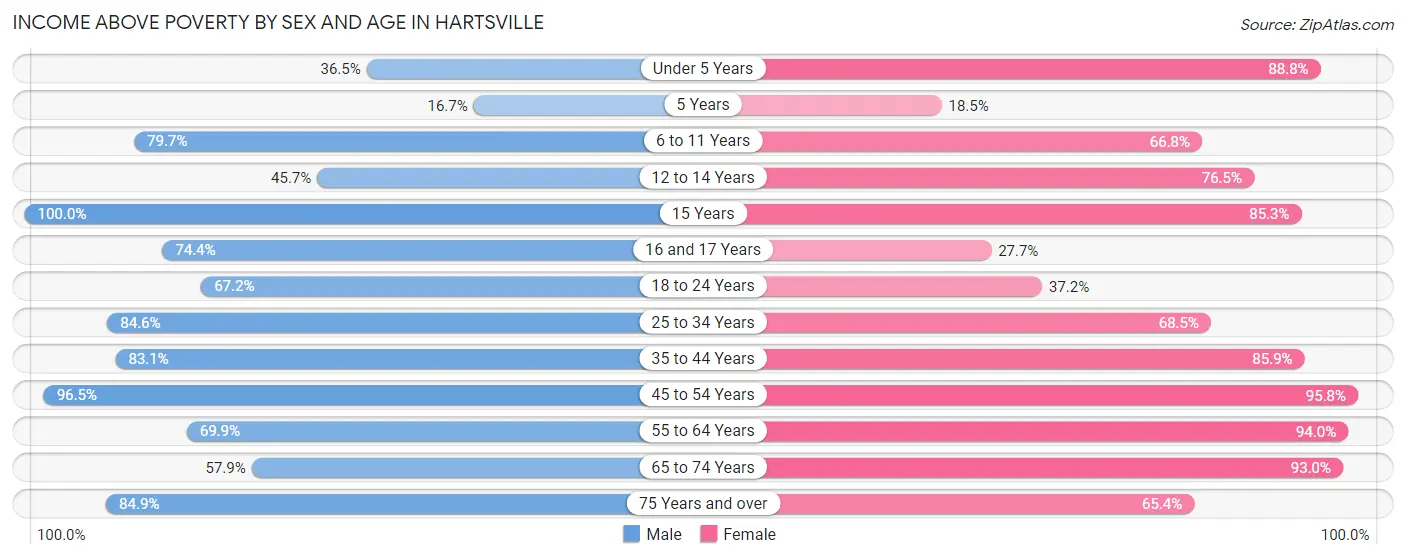
Income Above Poverty by Sex and Age in Hartsville
According to the poverty statistics in Hartsville, males aged 15 years and females aged 45 to 54 years are the age groups that are most secure financially, with 100.0% of males and 95.8% of females in these age groups living above the poverty line.
| Age Bracket | Male | Female |
| Under 5 Years | 118 (36.5%) | 223 (88.8%) |
| 5 Years | 4 (16.7%) | 10 (18.5%) |
| 6 to 11 Years | 435 (79.7%) | 272 (66.8%) |
| 12 to 14 Years | 128 (45.7%) | 91 (76.5%) |
| 15 Years | 57 (100.0%) | 58 (85.3%) |
| 16 and 17 Years | 32 (74.4%) | 33 (27.7%) |
| 18 to 24 Years | 82 (67.2%) | 142 (37.2%) |
| 25 to 34 Years | 358 (84.6%) | 265 (68.5%) |
| 35 to 44 Years | 207 (83.1%) | 413 (85.9%) |
| 45 to 54 Years | 353 (96.5%) | 409 (95.8%) |
| 55 to 64 Years | 260 (69.9%) | 389 (94.0%) |
| 65 to 74 Years | 206 (57.9%) | 239 (93.0%) |
| 75 Years and over | 112 (84.9%) | 185 (65.4%) |
| Total | 2,352 (71.4%) | 2,729 (74.8%) |
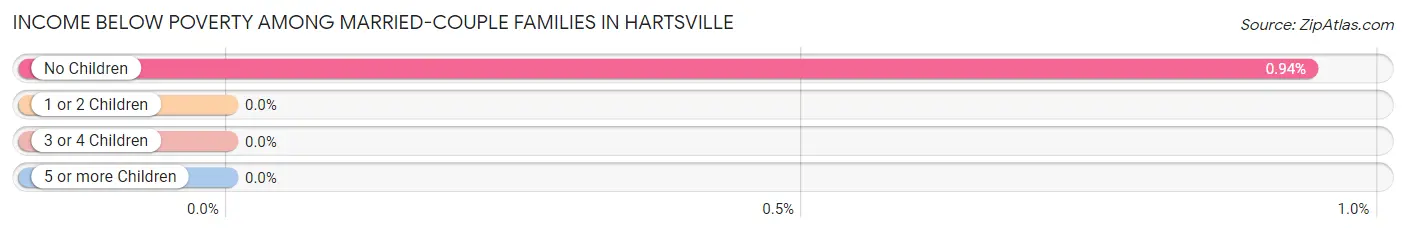
Income Below Poverty Among Married-Couple Families in Hartsville
The poverty statistics for married-couple families in Hartsville show that 0.6% or 5 of the total 889 families live below the poverty line. Families with no children have the highest poverty rate of 0.9%, comprising of 5 families. On the other hand, families with 1 or 2 children have the lowest poverty rate of 0.0%, which includes 0 families.
| Children | Above Poverty | Below Poverty |
| No Children | 526 (99.1%) | 5 (0.9%) |
| 1 or 2 Children | 265 (100.0%) | 0 (0.0%) |
| 3 or 4 Children | 18 (100.0%) | 0 (0.0%) |
| 5 or more Children | 75 (100.0%) | 0 (0.0%) |
| Total | 884 (99.4%) | 5 (0.6%) |
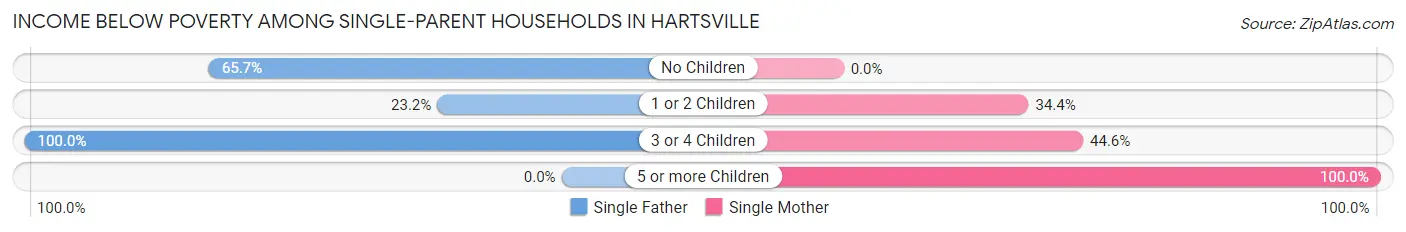
Income Below Poverty Among Single-Parent Households in Hartsville
According to the poverty data in Hartsville, 49.5% or 94 single-father households and 33.8% or 207 single-mother households are living below the poverty line. Among single-father households, those with 3 or 4 children have the highest poverty rate, with 28 households (100.0%) experiencing poverty. Likewise, among single-mother households, those with 5 or more children have the highest poverty rate, with 29 households (100.0%) falling below the poverty line.
| Children | Single Father | Single Mother |
| No Children | 44 (65.7%) | 0 (0.0%) |
| 1 or 2 Children | 22 (23.2%) | 83 (34.4%) |
| 3 or 4 Children | 28 (100.0%) | 95 (44.6%) |
| 5 or more Children | 0 (0.0%) | 29 (100.0%) |
| Total | 94 (49.5%) | 207 (33.8%) |
Income Below Poverty Among Married-Couple vs Single-Parent Households in Hartsville
The poverty data for Hartsville shows that 5 of the married-couple family households (0.6%) and 301 of the single-parent households (37.5%) are living below the poverty level. Within the married-couple family households, those with no children have the highest poverty rate, with 5 households (0.9%) falling below the poverty line. Among the single-parent households, those with 5 or more children have the highest poverty rate, with 29 household (100.0%) living below poverty.
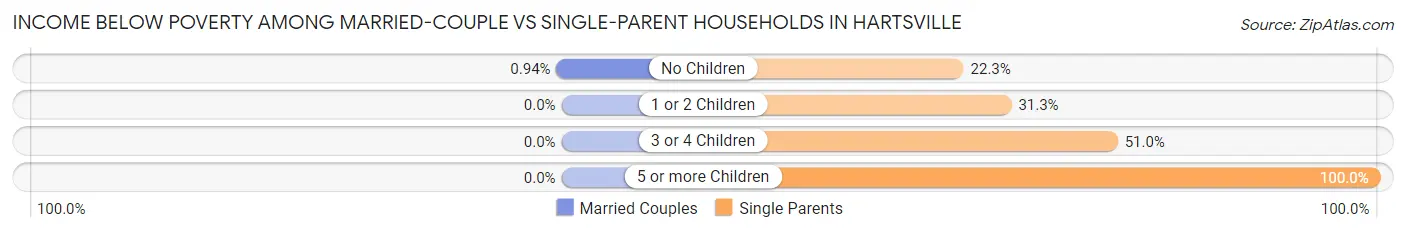
| Children | Married-Couple Families | Single-Parent Households |
| No Children | 5 (0.9%) | 44 (22.3%) |
| 1 or 2 Children | 0 (0.0%) | 105 (31.2%) |
| 3 or 4 Children | 0 (0.0%) | 123 (51.0%) |
| 5 or more Children | 0 (0.0%) | 29 (100.0%) |
| Total | 5 (0.6%) | 301 (37.5%) |
Race in Hartsville
The most populous races in Hartsville are Black / African American (3,619 | 48.6%), White / Caucasian (3,580 | 48.0%), and Asian (141 | 1.9%).
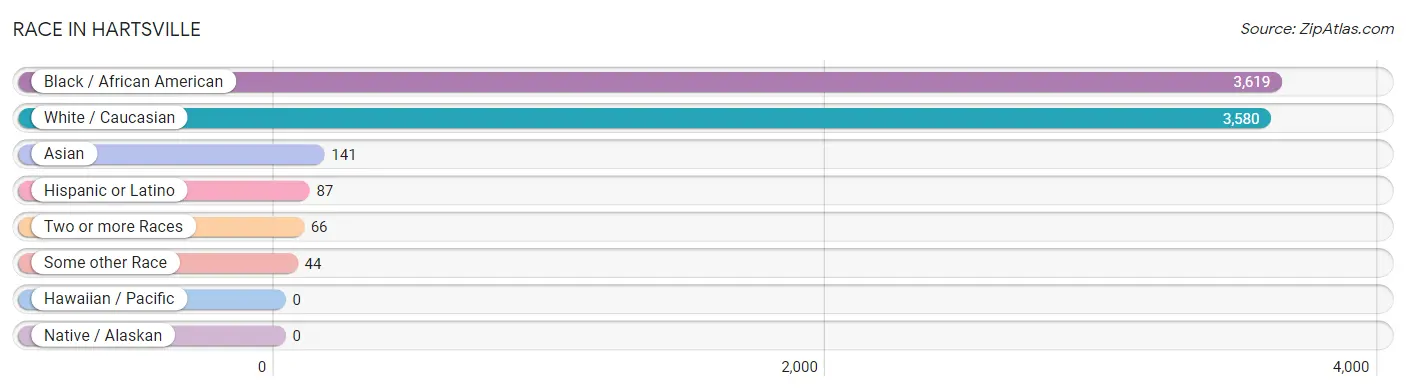
| Race | # Population | % Population |
| Asian | 141 | 1.9% |
| Black / African American | 3,619 | 48.6% |
| Hawaiian / Pacific | 0 | 0.0% |
| Hispanic or Latino | 87 | 1.2% |
| Native / Alaskan | 0 | 0.0% |
| White / Caucasian | 3,580 | 48.0% |
| Two or more Races | 66 | 0.9% |
| Some other Race | 44 | 0.6% |
| Total | 7,450 | 100.0% |
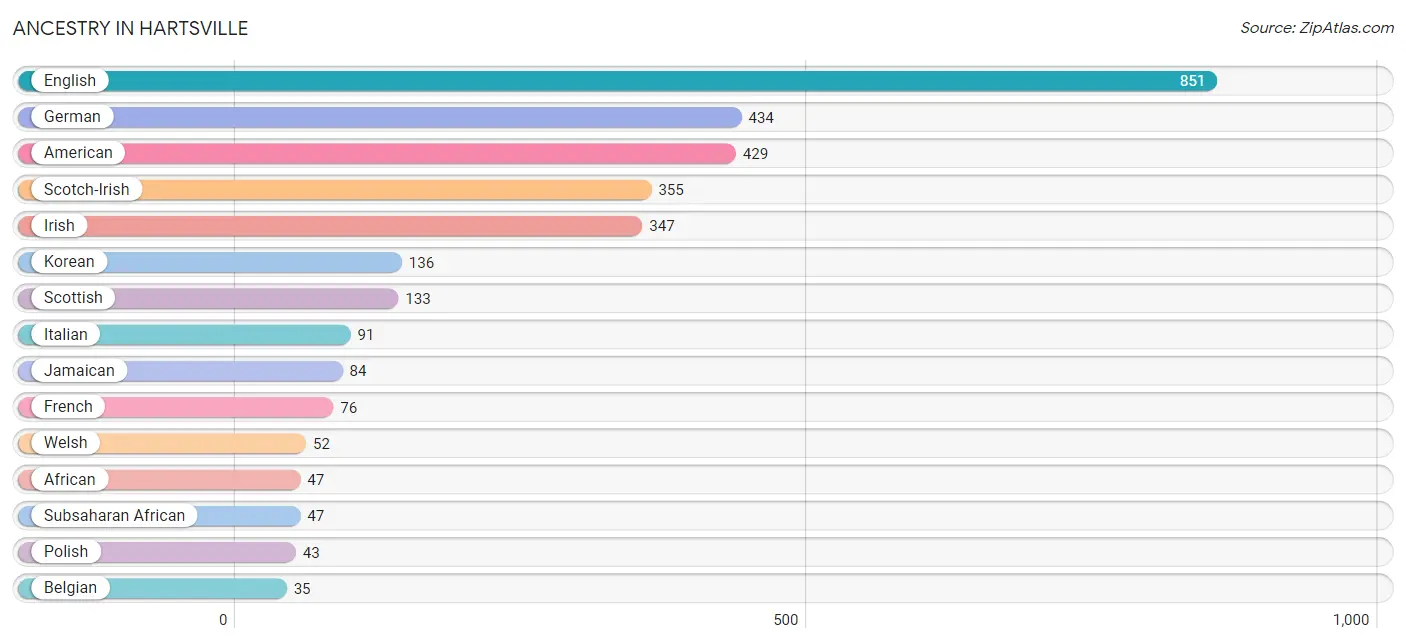
Ancestry in Hartsville
The most populous ancestries reported in Hartsville are English (851 | 11.4%), German (434 | 5.8%), American (429 | 5.8%), Scotch-Irish (355 | 4.8%), and Irish (347 | 4.7%), together accounting for 32.4% of all Hartsville residents.
| Ancestry | # Population | % Population |
| African | 47 | 0.6% |
| American | 429 | 5.8% |
| Arab | 16 | 0.2% |
| Belgian | 35 | 0.5% |
| Burmese | 5 | 0.1% |
| Canadian | 3 | 0.0% |
| Cherokee | 18 | 0.2% |
| Dutch | 30 | 0.4% |
| English | 851 | 11.4% |
| European | 6 | 0.1% |
| French | 76 | 1.0% |
| German | 434 | 5.8% |
| Greek | 15 | 0.2% |
| Irish | 347 | 4.7% |
| Italian | 91 | 1.2% |
| Jamaican | 84 | 1.1% |
| Korean | 136 | 1.8% |
| Lebanese | 16 | 0.2% |
| Mexican | 11 | 0.2% |
| Mongolian | 16 | 0.2% |
| Norwegian | 2 | 0.0% |
| Polish | 43 | 0.6% |
| Puerto Rican | 21 | 0.3% |
| Scotch-Irish | 355 | 4.8% |
| Scottish | 133 | 1.8% |
| Spaniard | 11 | 0.2% |
| Subsaharan African | 47 | 0.6% |
| Swiss | 10 | 0.1% |
| Ukrainian | 7 | 0.1% |
| Welsh | 52 | 0.7% | View All 30 Rows |
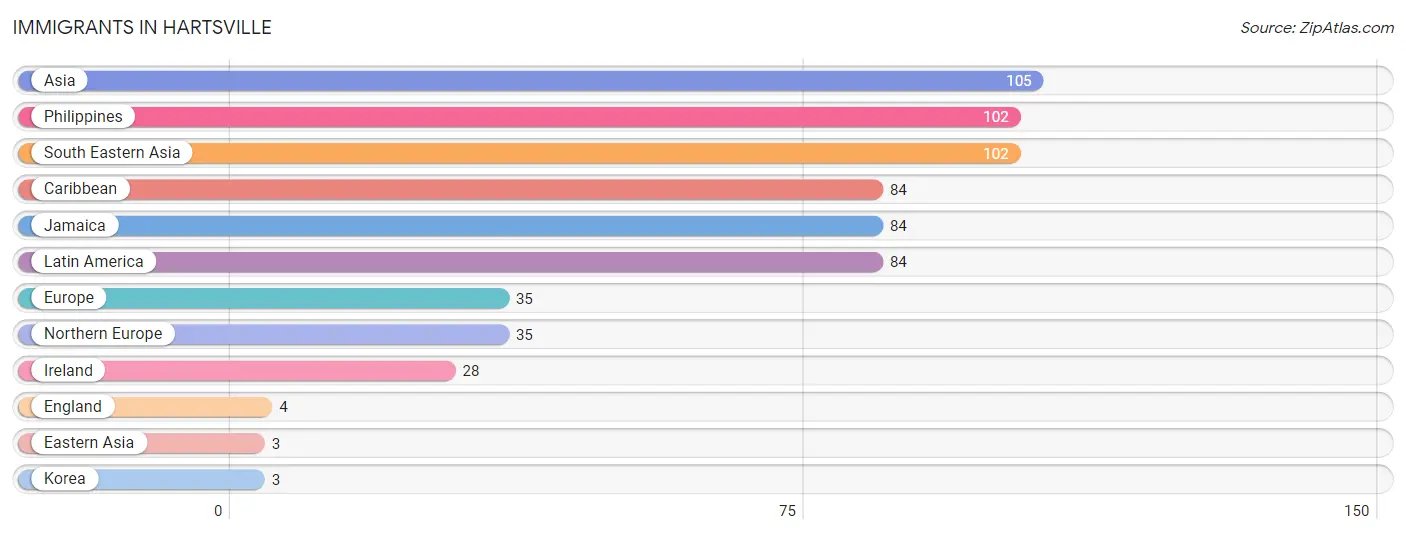
Immigrants in Hartsville
The most numerous immigrant groups reported in Hartsville came from Asia (105 | 1.4%), Philippines (102 | 1.4%), South Eastern Asia (102 | 1.4%), Caribbean (84 | 1.1%), and Jamaica (84 | 1.1%), together accounting for 6.4% of all Hartsville residents.
| Immigration Origin | # Population | % Population |
| Asia | 105 | 1.4% |
| Caribbean | 84 | 1.1% |
| Eastern Asia | 3 | 0.0% |
| England | 4 | 0.1% |
| Europe | 35 | 0.5% |
| Ireland | 28 | 0.4% |
| Jamaica | 84 | 1.1% |
| Korea | 3 | 0.0% |
| Latin America | 84 | 1.1% |
| Northern Europe | 35 | 0.5% |
| Philippines | 102 | 1.4% |
| South Eastern Asia | 102 | 1.4% | View All 12 Rows |
Sex and Age in Hartsville
Sex and Age in Hartsville
The most populous age groups in Hartsville are 10 to 14 Years (463 | 13.3%) for men and 15 to 19 Years (492 | 12.4%) for women.
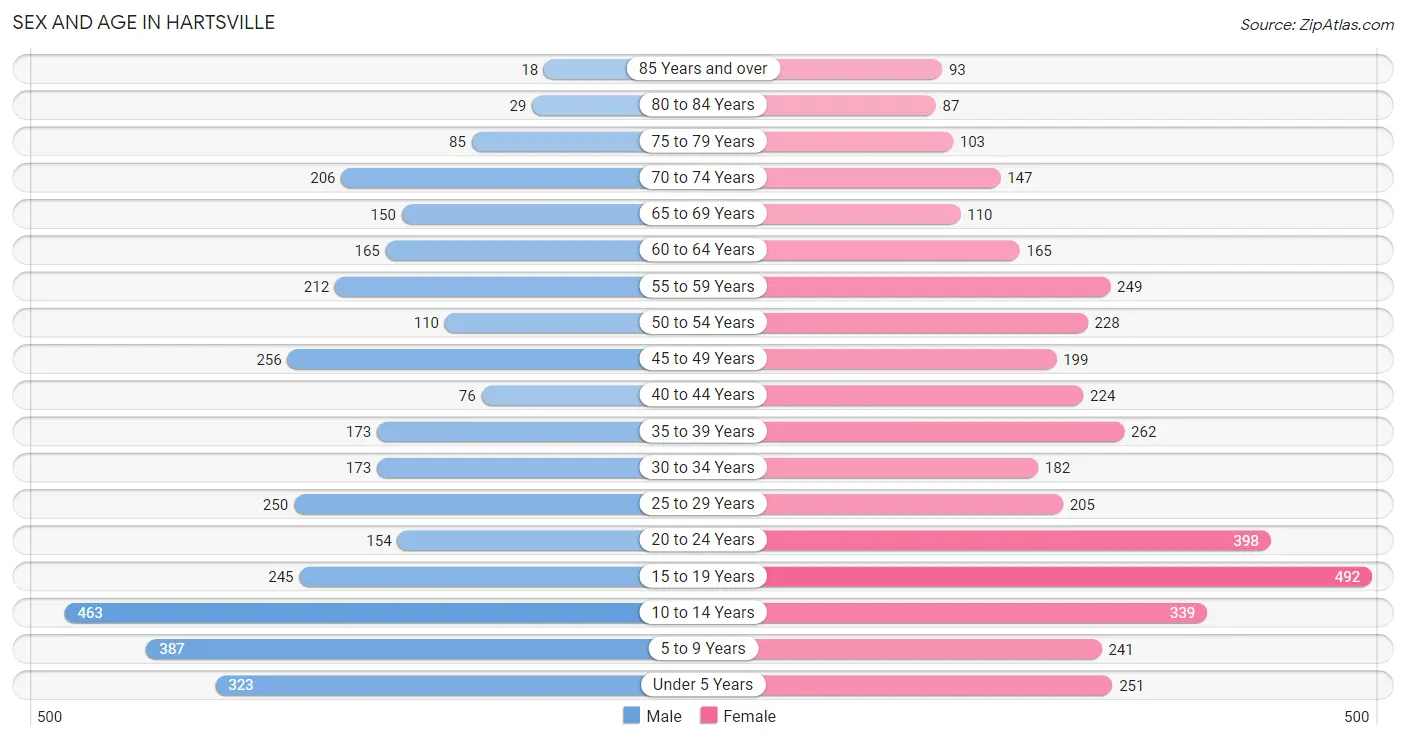
| Age Bracket | Male | Female |
| Under 5 Years | 323 (9.3%) | 251 (6.3%) |
| 5 to 9 Years | 387 (11.1%) | 241 (6.1%) |
| 10 to 14 Years | 463 (13.3%) | 339 (8.5%) |
| 15 to 19 Years | 245 (7.0%) | 492 (12.4%) |
| 20 to 24 Years | 154 (4.4%) | 398 (10.0%) |
| 25 to 29 Years | 250 (7.2%) | 205 (5.2%) |
| 30 to 34 Years | 173 (5.0%) | 182 (4.6%) |
| 35 to 39 Years | 173 (5.0%) | 262 (6.6%) |
| 40 to 44 Years | 76 (2.2%) | 224 (5.6%) |
| 45 to 49 Years | 256 (7.4%) | 199 (5.0%) |
| 50 to 54 Years | 110 (3.2%) | 228 (5.7%) |
| 55 to 59 Years | 212 (6.1%) | 249 (6.3%) |
| 60 to 64 Years | 165 (4.8%) | 165 (4.2%) |
| 65 to 69 Years | 150 (4.3%) | 110 (2.8%) |
| 70 to 74 Years | 206 (5.9%) | 147 (3.7%) |
| 75 to 79 Years | 85 (2.5%) | 103 (2.6%) |
| 80 to 84 Years | 29 (0.8%) | 87 (2.2%) |
| 85 Years and over | 18 (0.5%) | 93 (2.3%) |
| Total | 3,475 (100.0%) | 3,975 (100.0%) |
Families and Households in Hartsville
Median Family Size in Hartsville
The median family size in Hartsville is 3.23 persons per family, with single female/mother families (613 | 36.2%) accounting for the largest median family size of 3.9 persons per family. On the other hand, single male/father families (190 | 11.2%) represent the smallest median family size with 2.59 persons per family.
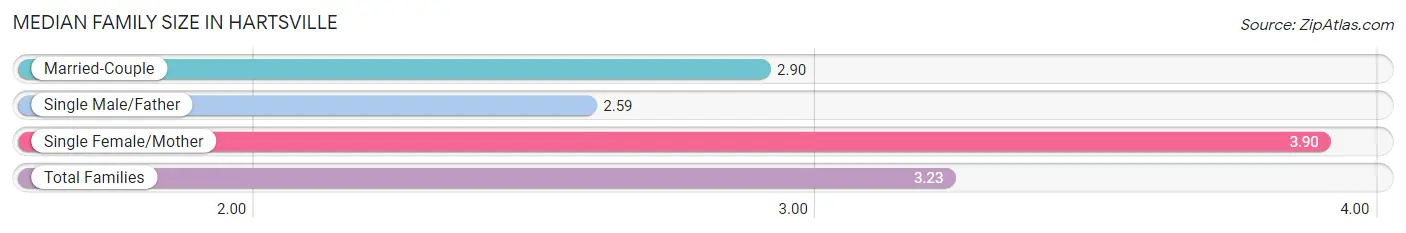
| Family Type | # Families | Family Size |
| Married-Couple | 889 (52.5%) | 2.90 |
| Single Male/Father | 190 (11.2%) | 2.59 |
| Single Female/Mother | 613 (36.2%) | 3.90 |
| Total Families | 1,692 (100.0%) | 3.23 |
Median Household Size in Hartsville
The median household size in Hartsville is 2.47 persons per household, with single female/mother households (613 | 22.2%) accounting for the largest median household size of 4.01 persons per household. non-family households (1,064 | 38.6%) represent the smallest median household size with 1.17 persons per household.
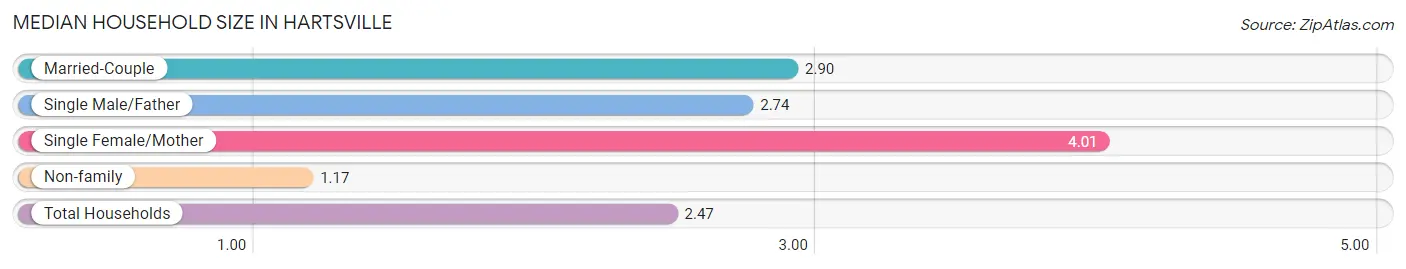
| Household Type | # Households | Household Size |
| Married-Couple | 889 (32.3%) | 2.90 |
| Single Male/Father | 190 (6.9%) | 2.74 |
| Single Female/Mother | 613 (22.2%) | 4.01 |
| Non-family | 1,064 (38.6%) | 1.17 |
| Total Households | 2,756 (100.0%) | 2.47 |
Household Size by Marriage Status in Hartsville
Out of a total of 2,756 households in Hartsville, 1,692 (61.4%) are family households, while 1,064 (38.6%) are nonfamily households. The most numerous type of family households are 2-person households, comprising 701, and the most common type of nonfamily households are 1-person households, comprising 955.
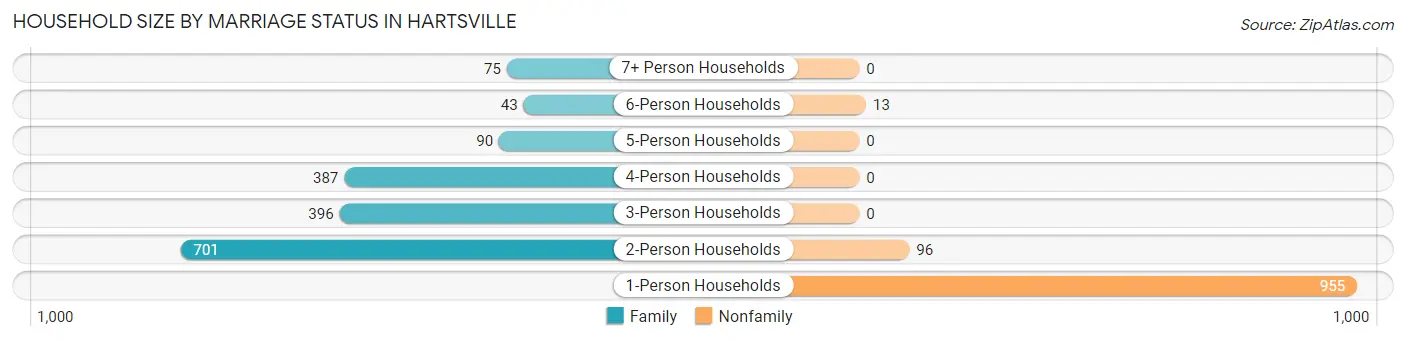
| Household Size | Family Households | Nonfamily Households |
| 1-Person Households | - | 955 (34.6%) |
| 2-Person Households | 701 (25.4%) | 96 (3.5%) |
| 3-Person Households | 396 (14.4%) | 0 (0.0%) |
| 4-Person Households | 387 (14.0%) | 0 (0.0%) |
| 5-Person Households | 90 (3.3%) | 0 (0.0%) |
| 6-Person Households | 43 (1.6%) | 13 (0.5%) |
| 7+ Person Households | 75 (2.7%) | 0 (0.0%) |
| Total | 1,692 (61.4%) | 1,064 (38.6%) |
Female Fertility in Hartsville
Fertility by Age in Hartsville
Average fertility rate in Hartsville is 125.0 births per 1,000 women. Women in the age bracket of 35 to 50 years have the highest fertility rate with 197.0 births per 1,000 women. Women in the age bracket of 35 to 50 years acount for 56.3% of all women with births.
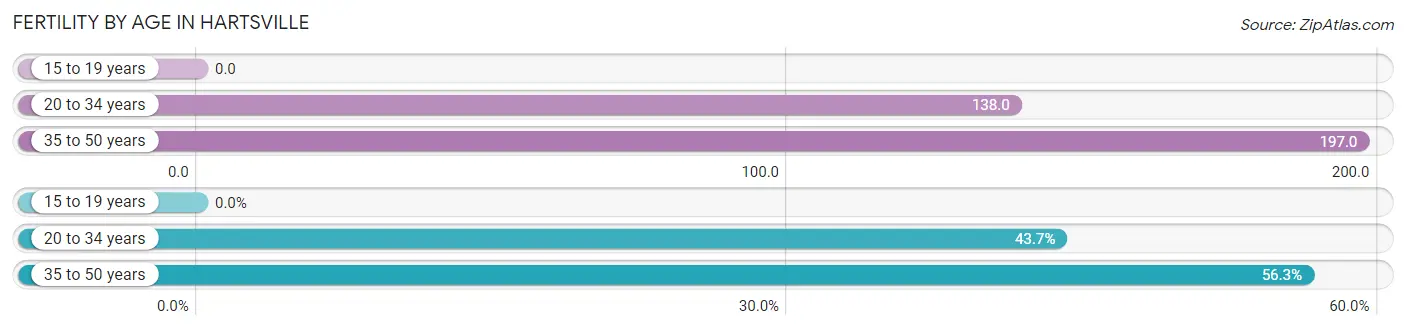
| Age Bracket | Women with Births | Births / 1,000 Women |
| 15 to 19 years | 0 (0.0%) | 0.0 |
| 20 to 34 years | 108 (43.7%) | 138.0 |
| 35 to 50 years | 139 (56.3%) | 197.0 |
| Total | 247 (100.0%) | 125.0 |
Fertility by Age by Marriage Status in Hartsville
19.8% of women with births (247) in Hartsville are married. The highest percentage of unmarried women with births falls into 35 to 50 years age bracket with 88.5% of them unmarried at the time of birth, while the lowest percentage of unmarried women with births belong to 20 to 34 years age bracket with 69.4% of them unmarried.
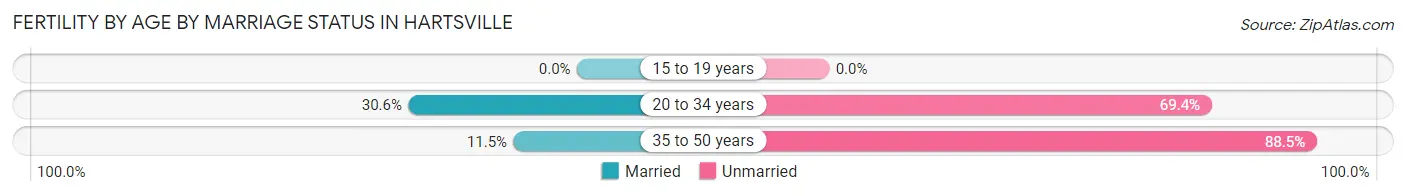
| Age Bracket | Married | Unmarried |
| 15 to 19 years | 0 (0.0%) | 0 (0.0%) |
| 20 to 34 years | 33 (30.6%) | 75 (69.4%) |
| 35 to 50 years | 16 (11.5%) | 123 (88.5%) |
| Total | 49 (19.8%) | 198 (80.2%) |
Fertility by Education in Hartsville
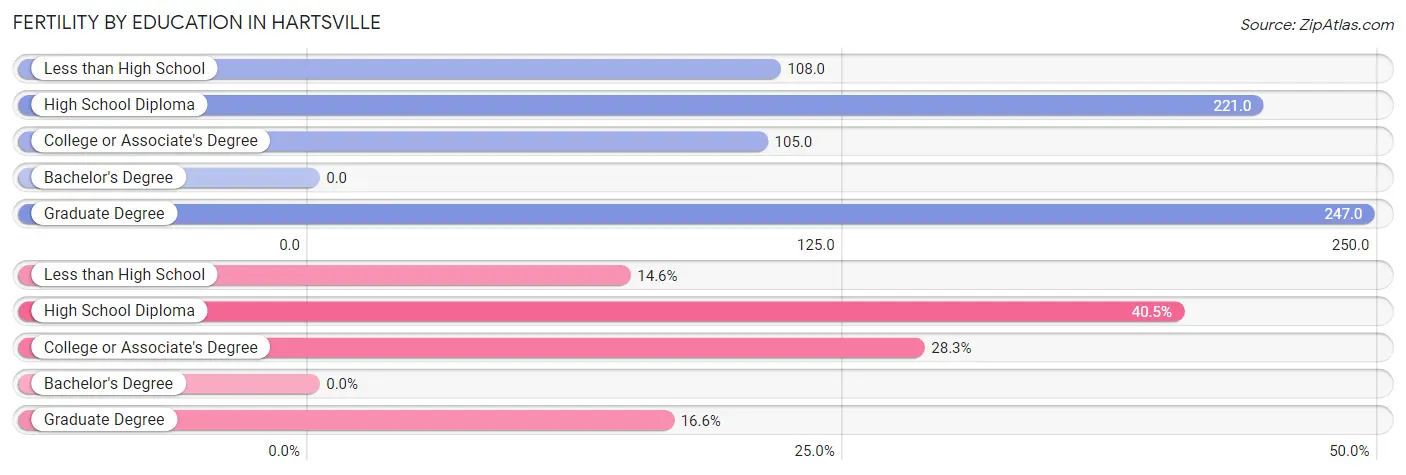
| Educational Attainment | Women with Births | Births / 1,000 Women |
| Less than High School | 36 (14.6%) | 108.0 |
| High School Diploma | 100 (40.5%) | 221.0 |
| College or Associate's Degree | 70 (28.3%) | 105.0 |
| Bachelor's Degree | 0 (0.0%) | 0.0 |
| Graduate Degree | 41 (16.6%) | 247.0 |
| Total | 247 (100.0%) | 125.0 |
Fertility by Education by Marriage Status in Hartsville
80.2% of women with births in Hartsville are unmarried. Women with the educational attainment of graduate degree are most likely to be married with 100.0% of them married at childbirth, while women with the educational attainment of less than high school are least likely to be married with 100.0% of them unmarried at childbirth.
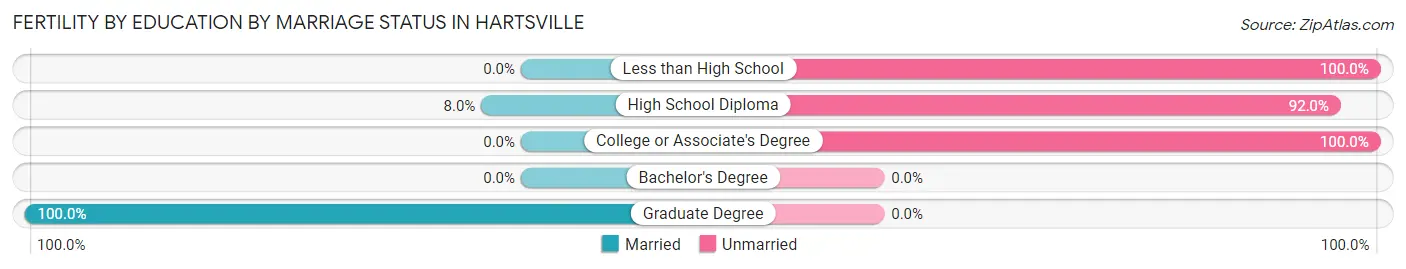
| Educational Attainment | Married | Unmarried |
| Less than High School | 0 (0.0%) | 36 (100.0%) |
| High School Diploma | 8 (8.0%) | 92 (92.0%) |
| College or Associate's Degree | 0 (0.0%) | 70 (100.0%) |
| Bachelor's Degree | 0 (0.0%) | 0 (0.0%) |
| Graduate Degree | 41 (100.0%) | 0 (0.0%) |
| Total | 49 (19.8%) | 198 (80.2%) |
Employment Characteristics in Hartsville
Employment by Class of Employer in Hartsville
Among the 2,778 employed individuals in Hartsville, private company employees (1,894 | 68.2%), self-employed (not incorporated) (233 | 8.4%), and local government employees (231 | 8.3%) make up the most common classes of employment.
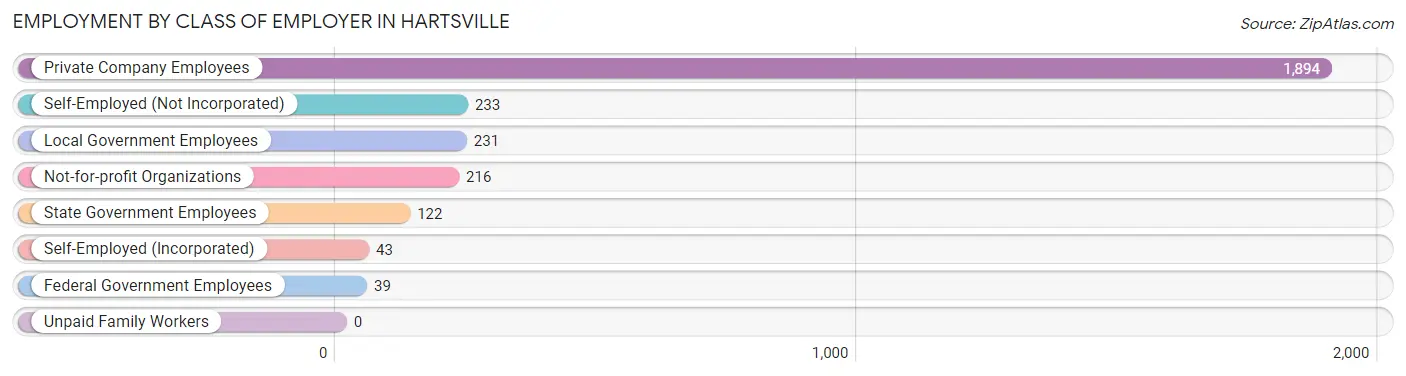
| Employer Class | # Employees | % Employees |
| Private Company Employees | 1,894 | 68.2% |
| Self-Employed (Incorporated) | 43 | 1.5% |
| Self-Employed (Not Incorporated) | 233 | 8.4% |
| Not-for-profit Organizations | 216 | 7.8% |
| Local Government Employees | 231 | 8.3% |
| State Government Employees | 122 | 4.4% |
| Federal Government Employees | 39 | 1.4% |
| Unpaid Family Workers | 0 | 0.0% |
| Total | 2,778 | 100.0% |
Employment Status by Age in Hartsville
According to the labor force statistics for Hartsville, out of the total population over 16 years of age (5,321), 58.6% or 3,118 individuals are in the labor force, with 9.2% or 287 of them unemployed. The age group with the highest labor force participation rate is 25 to 29 years, with 89.5% or 407 individuals in the labor force. Within the labor force, the 20 to 24 years age range has the highest percentage of unemployed individuals, with 19.9% or 59 of them being unemployed.
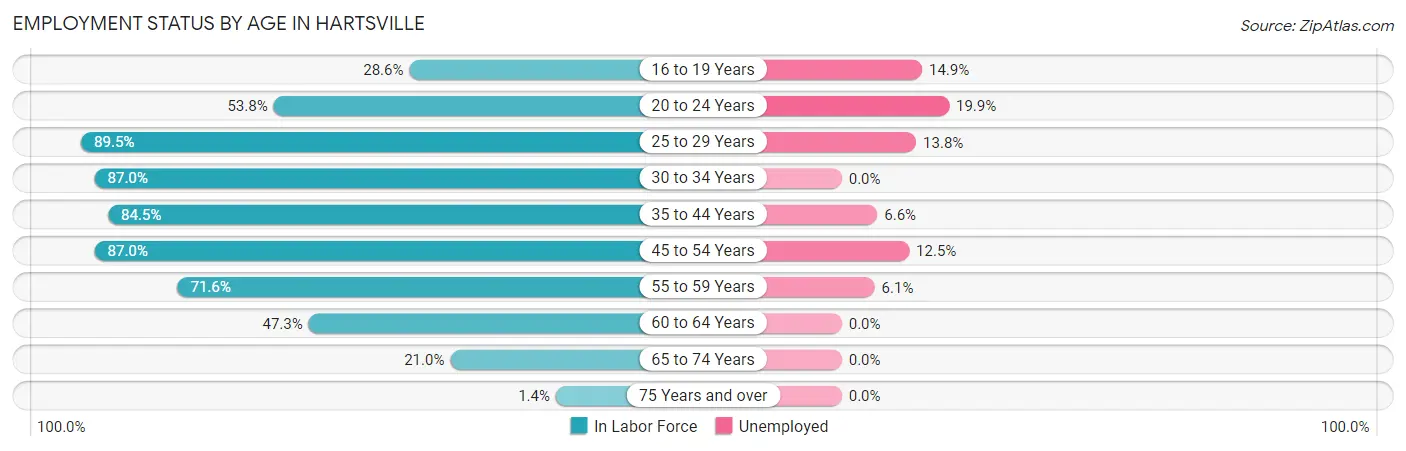
| Age Bracket | In Labor Force | Unemployed |
| 16 to 19 Years | 175 (28.6%) | 26 (14.9%) |
| 20 to 24 Years | 297 (53.8%) | 59 (19.9%) |
| 25 to 29 Years | 407 (89.5%) | 56 (13.8%) |
| 30 to 34 Years | 309 (87.0%) | 0 (0.0%) |
| 35 to 44 Years | 621 (84.5%) | 41 (6.6%) |
| 45 to 54 Years | 690 (87.0%) | 86 (12.5%) |
| 55 to 59 Years | 330 (71.6%) | 20 (6.1%) |
| 60 to 64 Years | 156 (47.3%) | 0 (0.0%) |
| 65 to 74 Years | 129 (21.0%) | 0 (0.0%) |
| 75 Years and over | 6 (1.4%) | 0 (0.0%) |
| Total | 3,118 (58.6%) | 287 (9.2%) |
Employment Status by Educational Attainment in Hartsville
According to labor force statistics for Hartsville, 80.3% of individuals (2,513) out of the total population between 25 and 64 years of age (3,129) are in the labor force, with 8.1% or 204 of them being unemployed. The group with the highest labor force participation rate are those with the educational attainment of bachelor's degree or higher, with 90.7% or 1,034 individuals in the labor force. Within the labor force, individuals with high school diploma education have the highest percentage of unemployment, with 19.6% or 140 of them being unemployed.
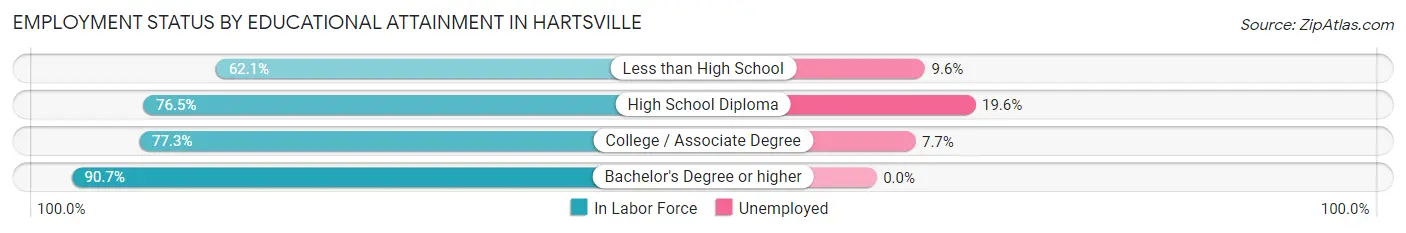
| Educational Attainment | In Labor Force | Unemployed |
| Less than High School | 208 (62.1%) | 32 (9.6%) |
| High School Diploma | 713 (76.5%) | 183 (19.6%) |
| College / Associate Degree | 558 (77.3%) | 56 (7.7%) |
| Bachelor's Degree or higher | 1,034 (90.7%) | 0 (0.0%) |
| Total | 2,513 (80.3%) | 253 (8.1%) |
Employment Occupations by Sex in Hartsville
Management, Business, Science and Arts Occupations
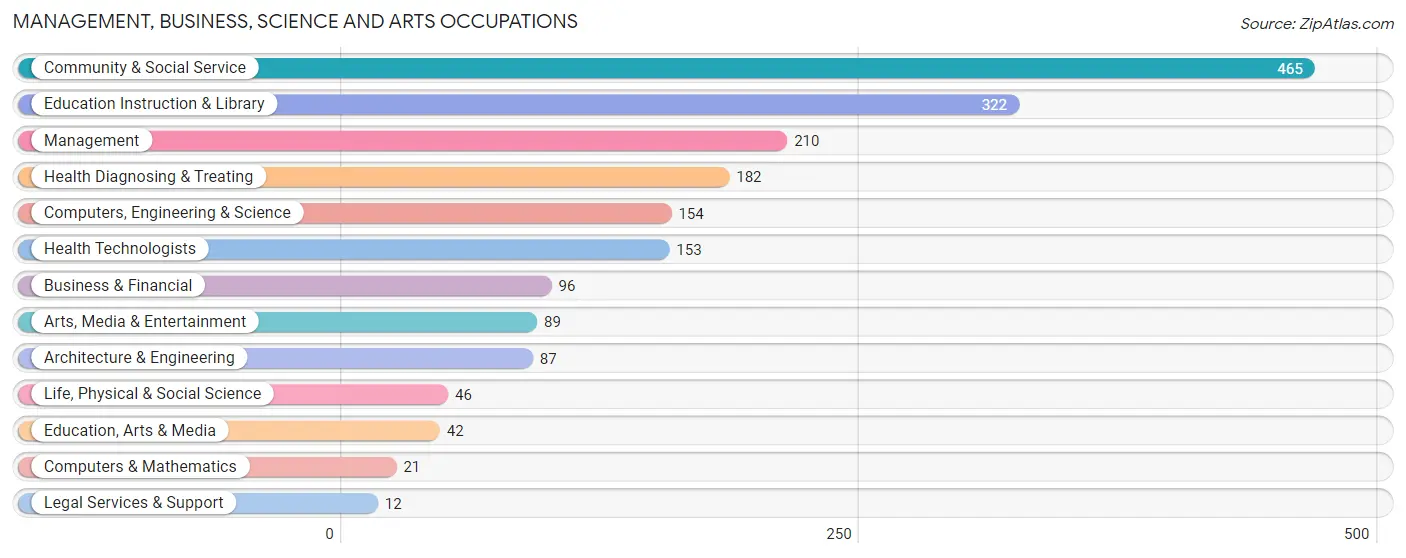
The most common Management, Business, Science and Arts occupations in Hartsville are Community & Social Service (465 | 16.4%), Education Instruction & Library (322 | 11.4%), Management (210 | 7.4%), Health Diagnosing & Treating (182 | 6.4%), and Computers, Engineering & Science (154 | 5.4%).
Management, Business, Science and Arts Occupations by Sex
Within the Management, Business, Science and Arts occupations in Hartsville, the most male-oriented occupations are Architecture & Engineering (75.9%), Arts, Media & Entertainment (74.2%), and Computers & Mathematics (71.4%), while the most female-oriented occupations are Life, Physical & Social Science (100.0%), Legal Services & Support (100.0%), and Education Instruction & Library (86.3%).
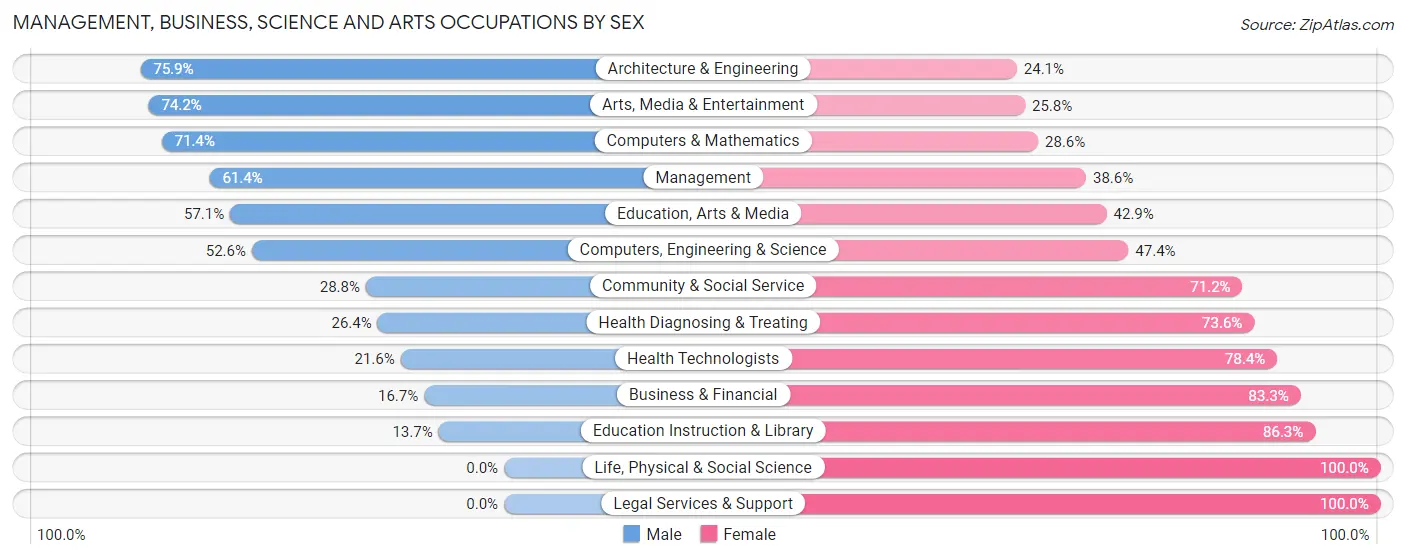
| Occupation | Male | Female |
| Management | 129 (61.4%) | 81 (38.6%) |
| Business & Financial | 16 (16.7%) | 80 (83.3%) |
| Computers, Engineering & Science | 81 (52.6%) | 73 (47.4%) |
| Computers & Mathematics | 15 (71.4%) | 6 (28.6%) |
| Architecture & Engineering | 66 (75.9%) | 21 (24.1%) |
| Life, Physical & Social Science | 0 (0.0%) | 46 (100.0%) |
| Community & Social Service | 134 (28.8%) | 331 (71.2%) |
| Education, Arts & Media | 24 (57.1%) | 18 (42.9%) |
| Legal Services & Support | 0 (0.0%) | 12 (100.0%) |
| Education Instruction & Library | 44 (13.7%) | 278 (86.3%) |
| Arts, Media & Entertainment | 66 (74.2%) | 23 (25.8%) |
| Health Diagnosing & Treating | 48 (26.4%) | 134 (73.6%) |
| Health Technologists | 33 (21.6%) | 120 (78.4%) |
| Total (Category) | 408 (36.9%) | 699 (63.1%) |
| Total (Overall) | 1,181 (41.7%) | 1,651 (58.3%) |
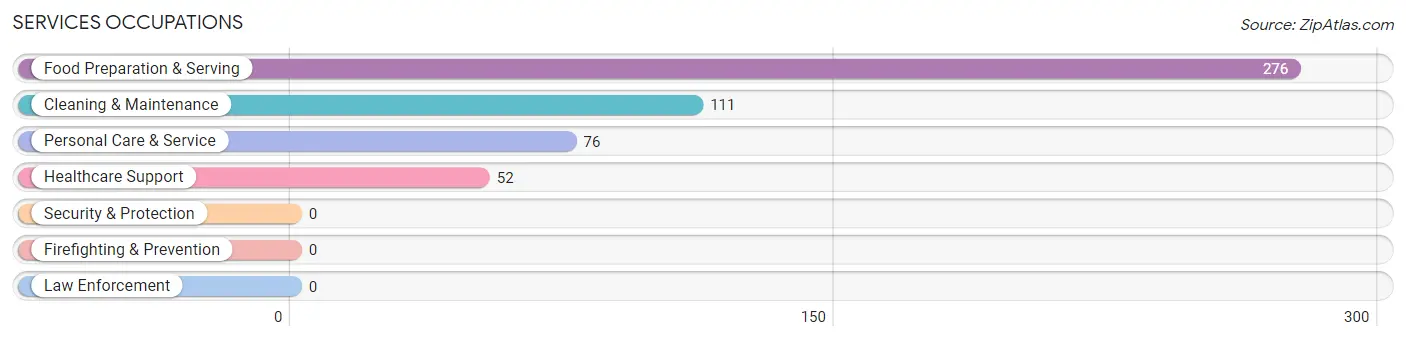
Services Occupations
The most common Services occupations in Hartsville are Food Preparation & Serving (276 | 9.8%), Cleaning & Maintenance (111 | 3.9%), Personal Care & Service (76 | 2.7%), and Healthcare Support (52 | 1.8%).
Services Occupations by Sex
Within the Services occupations in Hartsville, the most male-oriented occupations are Cleaning & Maintenance (71.2%), Food Preparation & Serving (39.5%), and Personal Care & Service (15.8%), while the most female-oriented occupations are Healthcare Support (100.0%), Personal Care & Service (84.2%), and Food Preparation & Serving (60.5%).
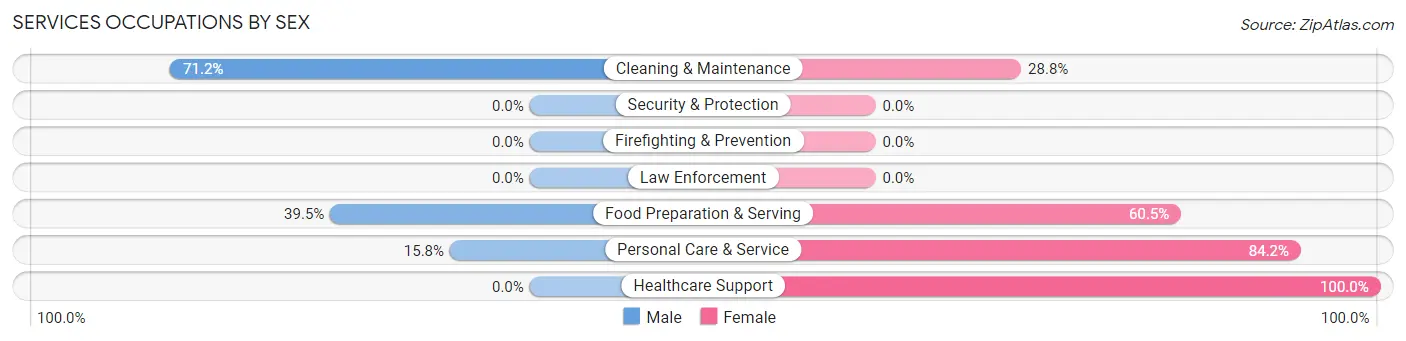
| Occupation | Male | Female |
| Healthcare Support | 0 (0.0%) | 52 (100.0%) |
| Security & Protection | 0 (0.0%) | 0 (0.0%) |
| Firefighting & Prevention | 0 (0.0%) | 0 (0.0%) |
| Law Enforcement | 0 (0.0%) | 0 (0.0%) |
| Food Preparation & Serving | 109 (39.5%) | 167 (60.5%) |
| Cleaning & Maintenance | 79 (71.2%) | 32 (28.8%) |
| Personal Care & Service | 12 (15.8%) | 64 (84.2%) |
| Total (Category) | 200 (38.8%) | 315 (61.2%) |
| Total (Overall) | 1,181 (41.7%) | 1,651 (58.3%) |
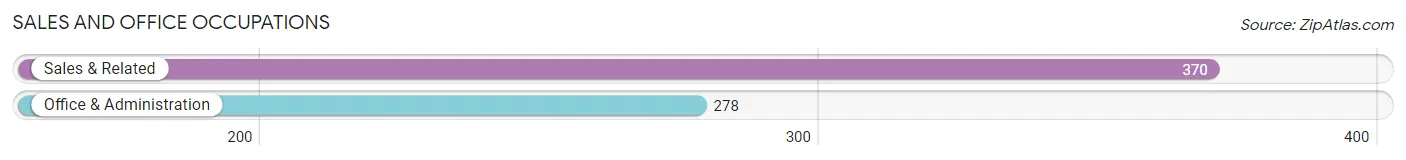
Sales and Office Occupations
The most common Sales and Office occupations in Hartsville are Sales & Related (370 | 13.1%), and Office & Administration (278 | 9.8%).
Sales and Office Occupations by Sex
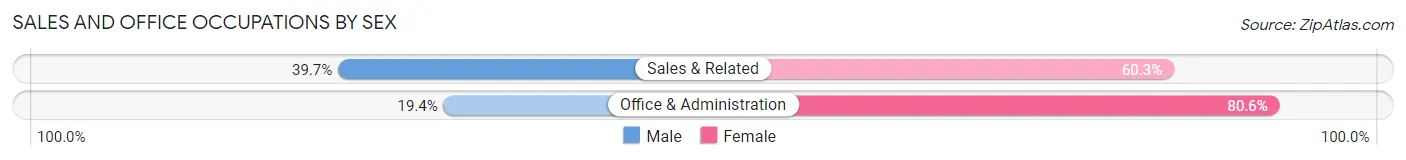
| Occupation | Male | Female |
| Sales & Related | 147 (39.7%) | 223 (60.3%) |
| Office & Administration | 54 (19.4%) | 224 (80.6%) |
| Total (Category) | 201 (31.0%) | 447 (69.0%) |
| Total (Overall) | 1,181 (41.7%) | 1,651 (58.3%) |
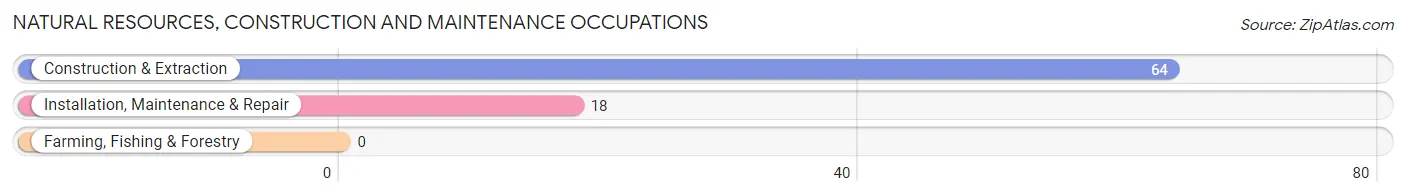
Natural Resources, Construction and Maintenance Occupations
The most common Natural Resources, Construction and Maintenance occupations in Hartsville are Construction & Extraction (64 | 2.3%), and Installation, Maintenance & Repair (18 | 0.6%).
Natural Resources, Construction and Maintenance Occupations by Sex
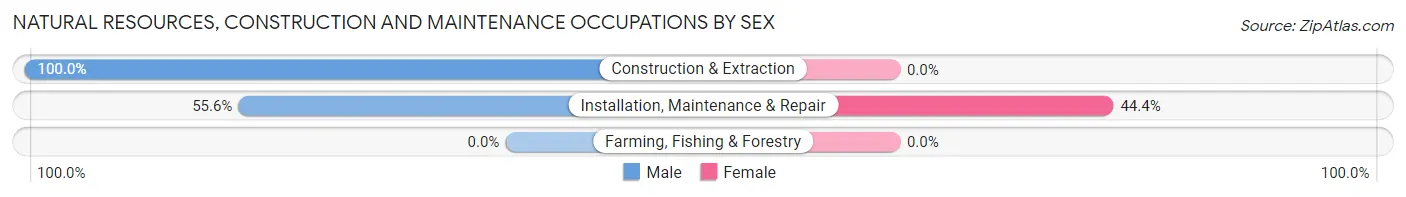
| Occupation | Male | Female |
| Farming, Fishing & Forestry | 0 (0.0%) | 0 (0.0%) |
| Construction & Extraction | 64 (100.0%) | 0 (0.0%) |
| Installation, Maintenance & Repair | 10 (55.6%) | 8 (44.4%) |
| Total (Category) | 74 (90.2%) | 8 (9.8%) |
| Total (Overall) | 1,181 (41.7%) | 1,651 (58.3%) |
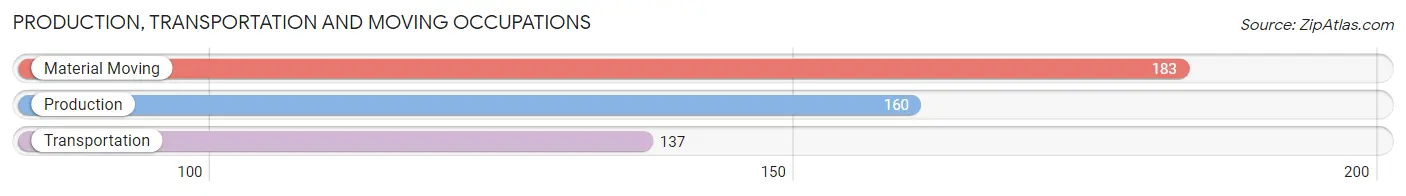
Production, Transportation and Moving Occupations
The most common Production, Transportation and Moving occupations in Hartsville are Material Moving (183 | 6.5%), Production (160 | 5.7%), and Transportation (137 | 4.8%).
Production, Transportation and Moving Occupations by Sex
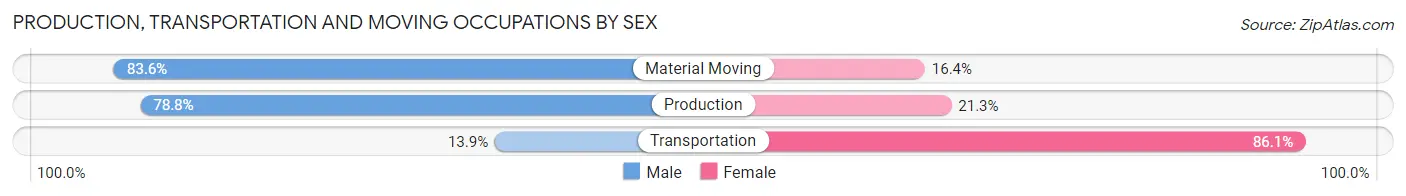
| Occupation | Male | Female |
| Production | 126 (78.7%) | 34 (21.2%) |
| Transportation | 19 (13.9%) | 118 (86.1%) |
| Material Moving | 153 (83.6%) | 30 (16.4%) |
| Total (Category) | 298 (62.1%) | 182 (37.9%) |
| Total (Overall) | 1,181 (41.7%) | 1,651 (58.3%) |
Employment Industries by Sex in Hartsville
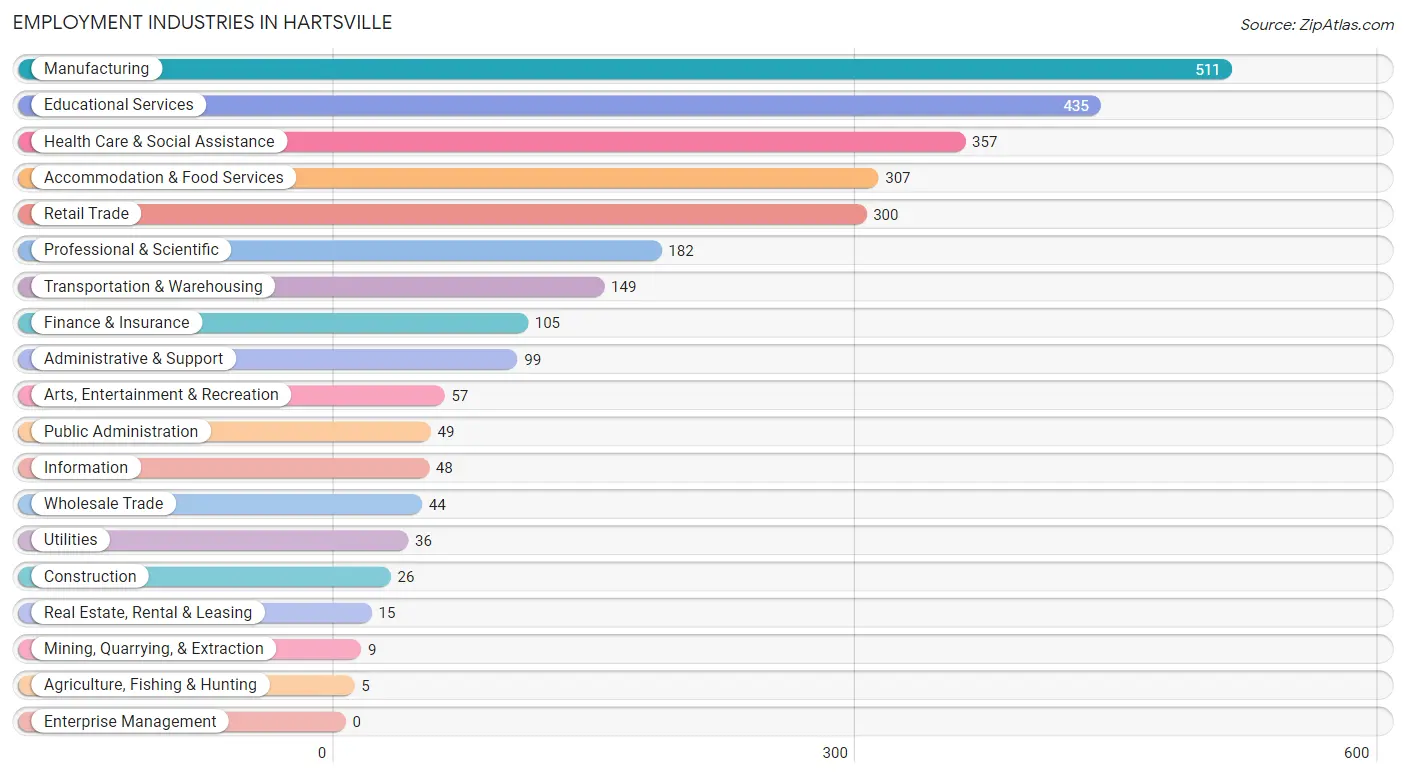
Employment Industries in Hartsville
The major employment industries in Hartsville include Manufacturing (511 | 18.0%), Educational Services (435 | 15.4%), Health Care & Social Assistance (357 | 12.6%), Accommodation & Food Services (307 | 10.8%), and Retail Trade (300 | 10.6%).
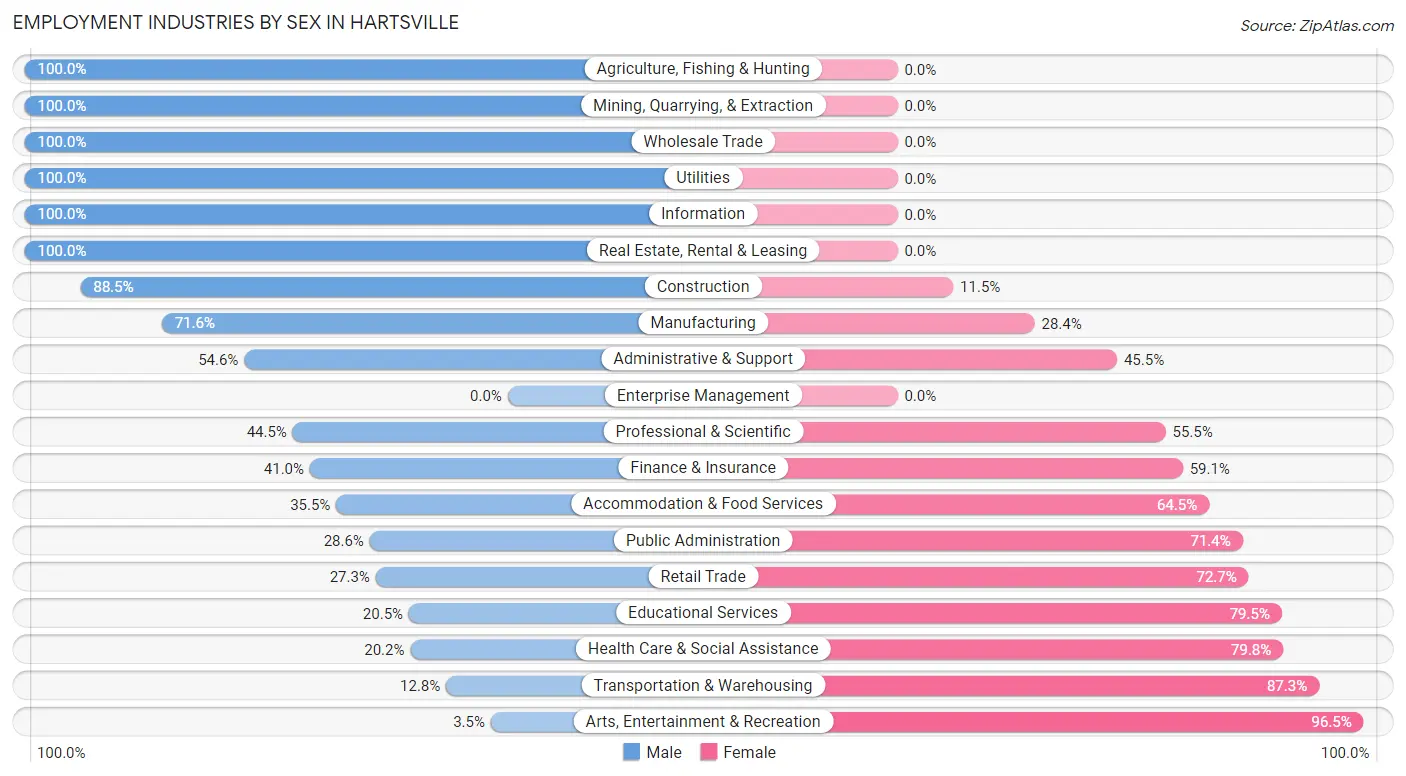
Employment Industries by Sex in Hartsville
The Hartsville industries that see more men than women are Agriculture, Fishing & Hunting (100.0%), Mining, Quarrying, & Extraction (100.0%), and Wholesale Trade (100.0%), whereas the industries that tend to have a higher number of women are Arts, Entertainment & Recreation (96.5%), Transportation & Warehousing (87.3%), and Health Care & Social Assistance (79.8%).
| Industry | Male | Female |
| Agriculture, Fishing & Hunting | 5 (100.0%) | 0 (0.0%) |
| Mining, Quarrying, & Extraction | 9 (100.0%) | 0 (0.0%) |
| Construction | 23 (88.5%) | 3 (11.5%) |
| Manufacturing | 366 (71.6%) | 145 (28.4%) |
| Wholesale Trade | 44 (100.0%) | 0 (0.0%) |
| Retail Trade | 82 (27.3%) | 218 (72.7%) |
| Transportation & Warehousing | 19 (12.8%) | 130 (87.3%) |
| Utilities | 36 (100.0%) | 0 (0.0%) |
| Information | 48 (100.0%) | 0 (0.0%) |
| Finance & Insurance | 43 (40.9%) | 62 (59.1%) |
| Real Estate, Rental & Leasing | 15 (100.0%) | 0 (0.0%) |
| Professional & Scientific | 81 (44.5%) | 101 (55.5%) |
| Enterprise Management | 0 (0.0%) | 0 (0.0%) |
| Administrative & Support | 54 (54.5%) | 45 (45.5%) |
| Educational Services | 89 (20.5%) | 346 (79.5%) |
| Health Care & Social Assistance | 72 (20.2%) | 285 (79.8%) |
| Arts, Entertainment & Recreation | 2 (3.5%) | 55 (96.5%) |
| Accommodation & Food Services | 109 (35.5%) | 198 (64.5%) |
| Public Administration | 14 (28.6%) | 35 (71.4%) |
| Total | 1,181 (41.7%) | 1,651 (58.3%) |
Education in Hartsville
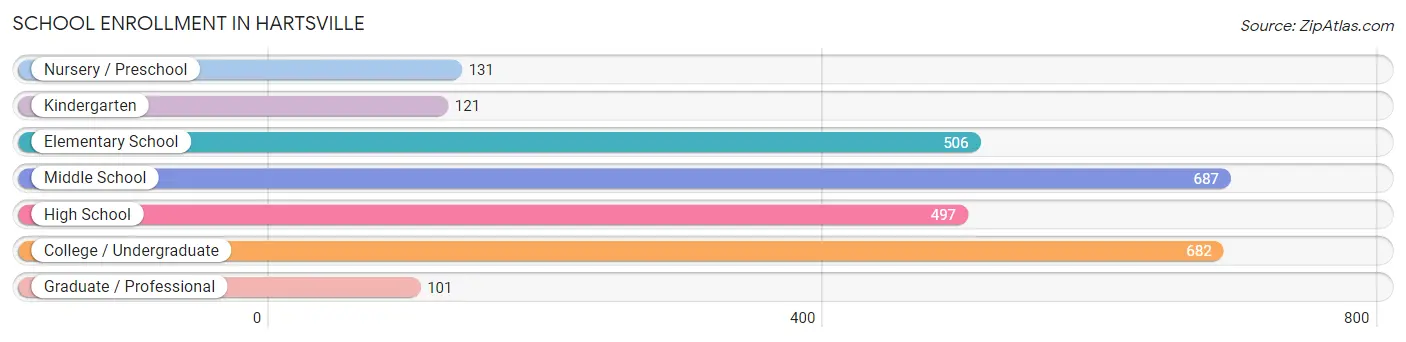
School Enrollment in Hartsville
The most common levels of schooling among the 2,725 students in Hartsville are middle school (687 | 25.2%), college / undergraduate (682 | 25.0%), and elementary school (506 | 18.6%).
| School Level | # Students | % Students |
| Nursery / Preschool | 131 | 4.8% |
| Kindergarten | 121 | 4.4% |
| Elementary School | 506 | 18.6% |
| Middle School | 687 | 25.2% |
| High School | 497 | 18.2% |
| College / Undergraduate | 682 | 25.0% |
| Graduate / Professional | 101 | 3.7% |
| Total | 2,725 | 100.0% |
School Enrollment by Age by Funding Source in Hartsville
Out of a total of 2,725 students who are enrolled in schools in Hartsville, 700 (25.7%) attend a private institution, while the remaining 2,025 (74.3%) are enrolled in public schools. The age group of 20 to 24 year olds has the highest likelihood of being enrolled in private schools, with 228 (75.2% in the age bracket) enrolled. Conversely, the age group of 3 to 4 year olds has the lowest likelihood of being enrolled in a private school, with 125 (100.0% in the age bracket) attending a public institution.
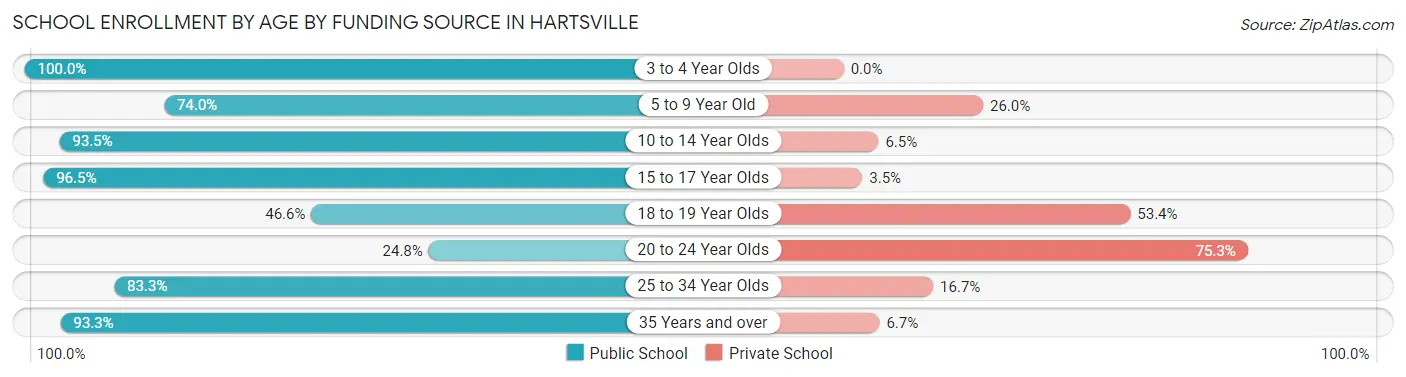
| Age Bracket | Public School | Private School |
| 3 to 4 Year Olds | 125 (100.0%) | 0 (0.0%) |
| 5 to 9 Year Old | 465 (74.0%) | 163 (26.0%) |
| 10 to 14 Year Olds | 750 (93.5%) | 52 (6.5%) |
| 15 to 17 Year Olds | 277 (96.5%) | 10 (3.5%) |
| 18 to 19 Year Olds | 199 (46.6%) | 228 (53.4%) |
| 20 to 24 Year Olds | 75 (24.7%) | 228 (75.2%) |
| 25 to 34 Year Olds | 65 (83.3%) | 13 (16.7%) |
| 35 Years and over | 70 (93.3%) | 5 (6.7%) |
| Total | 2,025 (74.3%) | 700 (25.7%) |
Educational Attainment by Field of Study in Hartsville
Education (256 | 18.4%), business (205 | 14.8%), science & technology (140 | 10.1%), social sciences (135 | 9.7%), and psychology (108 | 7.8%) are the most common fields of study among 1,389 individuals in Hartsville who have obtained a bachelor's degree or higher.
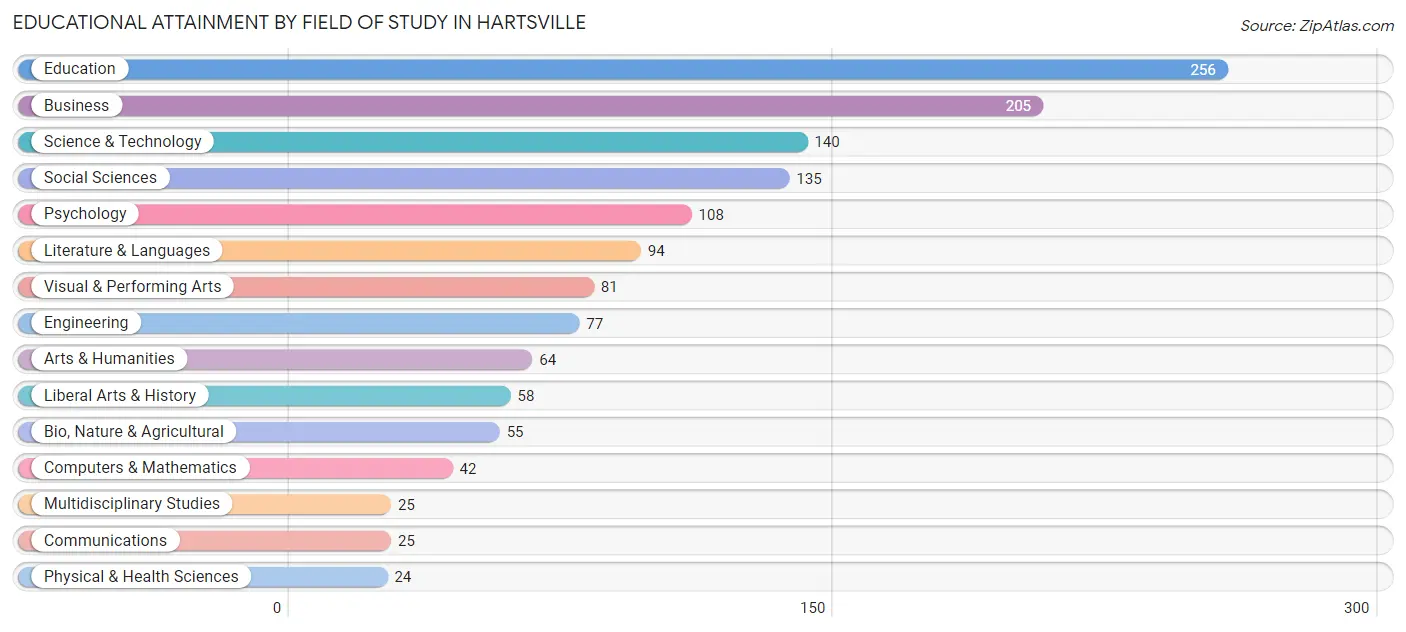
| Field of Study | # Graduates | % Graduates |
| Computers & Mathematics | 42 | 3.0% |
| Bio, Nature & Agricultural | 55 | 4.0% |
| Physical & Health Sciences | 24 | 1.7% |
| Psychology | 108 | 7.8% |
| Social Sciences | 135 | 9.7% |
| Engineering | 77 | 5.5% |
| Multidisciplinary Studies | 25 | 1.8% |
| Science & Technology | 140 | 10.1% |
| Business | 205 | 14.8% |
| Education | 256 | 18.4% |
| Literature & Languages | 94 | 6.8% |
| Liberal Arts & History | 58 | 4.2% |
| Visual & Performing Arts | 81 | 5.8% |
| Communications | 25 | 1.8% |
| Arts & Humanities | 64 | 4.6% |
| Total | 1,389 | 100.0% |
Transportation & Commute in Hartsville
Vehicle Availability by Sex in Hartsville
The most prevalent vehicle ownership categories in Hartsville are males with 2 vehicles (422, accounting for 37.0%) and females with 2 vehicles (519, making up 28.5%).
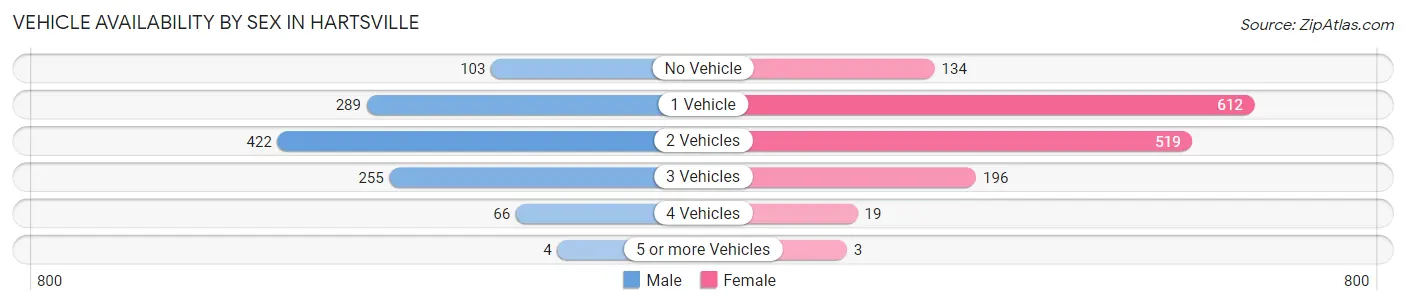
| Vehicles Available | Male | Female |
| No Vehicle | 103 (9.0%) | 134 (9.0%) |
| 1 Vehicle | 289 (25.4%) | 612 (41.3%) |
| 2 Vehicles | 422 (37.0%) | 519 (35.0%) |
| 3 Vehicles | 255 (22.4%) | 196 (13.2%) |
| 4 Vehicles | 66 (5.8%) | 19 (1.3%) |
| 5 or more Vehicles | 4 (0.4%) | 3 (0.2%) |
| Total | 1,139 (100.0%) | 1,483 (100.0%) |
Commute Time in Hartsville
The most frequently occuring commute durations in Hartsville are 5 to 9 minutes (667 commuters, 24.5%), 10 to 14 minutes (551 commuters, 20.2%), and less than 5 minutes (265 commuters, 9.7%).
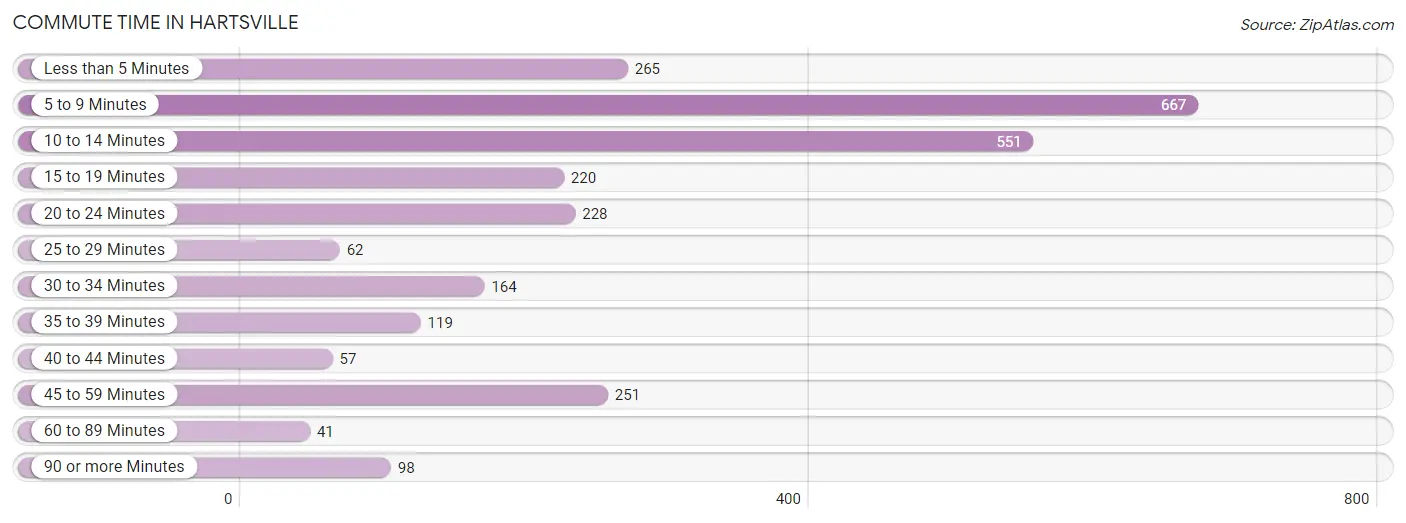
| Commute Time | # Commuters | % Commuters |
| Less than 5 Minutes | 265 | 9.7% |
| 5 to 9 Minutes | 667 | 24.5% |
| 10 to 14 Minutes | 551 | 20.2% |
| 15 to 19 Minutes | 220 | 8.1% |
| 20 to 24 Minutes | 228 | 8.4% |
| 25 to 29 Minutes | 62 | 2.3% |
| 30 to 34 Minutes | 164 | 6.0% |
| 35 to 39 Minutes | 119 | 4.4% |
| 40 to 44 Minutes | 57 | 2.1% |
| 45 to 59 Minutes | 251 | 9.2% |
| 60 to 89 Minutes | 41 | 1.5% |
| 90 or more Minutes | 98 | 3.6% |
Commute Time by Sex in Hartsville
The most common commute times in Hartsville are 5 to 9 minutes (259 commuters, 22.8%) for males and 5 to 9 minutes (408 commuters, 25.7%) for females.
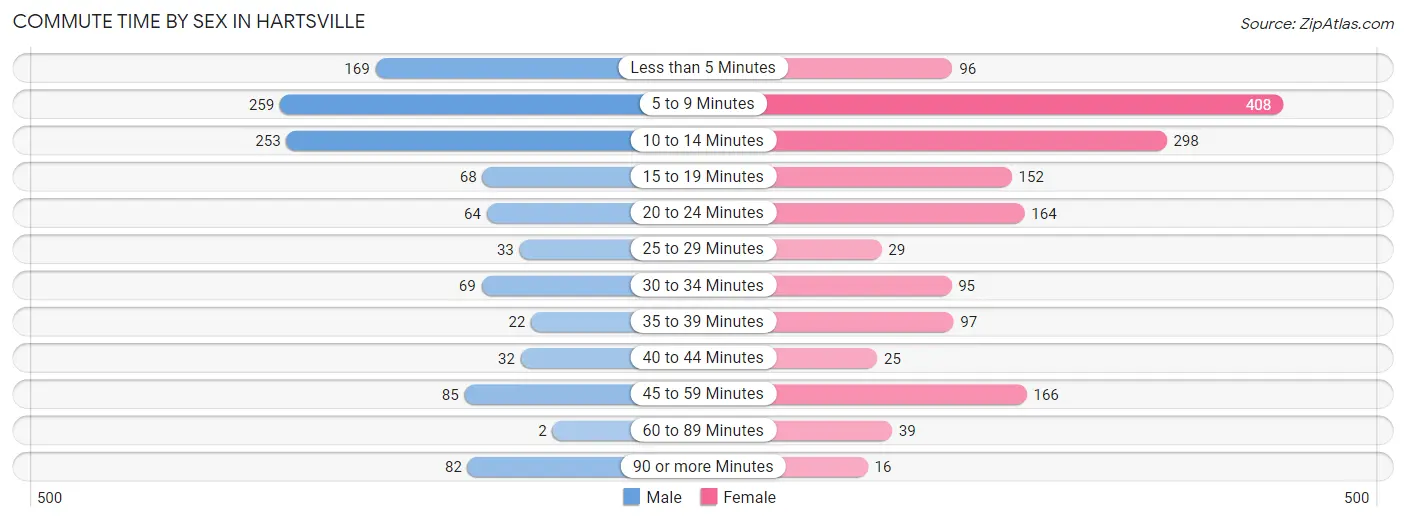
| Commute Time | Male | Female |
| Less than 5 Minutes | 169 (14.8%) | 96 (6.1%) |
| 5 to 9 Minutes | 259 (22.8%) | 408 (25.7%) |
| 10 to 14 Minutes | 253 (22.2%) | 298 (18.8%) |
| 15 to 19 Minutes | 68 (6.0%) | 152 (9.6%) |
| 20 to 24 Minutes | 64 (5.6%) | 164 (10.3%) |
| 25 to 29 Minutes | 33 (2.9%) | 29 (1.8%) |
| 30 to 34 Minutes | 69 (6.1%) | 95 (6.0%) |
| 35 to 39 Minutes | 22 (1.9%) | 97 (6.1%) |
| 40 to 44 Minutes | 32 (2.8%) | 25 (1.6%) |
| 45 to 59 Minutes | 85 (7.5%) | 166 (10.5%) |
| 60 to 89 Minutes | 2 (0.2%) | 39 (2.5%) |
| 90 or more Minutes | 82 (7.2%) | 16 (1.0%) |
Time of Departure to Work by Sex in Hartsville
The most frequent times of departure to work in Hartsville are 7:00 AM to 7:29 AM (196, 17.2%) for males and 7:00 AM to 7:29 AM (298, 18.8%) for females.
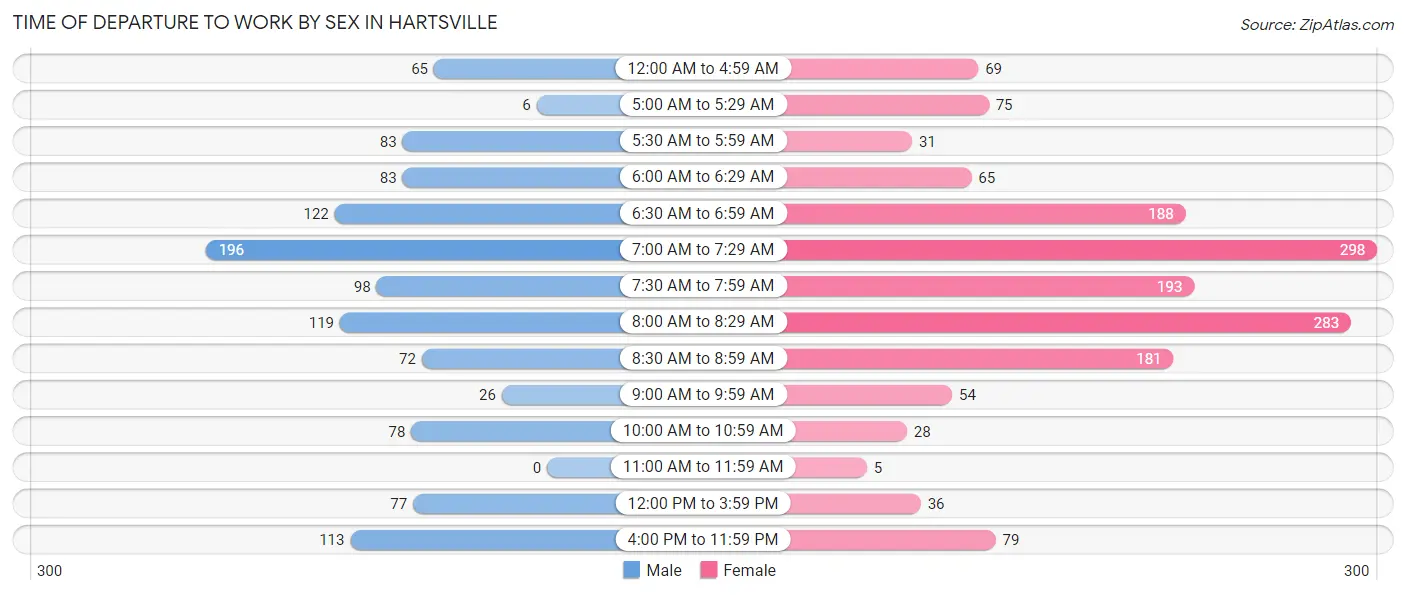
| Time of Departure | Male | Female |
| 12:00 AM to 4:59 AM | 65 (5.7%) | 69 (4.3%) |
| 5:00 AM to 5:29 AM | 6 (0.5%) | 75 (4.7%) |
| 5:30 AM to 5:59 AM | 83 (7.3%) | 31 (2.0%) |
| 6:00 AM to 6:29 AM | 83 (7.3%) | 65 (4.1%) |
| 6:30 AM to 6:59 AM | 122 (10.7%) | 188 (11.9%) |
| 7:00 AM to 7:29 AM | 196 (17.2%) | 298 (18.8%) |
| 7:30 AM to 7:59 AM | 98 (8.6%) | 193 (12.2%) |
| 8:00 AM to 8:29 AM | 119 (10.5%) | 283 (17.8%) |
| 8:30 AM to 8:59 AM | 72 (6.3%) | 181 (11.4%) |
| 9:00 AM to 9:59 AM | 26 (2.3%) | 54 (3.4%) |
| 10:00 AM to 10:59 AM | 78 (6.9%) | 28 (1.8%) |
| 11:00 AM to 11:59 AM | 0 (0.0%) | 5 (0.3%) |
| 12:00 PM to 3:59 PM | 77 (6.8%) | 36 (2.3%) |
| 4:00 PM to 11:59 PM | 113 (9.9%) | 79 (5.0%) |
| Total | 1,138 (100.0%) | 1,585 (100.0%) |
Housing Occupancy in Hartsville
Occupancy by Ownership in Hartsville
Of the total 2,756 dwellings in Hartsville, owner-occupied units account for 1,616 (58.6%), while renter-occupied units make up 1,140 (41.4%).
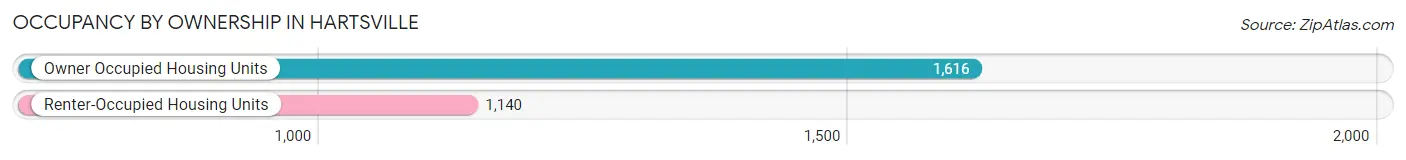
| Occupancy | # Housing Units | % Housing Units |
| Owner Occupied Housing Units | 1,616 | 58.6% |
| Renter-Occupied Housing Units | 1,140 | 41.4% |
| Total Occupied Housing Units | 2,756 | 100.0% |
Occupancy by Household Size in Hartsville
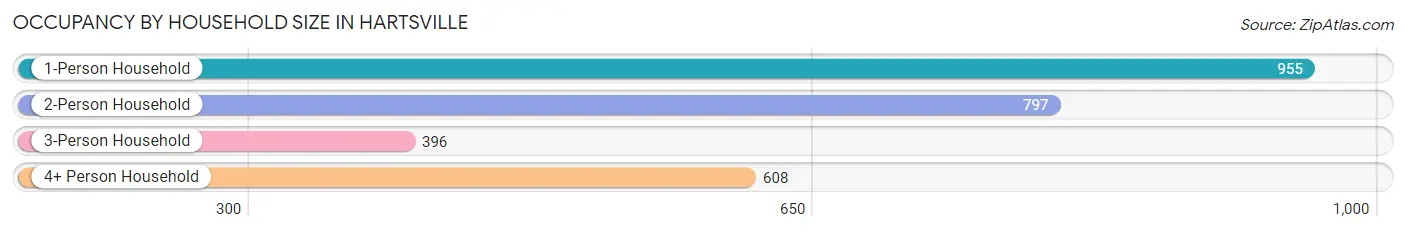
| Household Size | # Housing Units | % Housing Units |
| 1-Person Household | 955 | 34.6% |
| 2-Person Household | 797 | 28.9% |
| 3-Person Household | 396 | 14.4% |
| 4+ Person Household | 608 | 22.1% |
| Total Housing Units | 2,756 | 100.0% |
Occupancy by Ownership by Household Size in Hartsville
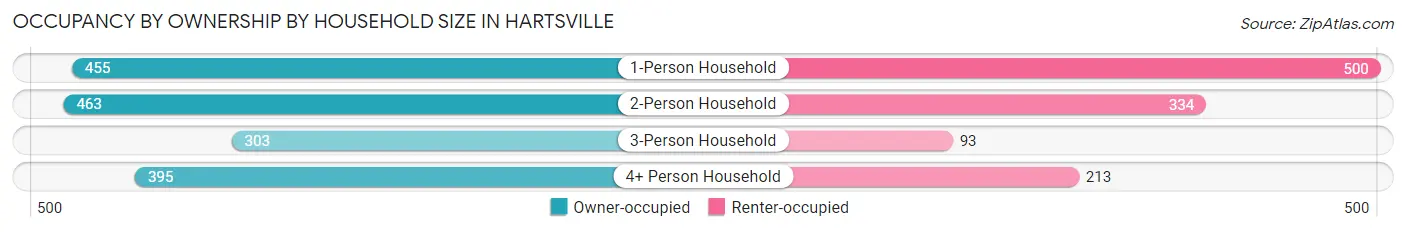
| Household Size | Owner-occupied | Renter-occupied |
| 1-Person Household | 455 (47.6%) | 500 (52.4%) |
| 2-Person Household | 463 (58.1%) | 334 (41.9%) |
| 3-Person Household | 303 (76.5%) | 93 (23.5%) |
| 4+ Person Household | 395 (65.0%) | 213 (35.0%) |
| Total Housing Units | 1,616 (58.6%) | 1,140 (41.4%) |
Occupancy by Educational Attainment in Hartsville
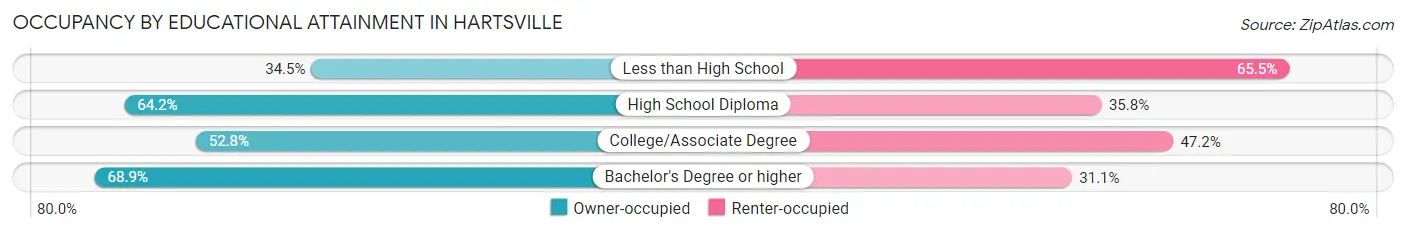
| Household Size | Owner-occupied | Renter-occupied |
| Less than High School | 116 (34.5%) | 220 (65.5%) |
| High School Diploma | 541 (64.2%) | 302 (35.8%) |
| College/Associate Degree | 419 (52.8%) | 374 (47.2%) |
| Bachelor's Degree or higher | 540 (68.9%) | 244 (31.1%) |
Occupancy by Age of Householder in Hartsville
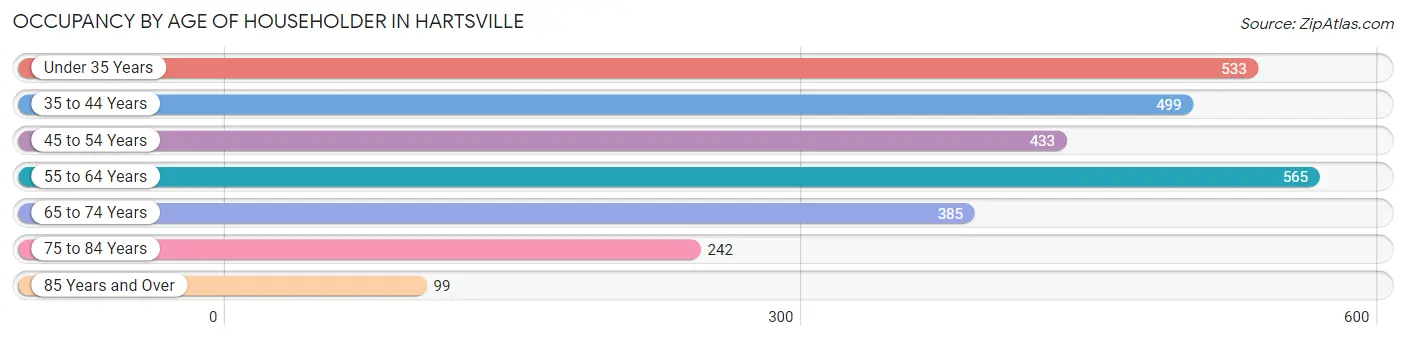
| Age Bracket | # Households | % Households |
| Under 35 Years | 533 | 19.3% |
| 35 to 44 Years | 499 | 18.1% |
| 45 to 54 Years | 433 | 15.7% |
| 55 to 64 Years | 565 | 20.5% |
| 65 to 74 Years | 385 | 14.0% |
| 75 to 84 Years | 242 | 8.8% |
| 85 Years and Over | 99 | 3.6% |
| Total | 2,756 | 100.0% |
Housing Finances in Hartsville
Median Income by Occupancy in Hartsville
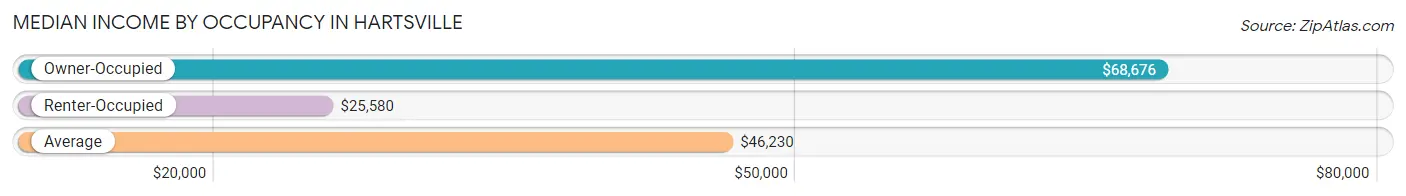
| Occupancy Type | # Households | Median Income |
| Owner-Occupied | 1,616 (58.6%) | $68,676 |
| Renter-Occupied | 1,140 (41.4%) | $25,580 |
| Average | 2,756 (100.0%) | $46,230 |
Occupancy by Householder Income Bracket in Hartsville
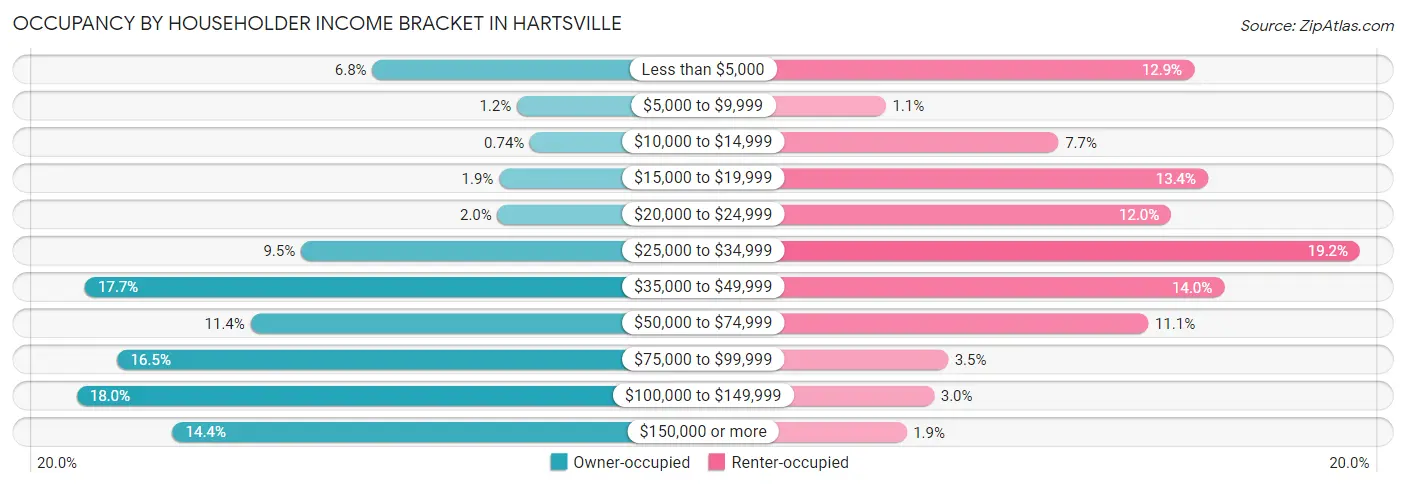
| Income Bracket | Owner-occupied | Renter-occupied |
| Less than $5,000 | 109 (6.8%) | 147 (12.9%) |
| $5,000 to $9,999 | 20 (1.2%) | 13 (1.1%) |
| $10,000 to $14,999 | 12 (0.7%) | 88 (7.7%) |
| $15,000 to $19,999 | 31 (1.9%) | 153 (13.4%) |
| $20,000 to $24,999 | 32 (2.0%) | 137 (12.0%) |
| $25,000 to $34,999 | 153 (9.5%) | 219 (19.2%) |
| $35,000 to $49,999 | 286 (17.7%) | 160 (14.0%) |
| $50,000 to $74,999 | 184 (11.4%) | 127 (11.1%) |
| $75,000 to $99,999 | 266 (16.5%) | 40 (3.5%) |
| $100,000 to $149,999 | 291 (18.0%) | 34 (3.0%) |
| $150,000 or more | 232 (14.4%) | 22 (1.9%) |
| Total | 1,616 (100.0%) | 1,140 (100.0%) |
Monthly Housing Cost Tiers in Hartsville
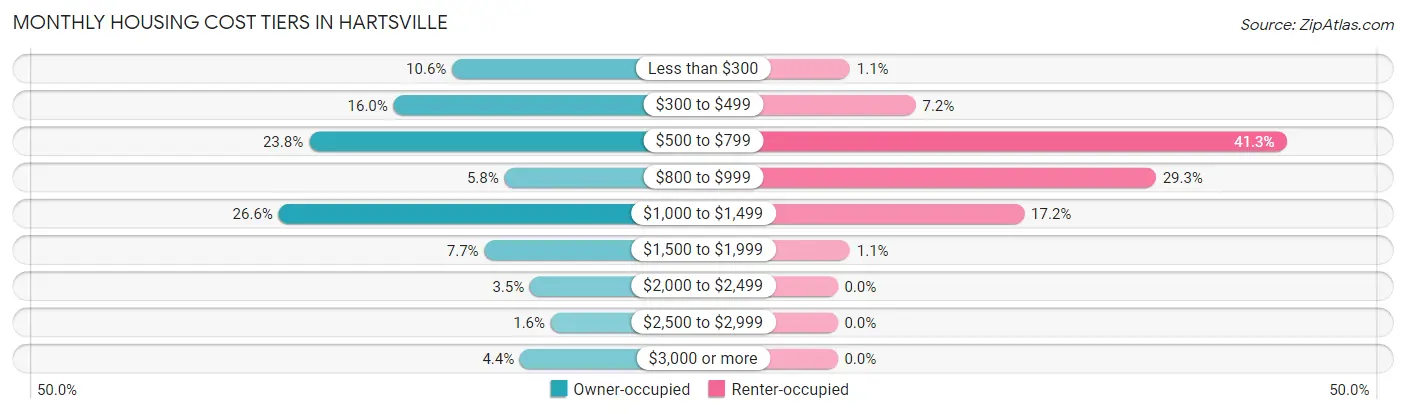
| Monthly Cost | Owner-occupied | Renter-occupied |
| Less than $300 | 172 (10.6%) | 13 (1.1%) |
| $300 to $499 | 259 (16.0%) | 82 (7.2%) |
| $500 to $799 | 385 (23.8%) | 471 (41.3%) |
| $800 to $999 | 94 (5.8%) | 334 (29.3%) |
| $1,000 to $1,499 | 430 (26.6%) | 196 (17.2%) |
| $1,500 to $1,999 | 124 (7.7%) | 13 (1.1%) |
| $2,000 to $2,499 | 56 (3.5%) | 0 (0.0%) |
| $2,500 to $2,999 | 25 (1.5%) | 0 (0.0%) |
| $3,000 or more | 71 (4.4%) | 0 (0.0%) |
| Total | 1,616 (100.0%) | 1,140 (100.0%) |
Physical Housing Characteristics in Hartsville
Housing Structures in Hartsville
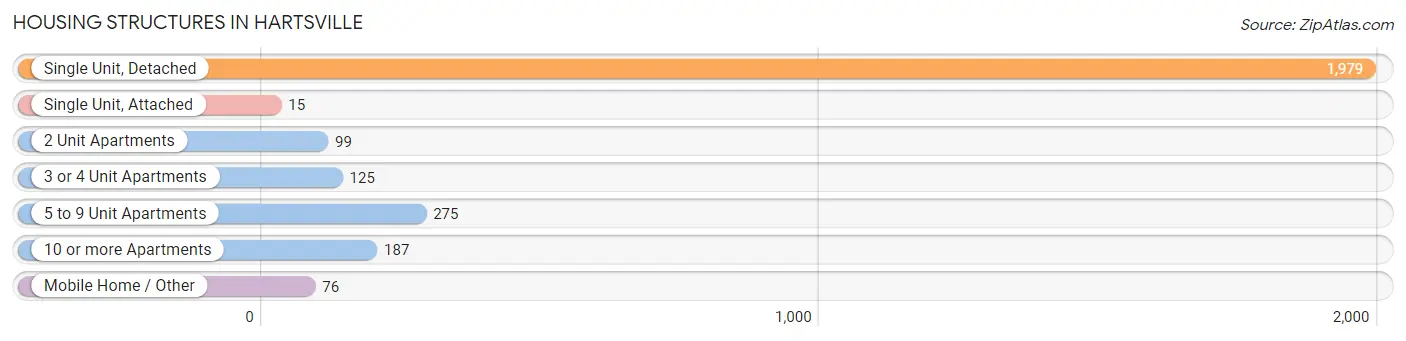
| Structure Type | # Housing Units | % Housing Units |
| Single Unit, Detached | 1,979 | 71.8% |
| Single Unit, Attached | 15 | 0.5% |
| 2 Unit Apartments | 99 | 3.6% |
| 3 or 4 Unit Apartments | 125 | 4.5% |
| 5 to 9 Unit Apartments | 275 | 10.0% |
| 10 or more Apartments | 187 | 6.8% |
| Mobile Home / Other | 76 | 2.8% |
| Total | 2,756 | 100.0% |
Housing Structures by Occupancy in Hartsville
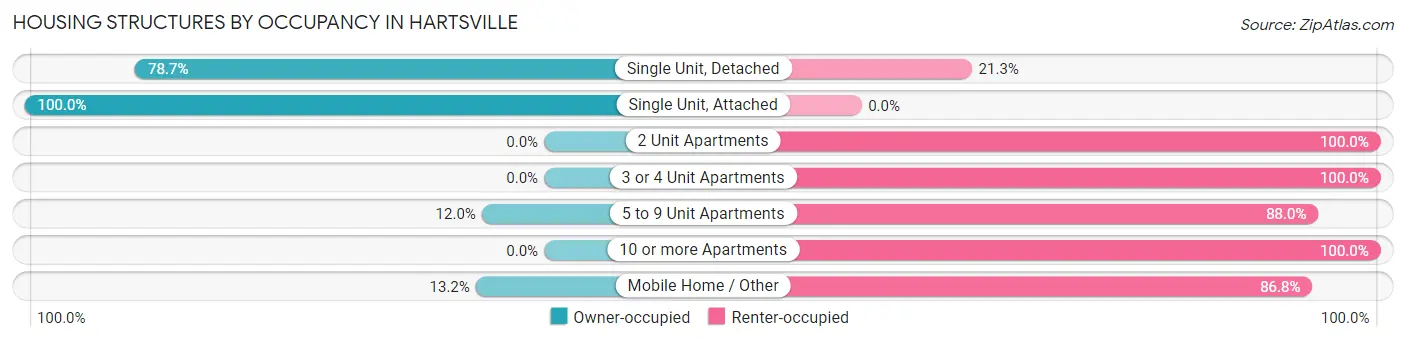
| Structure Type | Owner-occupied | Renter-occupied |
| Single Unit, Detached | 1,558 (78.7%) | 421 (21.3%) |
| Single Unit, Attached | 15 (100.0%) | 0 (0.0%) |
| 2 Unit Apartments | 0 (0.0%) | 99 (100.0%) |
| 3 or 4 Unit Apartments | 0 (0.0%) | 125 (100.0%) |
| 5 to 9 Unit Apartments | 33 (12.0%) | 242 (88.0%) |
| 10 or more Apartments | 0 (0.0%) | 187 (100.0%) |
| Mobile Home / Other | 10 (13.2%) | 66 (86.8%) |
| Total | 1,616 (58.6%) | 1,140 (41.4%) |
Housing Structures by Number of Rooms in Hartsville
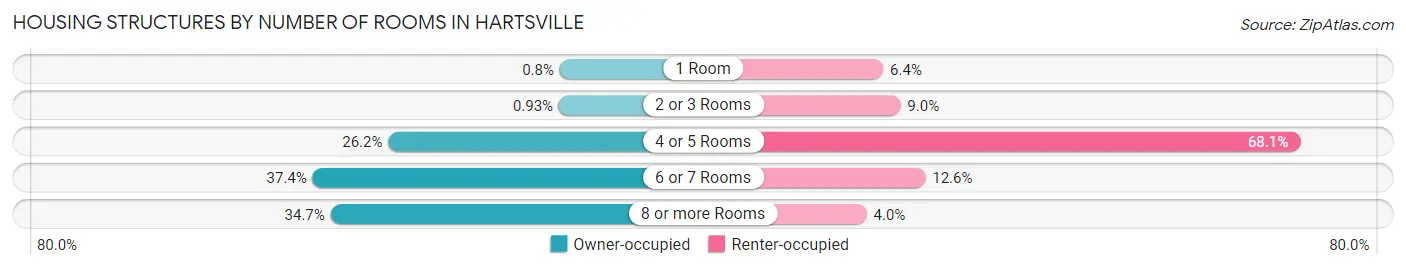
| Number of Rooms | Owner-occupied | Renter-occupied |
| 1 Room | 13 (0.8%) | 73 (6.4%) |
| 2 or 3 Rooms | 15 (0.9%) | 102 (8.9%) |
| 4 or 5 Rooms | 423 (26.2%) | 776 (68.1%) |
| 6 or 7 Rooms | 604 (37.4%) | 144 (12.6%) |
| 8 or more Rooms | 561 (34.7%) | 45 (4.0%) |
| Total | 1,616 (100.0%) | 1,140 (100.0%) |
Housing Structure by Heating Type in Hartsville
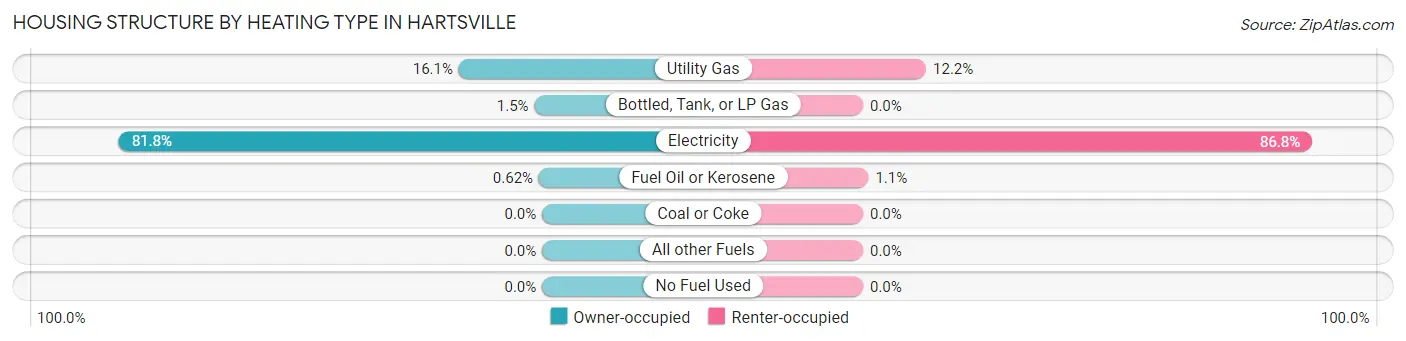
| Heating Type | Owner-occupied | Renter-occupied |
| Utility Gas | 260 (16.1%) | 139 (12.2%) |
| Bottled, Tank, or LP Gas | 24 (1.5%) | 0 (0.0%) |
| Electricity | 1,322 (81.8%) | 989 (86.8%) |
| Fuel Oil or Kerosene | 10 (0.6%) | 12 (1.1%) |
| Coal or Coke | 0 (0.0%) | 0 (0.0%) |
| All other Fuels | 0 (0.0%) | 0 (0.0%) |
| No Fuel Used | 0 (0.0%) | 0 (0.0%) |
| Total | 1,616 (100.0%) | 1,140 (100.0%) |
Household Vehicle Usage in Hartsville
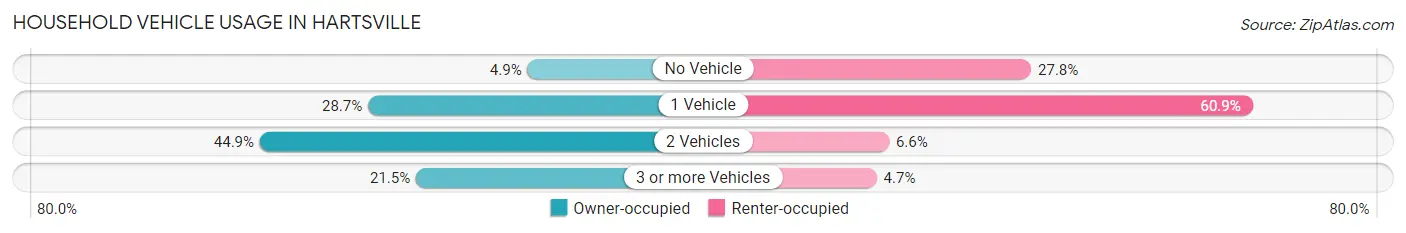
| Vehicles per Household | Owner-occupied | Renter-occupied |
| No Vehicle | 79 (4.9%) | 317 (27.8%) |
| 1 Vehicle | 464 (28.7%) | 694 (60.9%) |
| 2 Vehicles | 725 (44.9%) | 75 (6.6%) |
| 3 or more Vehicles | 348 (21.5%) | 54 (4.7%) |
| Total | 1,616 (100.0%) | 1,140 (100.0%) |
Real Estate & Mortgages in Hartsville
Real Estate and Mortgage Overview in Hartsville
| Characteristic | Without Mortgage | With Mortgage |
| Housing Units | 656 | 960 |
| Median Property Value | $128,600 | $191,300 |
| Median Household Income | $50,326 | $166 |
| Monthly Housing Costs | $423 | $66 |
| Real Estate Taxes | $661 | $54 |
Property Value by Mortgage Status in Hartsville
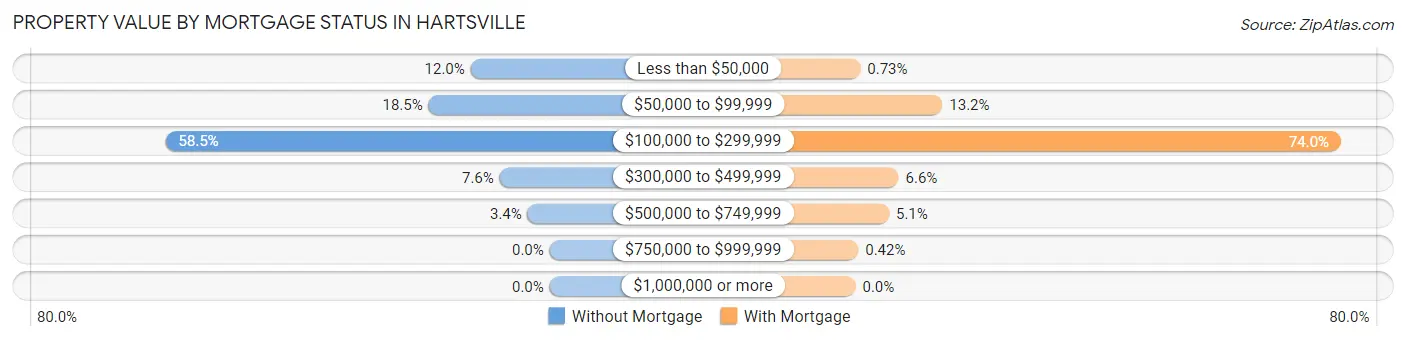
| Property Value | Without Mortgage | With Mortgage |
| Less than $50,000 | 79 (12.0%) | 7 (0.7%) |
| $50,000 to $99,999 | 121 (18.4%) | 127 (13.2%) |
| $100,000 to $299,999 | 384 (58.5%) | 710 (74.0%) |
| $300,000 to $499,999 | 50 (7.6%) | 63 (6.6%) |
| $500,000 to $749,999 | 22 (3.4%) | 49 (5.1%) |
| $750,000 to $999,999 | 0 (0.0%) | 4 (0.4%) |
| $1,000,000 or more | 0 (0.0%) | 0 (0.0%) |
| Total | 656 (100.0%) | 960 (100.0%) |
Household Income by Mortgage Status in Hartsville
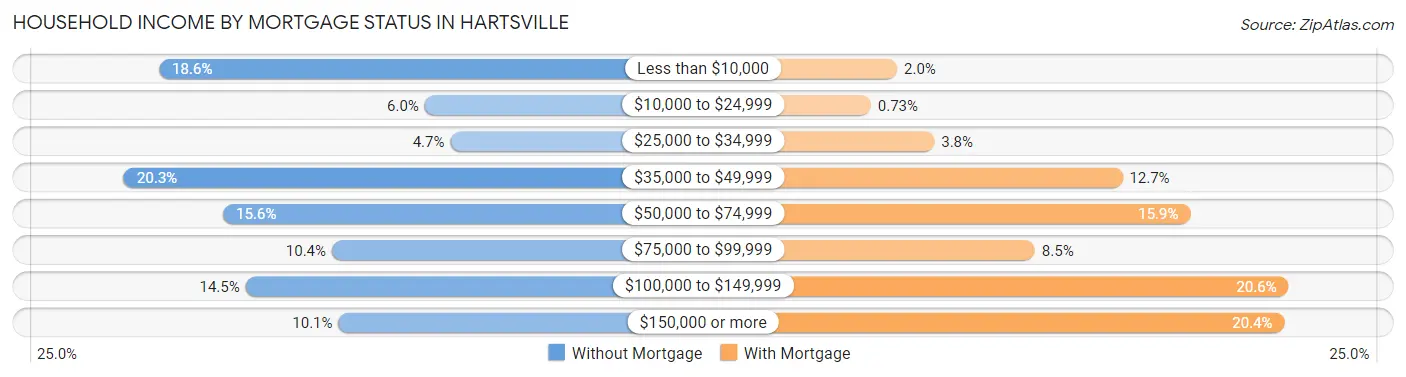
| Household Income | Without Mortgage | With Mortgage |
| Less than $10,000 | 122 (18.6%) | 19 (2.0%) |
| $10,000 to $24,999 | 39 (5.9%) | 7 (0.7%) |
| $25,000 to $34,999 | 31 (4.7%) | 36 (3.7%) |
| $35,000 to $49,999 | 133 (20.3%) | 122 (12.7%) |
| $50,000 to $74,999 | 102 (15.5%) | 153 (15.9%) |
| $75,000 to $99,999 | 68 (10.4%) | 82 (8.5%) |
| $100,000 to $149,999 | 95 (14.5%) | 198 (20.6%) |
| $150,000 or more | 66 (10.1%) | 196 (20.4%) |
| Total | 656 (100.0%) | 960 (100.0%) |
Property Value to Household Income Ratio in Hartsville
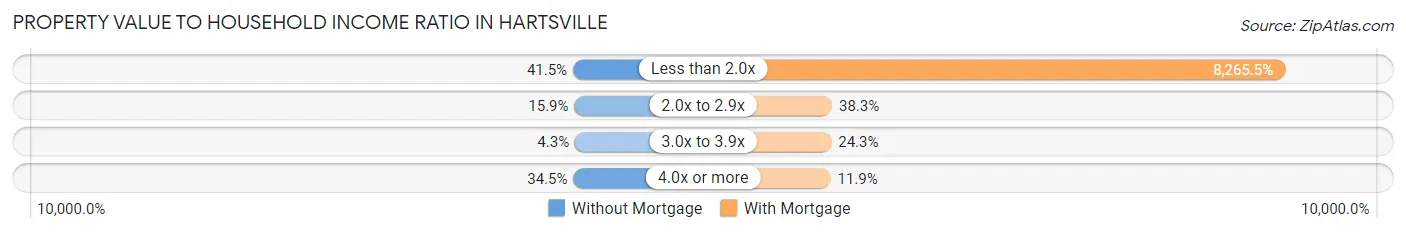
| Value-to-Income Ratio | Without Mortgage | With Mortgage |
| Less than 2.0x | 272 (41.5%) | 79,349 (8,265.5%) |
| 2.0x to 2.9x | 104 (15.9%) | 368 (38.3%) |
| 3.0x to 3.9x | 28 (4.3%) | 233 (24.3%) |
| 4.0x or more | 226 (34.4%) | 114 (11.9%) |
| Total | 656 (100.0%) | 960 (100.0%) |
Real Estate Taxes by Mortgage Status in Hartsville
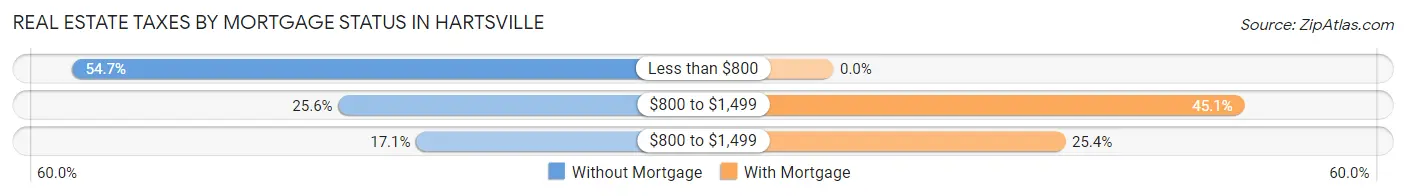
| Property Taxes | Without Mortgage | With Mortgage |
| Less than $800 | 359 (54.7%) | 0 (0.0%) |
| $800 to $1,499 | 168 (25.6%) | 433 (45.1%) |
| $800 to $1,499 | 112 (17.1%) | 244 (25.4%) |
| Total | 656 (100.0%) | 960 (100.0%) |
Health & Disability in Hartsville
Health Insurance Coverage by Age in Hartsville
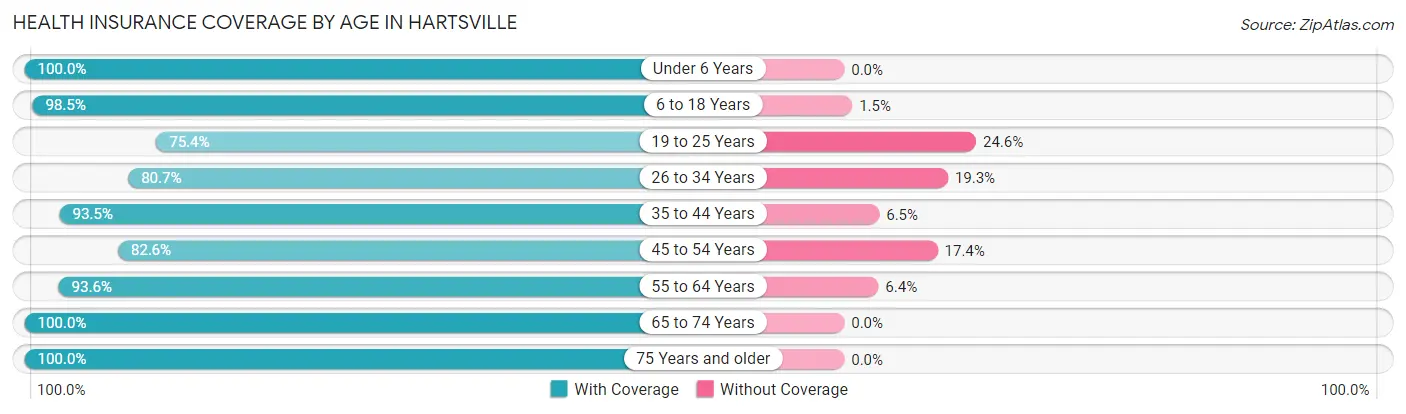
| Age Bracket | With Coverage | Without Coverage |
| Under 6 Years | 652 (100.0%) | 0 (0.0%) |
| 6 to 18 Years | 1,863 (98.5%) | 28 (1.5%) |
| 19 to 25 Years | 611 (75.4%) | 199 (24.6%) |
| 26 to 34 Years | 605 (80.7%) | 145 (19.3%) |
| 35 to 44 Years | 687 (93.5%) | 48 (6.5%) |
| 45 to 54 Years | 655 (82.6%) | 138 (17.4%) |
| 55 to 64 Years | 736 (93.6%) | 50 (6.4%) |
| 65 to 74 Years | 613 (100.0%) | 0 (0.0%) |
| 75 Years and older | 415 (100.0%) | 0 (0.0%) |
| Total | 6,837 (91.8%) | 608 (8.2%) |
Health Insurance Coverage by Citizenship Status in Hartsville
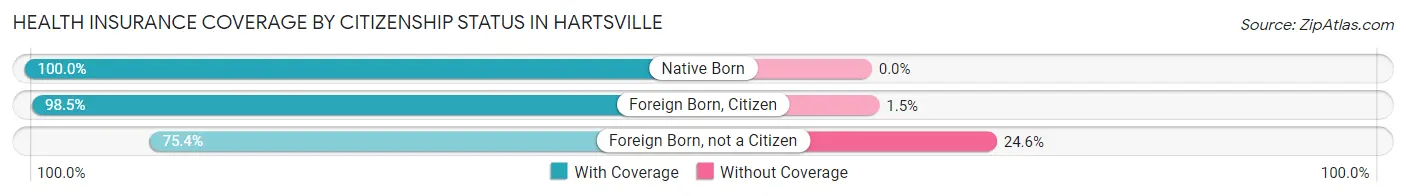
| Citizenship Status | With Coverage | Without Coverage |
| Native Born | 652 (100.0%) | 0 (0.0%) |
| Foreign Born, Citizen | 1,863 (98.5%) | 28 (1.5%) |
| Foreign Born, not a Citizen | 611 (75.4%) | 199 (24.6%) |
Health Insurance Coverage by Household Income in Hartsville
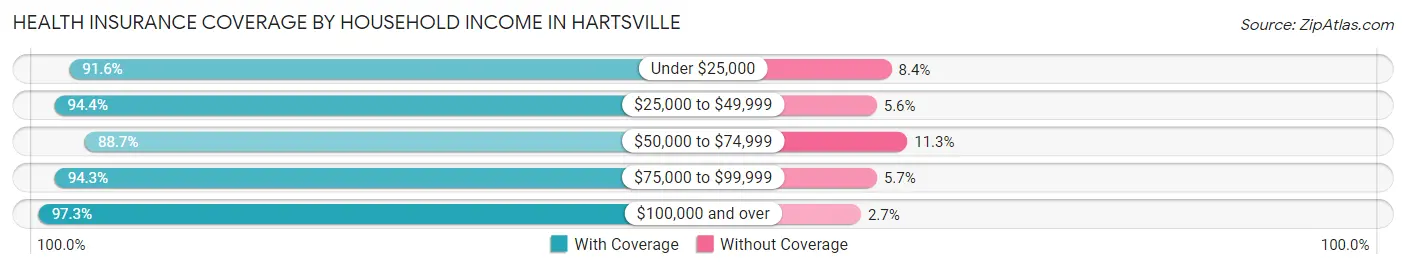
| Household Income | With Coverage | Without Coverage |
| Under $25,000 | 1,504 (91.6%) | 138 (8.4%) |
| $25,000 to $49,999 | 1,661 (94.4%) | 99 (5.6%) |
| $50,000 to $74,999 | 579 (88.7%) | 74 (11.3%) |
| $75,000 to $99,999 | 1,033 (94.3%) | 62 (5.7%) |
| $100,000 and over | 1,610 (97.3%) | 44 (2.7%) |
Public vs Private Health Insurance Coverage by Age in Hartsville
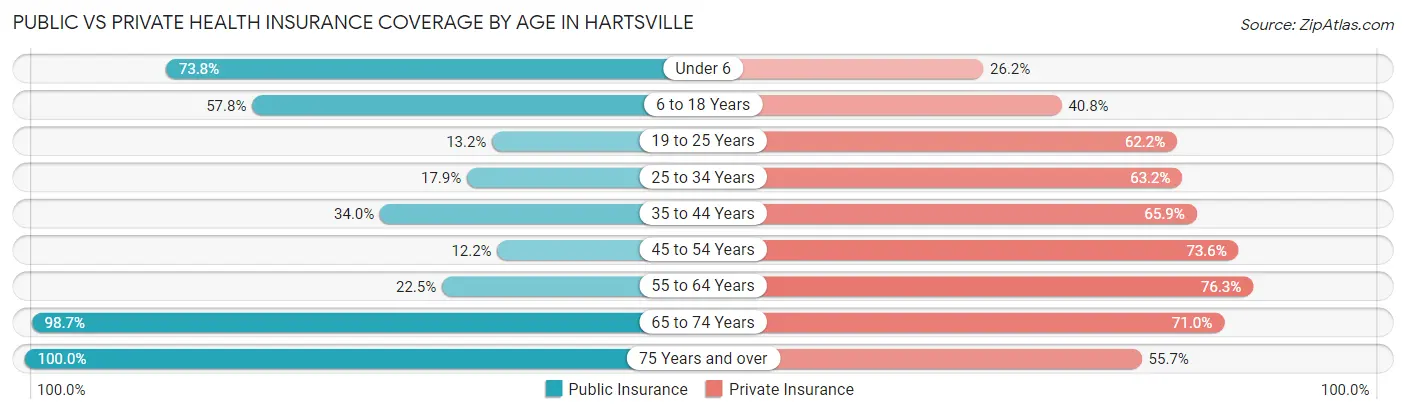
| Age Bracket | Public Insurance | Private Insurance |
| Under 6 | 481 (73.8%) | 171 (26.2%) |
| 6 to 18 Years | 1,092 (57.8%) | 771 (40.8%) |
| 19 to 25 Years | 107 (13.2%) | 504 (62.2%) |
| 25 to 34 Years | 134 (17.9%) | 474 (63.2%) |
| 35 to 44 Years | 250 (34.0%) | 484 (65.8%) |
| 45 to 54 Years | 97 (12.2%) | 584 (73.6%) |
| 55 to 64 Years | 177 (22.5%) | 600 (76.3%) |
| 65 to 74 Years | 605 (98.7%) | 435 (71.0%) |
| 75 Years and over | 415 (100.0%) | 231 (55.7%) |
| Total | 3,358 (45.1%) | 4,254 (57.1%) |
Disability Status by Sex by Age in Hartsville
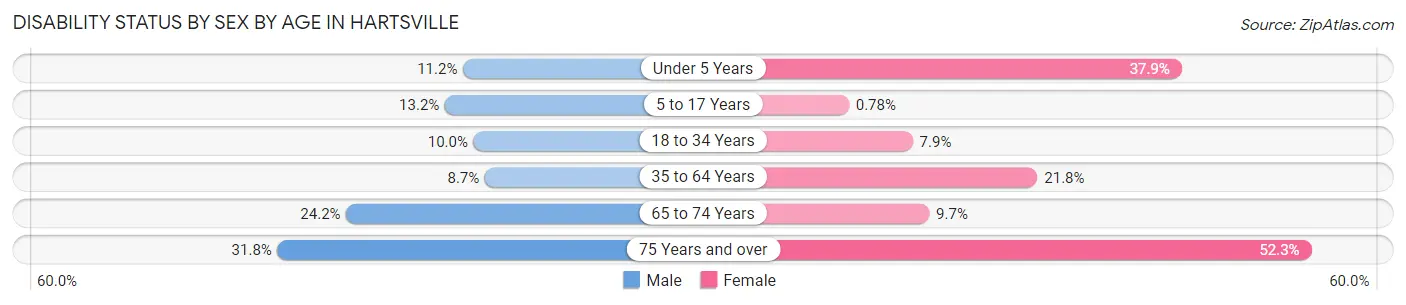
| Age Bracket | Male | Female |
| Under 5 Years | 36 (11.2%) | 95 (37.9%) |
| 5 to 17 Years | 125 (13.2%) | 6 (0.8%) |
| 18 to 34 Years | 72 (10.0%) | 86 (7.9%) |
| 35 to 64 Years | 86 (8.7%) | 289 (21.8%) |
| 65 to 74 Years | 86 (24.2%) | 25 (9.7%) |
| 75 Years and over | 42 (31.8%) | 148 (52.3%) |
Disability Class by Sex by Age in Hartsville
Disability Class: Hearing Difficulty
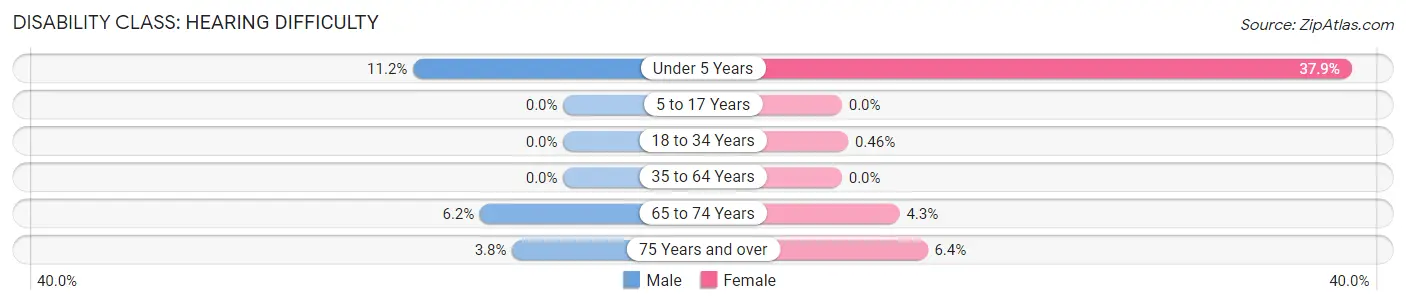
| Age Bracket | Male | Female |
| Under 5 Years | 36 (11.2%) | 95 (37.9%) |
| 5 to 17 Years | 0 (0.0%) | 0 (0.0%) |
| 18 to 34 Years | 0 (0.0%) | 5 (0.5%) |
| 35 to 64 Years | 0 (0.0%) | 0 (0.0%) |
| 65 to 74 Years | 22 (6.2%) | 11 (4.3%) |
| 75 Years and over | 5 (3.8%) | 18 (6.4%) |
Disability Class: Vision Difficulty
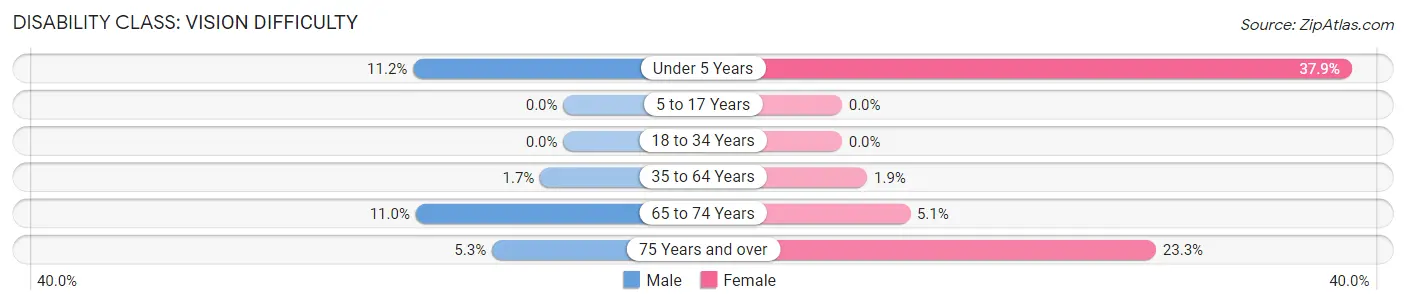
| Age Bracket | Male | Female |
| Under 5 Years | 36 (11.2%) | 95 (37.9%) |
| 5 to 17 Years | 0 (0.0%) | 0 (0.0%) |
| 18 to 34 Years | 0 (0.0%) | 0 (0.0%) |
| 35 to 64 Years | 17 (1.7%) | 25 (1.9%) |
| 65 to 74 Years | 39 (11.0%) | 13 (5.1%) |
| 75 Years and over | 7 (5.3%) | 66 (23.3%) |
Disability Class: Cognitive Difficulty
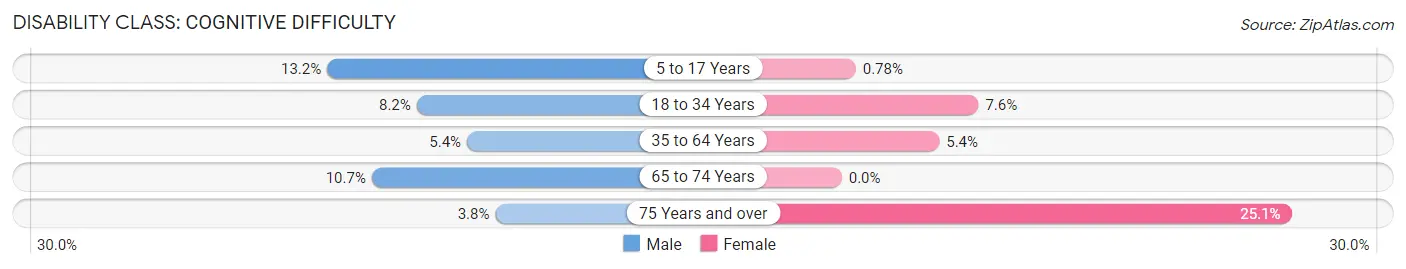
| Age Bracket | Male | Female |
| 5 to 17 Years | 125 (13.2%) | 6 (0.8%) |
| 18 to 34 Years | 59 (8.2%) | 83 (7.6%) |
| 35 to 64 Years | 53 (5.4%) | 72 (5.4%) |
| 65 to 74 Years | 38 (10.7%) | 0 (0.0%) |
| 75 Years and over | 5 (3.8%) | 71 (25.1%) |
Disability Class: Ambulatory Difficulty
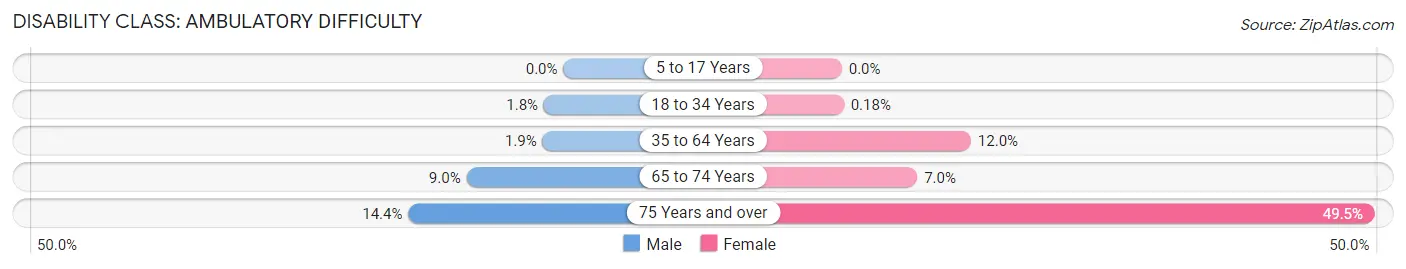
| Age Bracket | Male | Female |
| 5 to 17 Years | 0 (0.0%) | 0 (0.0%) |
| 18 to 34 Years | 13 (1.8%) | 2 (0.2%) |
| 35 to 64 Years | 19 (1.9%) | 159 (12.0%) |
| 65 to 74 Years | 32 (9.0%) | 18 (7.0%) |
| 75 Years and over | 19 (14.4%) | 140 (49.5%) |
Disability Class: Self-Care Difficulty
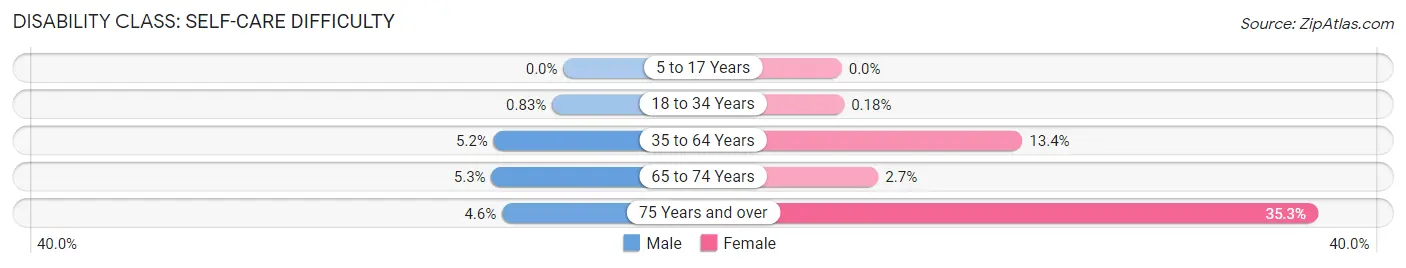
| Age Bracket | Male | Female |
| 5 to 17 Years | 0 (0.0%) | 0 (0.0%) |
| 18 to 34 Years | 6 (0.8%) | 2 (0.2%) |
| 35 to 64 Years | 51 (5.2%) | 178 (13.4%) |
| 65 to 74 Years | 19 (5.3%) | 7 (2.7%) |
| 75 Years and over | 6 (4.5%) | 100 (35.3%) |
Technology Access in Hartsville
Computing Device Access in Hartsville
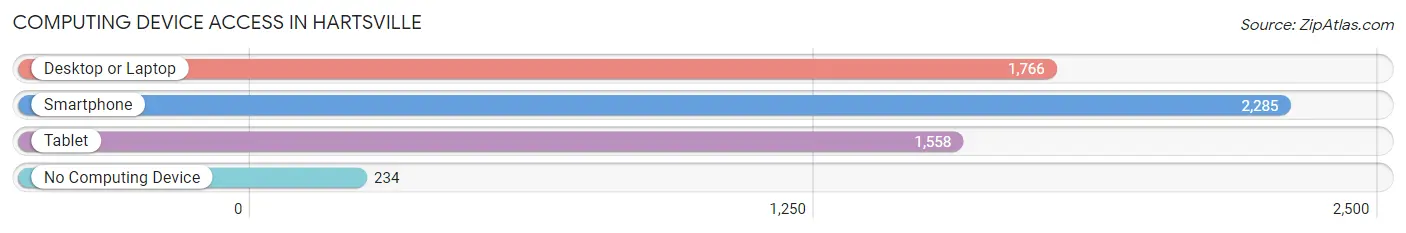
| Device Type | # Households | % Households |
| Desktop or Laptop | 1,766 | 64.1% |
| Smartphone | 2,285 | 82.9% |
| Tablet | 1,558 | 56.5% |
| No Computing Device | 234 | 8.5% |
| Total | 2,756 | 100.0% |
Internet Access in Hartsville
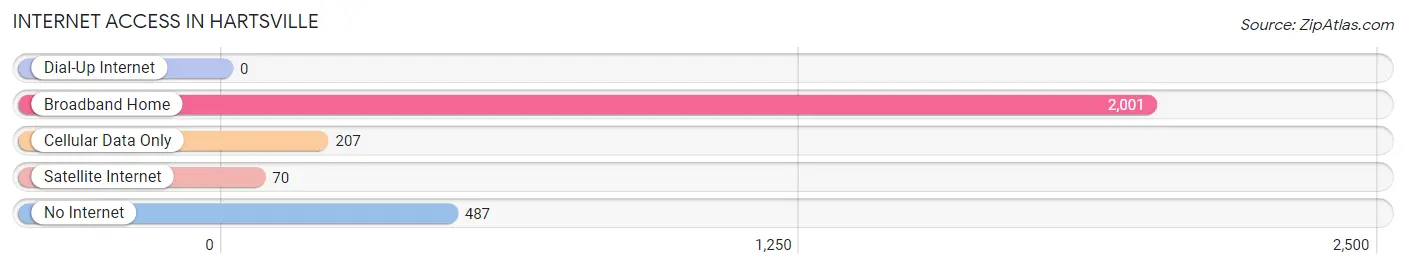
| Internet Type | # Households | % Households |
| Dial-Up Internet | 0 | 0.0% |
| Broadband Home | 2,001 | 72.6% |
| Cellular Data Only | 207 | 7.5% |
| Satellite Internet | 70 | 2.5% |
| No Internet | 487 | 17.7% |
| Total | 2,756 | 100.0% |
Hartsville Summary
Hartsville, South Carolina is a small town located in the Pee Dee region of the state. It is the county seat of Darlington County and is located about halfway between Florence and Myrtle Beach. The population of Hartsville was 7,764 at the 2010 census.
History
Hartsville was founded in 1817 by William Hart, a Revolutionary War veteran. Hart purchased the land from the local Native Americans and named the town after himself. The town was incorporated in 1819 and quickly became a center of commerce and industry. The town was home to several cotton mills, a railroad, and a variety of other businesses.
In the late 19th century, Hartsville was a major center of the tobacco industry. The town was home to several tobacco warehouses and factories, and the town was known as the “Tobacco Capital of the South.” The tobacco industry declined in the early 20th century, but the town remained an important center of commerce and industry.
Geography
Hartsville is located in the Pee Dee region of South Carolina, about halfway between Florence and Myrtle Beach. The town is situated on the banks of the Great Pee Dee River, and is surrounded by rolling hills and farmland. The town is located in the heart of the Pee Dee National Forest, and is home to several state parks and recreational areas.
Economy
Hartsville’s economy is largely based on agriculture and manufacturing. The town is home to several large agricultural operations, including poultry, beef, and dairy farms. The town is also home to several manufacturing companies, including Sonoco Products Company, which produces paper and packaging products.
The town is also home to several educational institutions, including Coker College, a private liberal arts college, and Hartsville High School. The town is also home to several medical facilities, including a hospital and several clinics.
Demographics
As of the 2010 census, the population of Hartsville was 7,764. The racial makeup of the town was 68.3% White, 28.2% African American, 0.3% Native American, 0.7% Asian, 0.1% Pacific Islander, 0.7% from other races, and 1.9% from two or more races. Hispanic or Latino of any race were 2.2% of the population.
The median income for a household in Hartsville was $31,945, and the median income for a family was $41,945. The per capita income for the town was $17,845. About 17.2% of families and 21.2% of the population were below the poverty line, including 28.2% of those under age 18 and 16.2% of those age 65 or over.
Hartsville is a small town with a rich history and a vibrant economy. The town is home to several agricultural and manufacturing operations, as well as several educational and medical facilities. The town has a diverse population, with a mix of races and ethnicities. The town is a great place to live, work, and raise a family.
Common Questions
What is Per Capita Income in Hartsville?
Per Capita income in Hartsville is $25,911.
What is the Median Family Income in Hartsville?
Median Family Income in Hartsville is $58,542.
What is the Median Household income in Hartsville?
Median Household Income in Hartsville is $46,230.
What is Income or Wage Gap in Hartsville?
Income or Wage Gap in Hartsville is 27.3%.
Women in Hartsville earn 72.7 cents for every dollar earned by a man.
What is Inequality or Gini Index in Hartsville?
Inequality or Gini Index in Hartsville is 0.51.
What is the Total Population of Hartsville?
Total Population of Hartsville is 7,450.
What is the Total Male Population of Hartsville?
Total Male Population of Hartsville is 3,475.
What is the Total Female Population of Hartsville?
Total Female Population of Hartsville is 3,975.
What is the Ratio of Males per 100 Females in Hartsville?
There are 87.42 Males per 100 Females in Hartsville.
What is the Ratio of Females per 100 Males in Hartsville?
There are 114.39 Females per 100 Males in Hartsville.
What is the Median Population Age in Hartsville?
Median Population Age in Hartsville is 29.8 Years.
What is the Average Family Size in Hartsville
Average Family Size in Hartsville is 3.2 People.
What is the Average Household Size in Hartsville
Average Household Size in Hartsville is 2.5 People.
How Large is the Labor Force in Hartsville?
There are 3,118 People in the Labor Forcein in Hartsville.
What is the Percentage of People in the Labor Force in Hartsville?
58.6% of People are in the Labor Force in Hartsville.
What is the Unemployment Rate in Hartsville?
Unemployment Rate in Hartsville is 9.2%.