Reidville, SC Map & Demographics
Reidville Map
Reidville Overview
$40,210
PER CAPITA INCOME
$124,167
AVG FAMILY INCOME
$115,972
AVG HOUSEHOLD INCOME
28.6%
WAGE / INCOME GAP [ % ]
71.4¢/ $1
WAGE / INCOME GAP [ $ ]
0.32
INEQUALITY / GINI INDEX
1,734
TOTAL POPULATION
820
MALE POPULATION
914
FEMALE POPULATION
89.72
MALES / 100 FEMALES
111.46
FEMALES / 100 MALES
34.0
MEDIAN AGE
3.5
AVG FAMILY SIZE
3.2
AVG HOUSEHOLD SIZE
974
LABOR FORCE [ PEOPLE ]
78.8%
PERCENT IN LABOR FORCE
4.5%
UNEMPLOYMENT RATE
Reidville Zip Codes
Reidville Area Codes
Income in Reidville
Income Overview in Reidville
Per Capita Income in Reidville is $40,210, while median incomes of families and households are $124,167 and $115,972 respectively.
| Characteristic | Number | Measure |
| Per Capita Income | 1,734 | $40,210 |
| Median Family Income | 460 | $124,167 |
| Mean Family Income | 460 | $128,279 |
| Median Household Income | 545 | $115,972 |
| Mean Household Income | 545 | $122,462 |
| Income Deficit | 460 | $0 |
| Wage / Income Gap (%) | 1,734 | 28.57% |
| Wage / Income Gap ($) | 1,734 | 71.43¢ per $1 |
| Gini / Inequality Index | 1,734 | 0.32 |
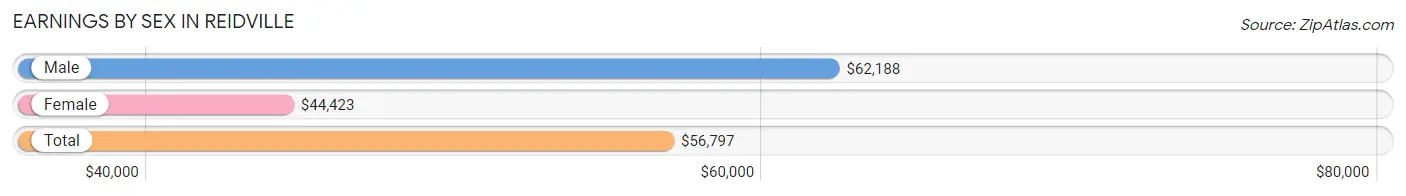
Earnings by Sex in Reidville
Average Earnings in Reidville are $56,797, $62,188 for men and $44,423 for women, a difference of 28.6%.
| Sex | Number | Average Earnings |
| Male | 531 (53.4%) | $62,188 |
| Female | 464 (46.6%) | $44,423 |
| Total | 995 (100.0%) | $56,797 |
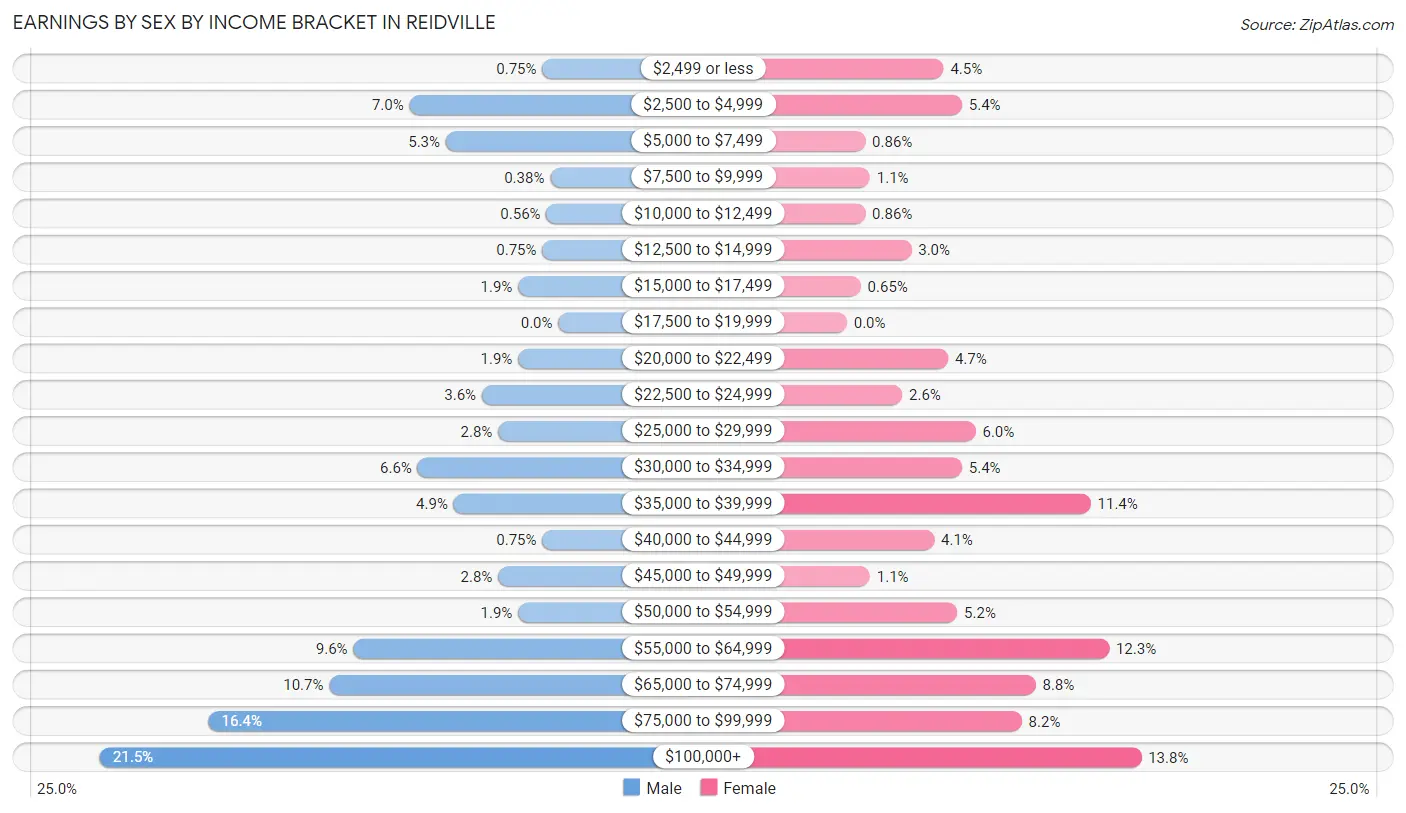
Earnings by Sex by Income Bracket in Reidville
The most common earnings brackets in Reidville are $100,000+ for men (114 | 21.5%) and $100,000+ for women (64 | 13.8%).
| Income | Male | Female |
| $2,499 or less | 4 (0.7%) | 21 (4.5%) |
| $2,500 to $4,999 | 37 (7.0%) | 25 (5.4%) |
| $5,000 to $7,499 | 28 (5.3%) | 4 (0.9%) |
| $7,500 to $9,999 | 2 (0.4%) | 5 (1.1%) |
| $10,000 to $12,499 | 3 (0.6%) | 4 (0.9%) |
| $12,500 to $14,999 | 4 (0.7%) | 14 (3.0%) |
| $15,000 to $17,499 | 10 (1.9%) | 3 (0.6%) |
| $17,500 to $19,999 | 0 (0.0%) | 0 (0.0%) |
| $20,000 to $22,499 | 10 (1.9%) | 22 (4.7%) |
| $22,500 to $24,999 | 19 (3.6%) | 12 (2.6%) |
| $25,000 to $29,999 | 15 (2.8%) | 28 (6.0%) |
| $30,000 to $34,999 | 35 (6.6%) | 25 (5.4%) |
| $35,000 to $39,999 | 26 (4.9%) | 53 (11.4%) |
| $40,000 to $44,999 | 4 (0.7%) | 19 (4.1%) |
| $45,000 to $49,999 | 15 (2.8%) | 5 (1.1%) |
| $50,000 to $54,999 | 10 (1.9%) | 24 (5.2%) |
| $55,000 to $64,999 | 51 (9.6%) | 57 (12.3%) |
| $65,000 to $74,999 | 57 (10.7%) | 41 (8.8%) |
| $75,000 to $99,999 | 87 (16.4%) | 38 (8.2%) |
| $100,000+ | 114 (21.5%) | 64 (13.8%) |
| Total | 531 (100.0%) | 464 (100.0%) |
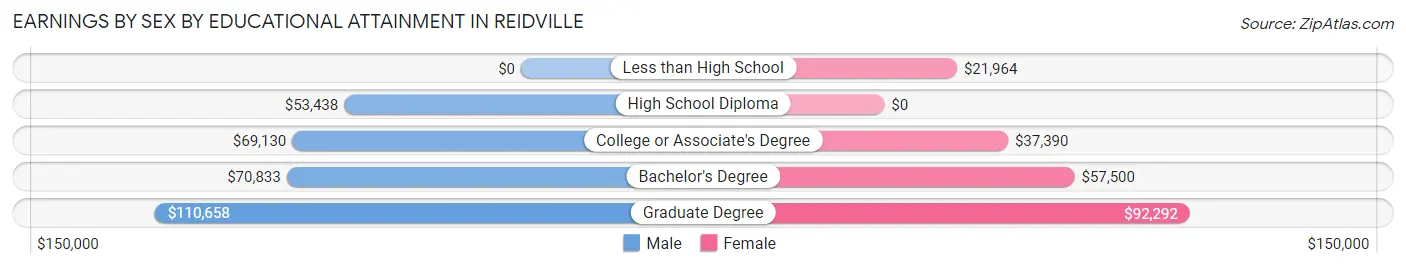
Earnings by Sex by Educational Attainment in Reidville
Average earnings in Reidville are $69,667 for men and $48,750 for women, a difference of 30.0%. Men with an educational attainment of graduate degree enjoy the highest average annual earnings of $110,658, while those with high school diploma education earn the least with $53,438. Women with an educational attainment of graduate degree earn the most with the average annual earnings of $92,292, while those with less than high school education have the smallest earnings of $21,964.
| Educational Attainment | Male Income | Female Income |
| Less than High School | - | - |
| High School Diploma | $53,438 | $0 |
| College or Associate's Degree | $69,130 | $37,390 |
| Bachelor's Degree | $70,833 | $57,500 |
| Graduate Degree | $110,658 | $92,292 |
| Total | $69,667 | $48,750 |
Family Income in Reidville
Family Income Brackets in Reidville
According to the Reidville family income data, there are 147 families falling into the $100,000 to $149,999 income range, which is the most common income bracket and makes up 32.0% of all families.
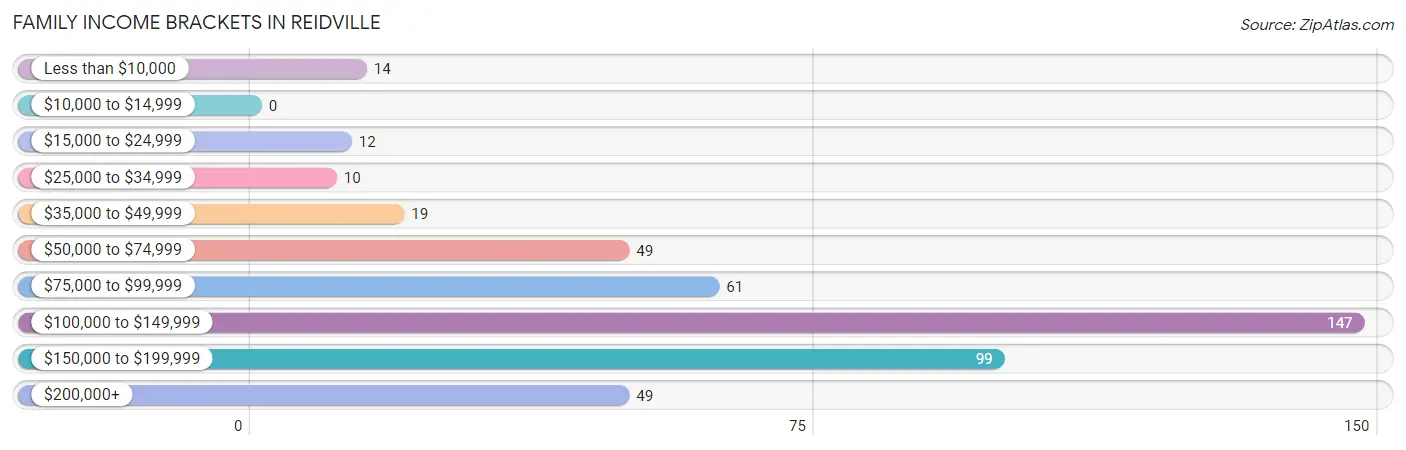
| Income Bracket | # Families | % Families |
| Less than $10,000 | 14 | 3.0% |
| $10,000 to $14,999 | 0 | 0.0% |
| $15,000 to $24,999 | 12 | 2.6% |
| $25,000 to $34,999 | 10 | 2.2% |
| $35,000 to $49,999 | 19 | 4.1% |
| $50,000 to $74,999 | 49 | 10.7% |
| $75,000 to $99,999 | 61 | 13.3% |
| $100,000 to $149,999 | 147 | 32.0% |
| $150,000 to $199,999 | 99 | 21.5% |
| $200,000+ | 49 | 10.7% |
Family Income by Famaliy Size in Reidville
6-person families (36 | 7.8%) account for the highest median family income in Reidville with $197,632 per family, while 2-person families (161 | 35.0%) have the highest median income of $58,403 per family member.
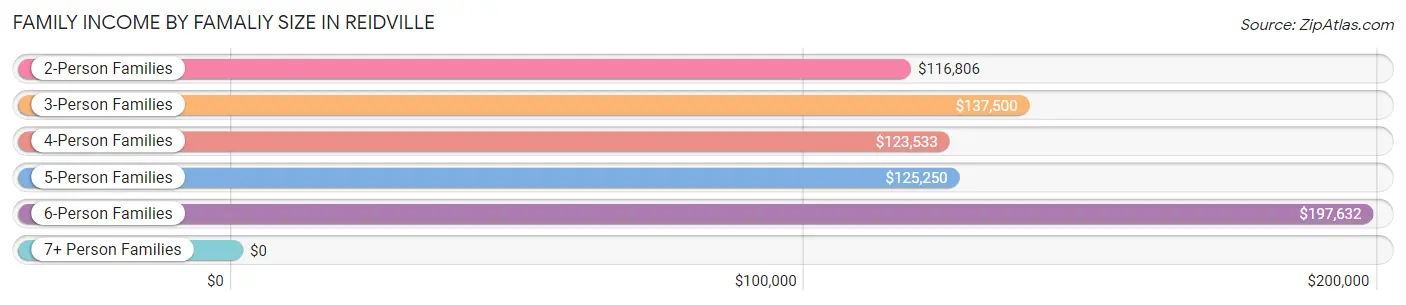
| Income Bracket | # Families | Median Income |
| 2-Person Families | 161 (35.0%) | $116,806 |
| 3-Person Families | 112 (24.3%) | $137,500 |
| 4-Person Families | 127 (27.6%) | $123,533 |
| 5-Person Families | 19 (4.1%) | $125,250 |
| 6-Person Families | 36 (7.8%) | $197,632 |
| 7+ Person Families | 5 (1.1%) | $0 |
| Total | 460 (100.0%) | $124,167 |
Family Income by Number of Earners in Reidville
The median family income in Reidville is $124,167, with families comprising 3+ earners (41) having the highest median family income of $164,531, while families with 1 earner (98) have the lowest median family income of $65,000, accounting for 8.9% and 21.3% of families, respectively.
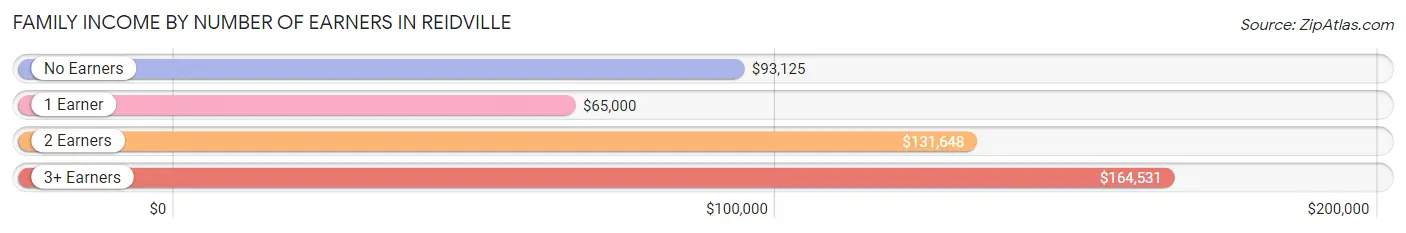
| Number of Earners | # Families | Median Income |
| No Earners | 28 (6.1%) | $93,125 |
| 1 Earner | 98 (21.3%) | $65,000 |
| 2 Earners | 293 (63.7%) | $131,648 |
| 3+ Earners | 41 (8.9%) | $164,531 |
| Total | 460 (100.0%) | $124,167 |
Household Income in Reidville
Household Income Brackets in Reidville
With 173 households falling in the category, the $100,000 to $149,999 income range is the most frequent in Reidville, accounting for 31.7% of all households. In contrast, only 4 households (0.7%) fall into the $10,000 to $14,999 income bracket, making it the least populous group.
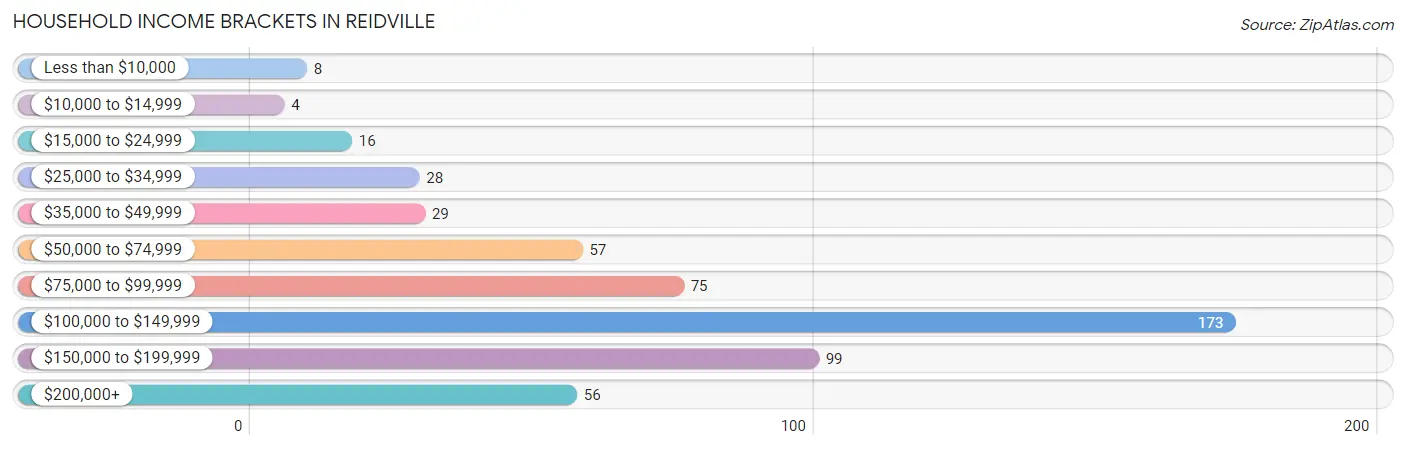
| Income Bracket | # Households | % Households |
| Less than $10,000 | 8 | 1.5% |
| $10,000 to $14,999 | 4 | 0.7% |
| $15,000 to $24,999 | 16 | 2.9% |
| $25,000 to $34,999 | 28 | 5.1% |
| $35,000 to $49,999 | 29 | 5.3% |
| $50,000 to $74,999 | 57 | 10.5% |
| $75,000 to $99,999 | 75 | 13.8% |
| $100,000 to $149,999 | 173 | 31.7% |
| $150,000 to $199,999 | 99 | 18.2% |
| $200,000+ | 56 | 10.3% |
Household Income by Householder Age in Reidville
The median household income in Reidville is $115,972, with the highest median household income of $147,321 found in the 45 to 64 years age bracket for the primary householder. A total of 205 households (37.6%) fall into this category. Meanwhile, the 15 to 24 years age bracket for the primary householder has the lowest median household income of $0, with 4 households (0.7%) in this group.
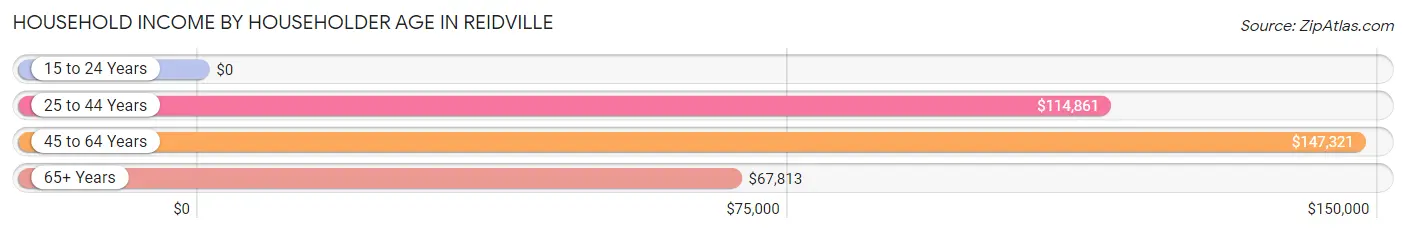
| Income Bracket | # Households | Median Income |
| 15 to 24 Years | 4 (0.7%) | $0 |
| 25 to 44 Years | 277 (50.8%) | $114,861 |
| 45 to 64 Years | 205 (37.6%) | $147,321 |
| 65+ Years | 59 (10.8%) | $67,813 |
| Total | 545 (100.0%) | $115,972 |
Poverty in Reidville
Income Below Poverty by Sex and Age in Reidville
With 6.2% poverty level for males and 5.7% for females among the residents of Reidville, under 5 year old males and 75 year old and over females are the most vulnerable to poverty, with 22 males (31.9%) and 6 females (60.0%) in their respective age groups living below the poverty level.
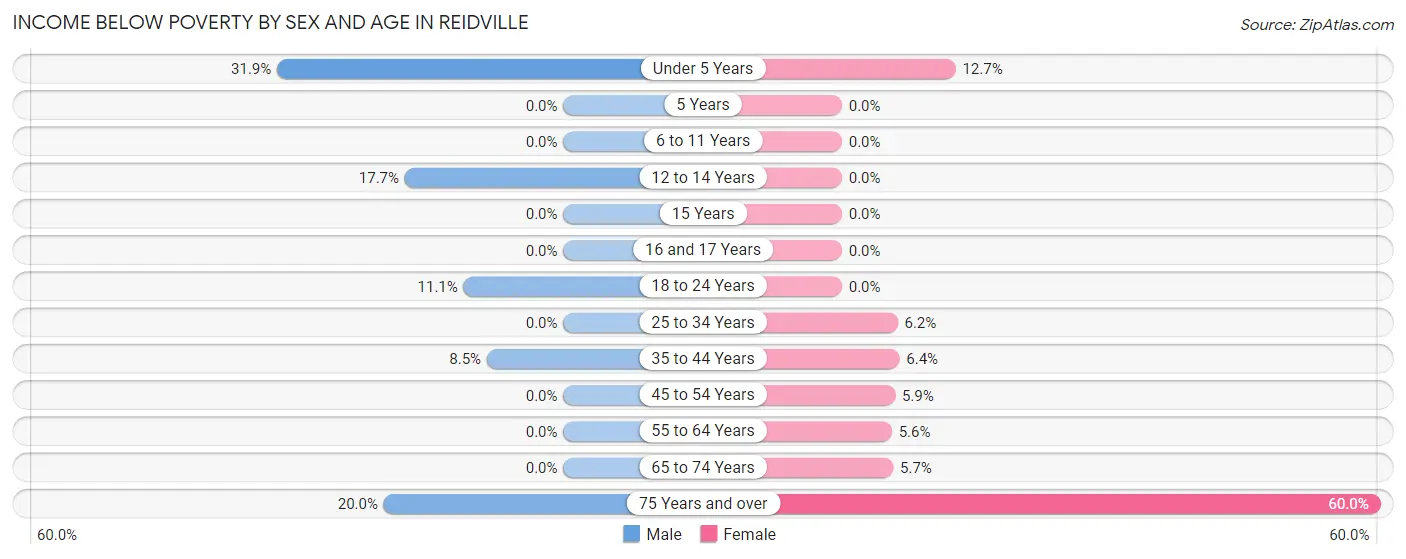
| Age Bracket | Male | Female |
| Under 5 Years | 22 (31.9%) | 10 (12.7%) |
| 5 Years | 0 (0.0%) | 0 (0.0%) |
| 6 to 11 Years | 0 (0.0%) | 0 (0.0%) |
| 12 to 14 Years | 9 (17.6%) | 0 (0.0%) |
| 15 Years | 0 (0.0%) | 0 (0.0%) |
| 16 and 17 Years | 0 (0.0%) | 0 (0.0%) |
| 18 to 24 Years | 4 (11.1%) | 0 (0.0%) |
| 25 to 34 Years | 0 (0.0%) | 9 (6.2%) |
| 35 to 44 Years | 12 (8.5%) | 10 (6.4%) |
| 45 to 54 Years | 0 (0.0%) | 9 (5.9%) |
| 55 to 64 Years | 0 (0.0%) | 4 (5.6%) |
| 65 to 74 Years | 0 (0.0%) | 4 (5.7%) |
| 75 Years and over | 4 (20.0%) | 6 (60.0%) |
| Total | 51 (6.2%) | 52 (5.7%) |
Income Above Poverty by Sex and Age in Reidville
According to the poverty statistics in Reidville, males aged 5 years and females aged 5 years are the age groups that are most secure financially, with 100.0% of males and 100.0% of females in these age groups living above the poverty line.
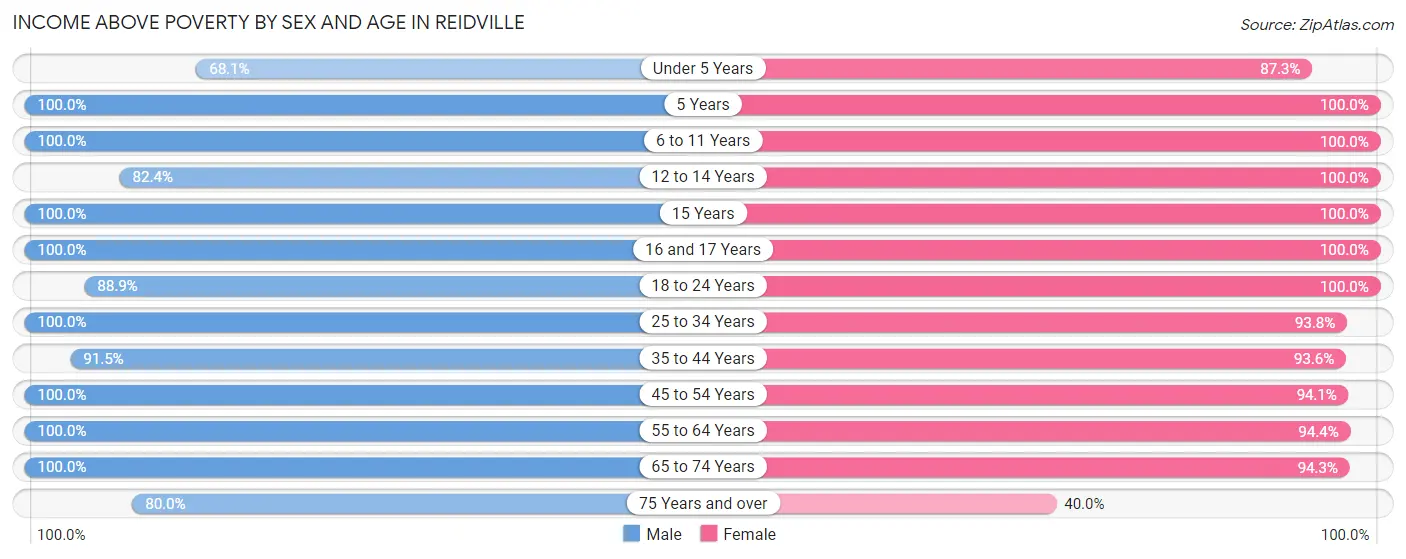
| Age Bracket | Male | Female |
| Under 5 Years | 47 (68.1%) | 69 (87.3%) |
| 5 Years | 21 (100.0%) | 9 (100.0%) |
| 6 to 11 Years | 69 (100.0%) | 133 (100.0%) |
| 12 to 14 Years | 42 (82.4%) | 22 (100.0%) |
| 15 Years | 21 (100.0%) | 24 (100.0%) |
| 16 and 17 Years | 37 (100.0%) | 5 (100.0%) |
| 18 to 24 Years | 32 (88.9%) | 37 (100.0%) |
| 25 to 34 Years | 140 (100.0%) | 136 (93.8%) |
| 35 to 44 Years | 129 (91.5%) | 146 (93.6%) |
| 45 to 54 Years | 115 (100.0%) | 143 (94.1%) |
| 55 to 64 Years | 67 (100.0%) | 68 (94.4%) |
| 65 to 74 Years | 33 (100.0%) | 66 (94.3%) |
| 75 Years and over | 16 (80.0%) | 4 (40.0%) |
| Total | 769 (93.8%) | 862 (94.3%) |
Income Below Poverty Among Married-Couple Families in Reidville
The poverty statistics for married-couple families in Reidville show that 3.3% or 12 of the total 366 families live below the poverty line. Families with 1 or 2 children have the highest poverty rate of 4.1%, comprising of 8 families. On the other hand, families with 3 or 4 children have the lowest poverty rate of 0.0%, which includes 0 families.
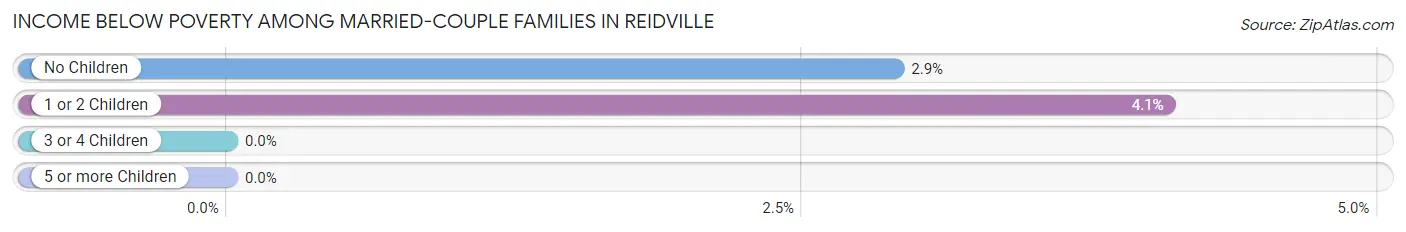
| Children | Above Poverty | Below Poverty |
| No Children | 134 (97.1%) | 4 (2.9%) |
| 1 or 2 Children | 188 (95.9%) | 8 (4.1%) |
| 3 or 4 Children | 27 (100.0%) | 0 (0.0%) |
| 5 or more Children | 5 (100.0%) | 0 (0.0%) |
| Total | 354 (96.7%) | 12 (3.3%) |
Income Below Poverty Among Single-Parent Households in Reidville
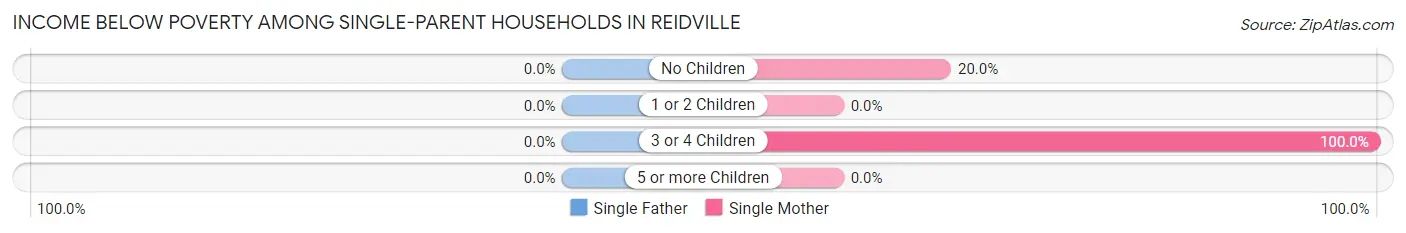
| Children | Single Father | Single Mother |
| No Children | 0 (0.0%) | 4 (20.0%) |
| 1 or 2 Children | 0 (0.0%) | 0 (0.0%) |
| 3 or 4 Children | 0 (0.0%) | 10 (100.0%) |
| 5 or more Children | 0 (0.0%) | 0 (0.0%) |
| Total | 0 (0.0%) | 14 (16.9%) |
Income Below Poverty Among Married-Couple vs Single-Parent Households in Reidville
The poverty data for Reidville shows that 12 of the married-couple family households (3.3%) and 14 of the single-parent households (14.9%) are living below the poverty level. Within the married-couple family households, those with 1 or 2 children have the highest poverty rate, with 8 households (4.1%) falling below the poverty line. Among the single-parent households, those with 3 or 4 children have the highest poverty rate, with 10 household (100.0%) living below poverty.
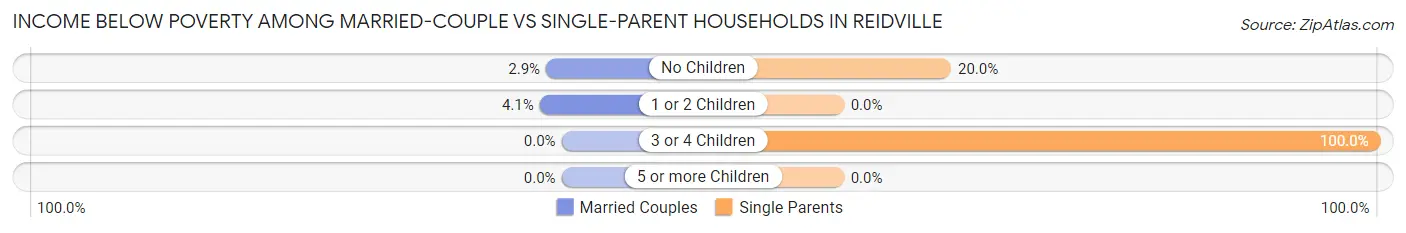
| Children | Married-Couple Families | Single-Parent Households |
| No Children | 4 (2.9%) | 4 (20.0%) |
| 1 or 2 Children | 8 (4.1%) | 0 (0.0%) |
| 3 or 4 Children | 0 (0.0%) | 10 (100.0%) |
| 5 or more Children | 0 (0.0%) | 0 (0.0%) |
| Total | 12 (3.3%) | 14 (14.9%) |
Race in Reidville
The most populous races in Reidville are White / Caucasian (1,188 | 68.5%), Black / African American (400 | 23.1%), and Hispanic or Latino (98 | 5.7%).
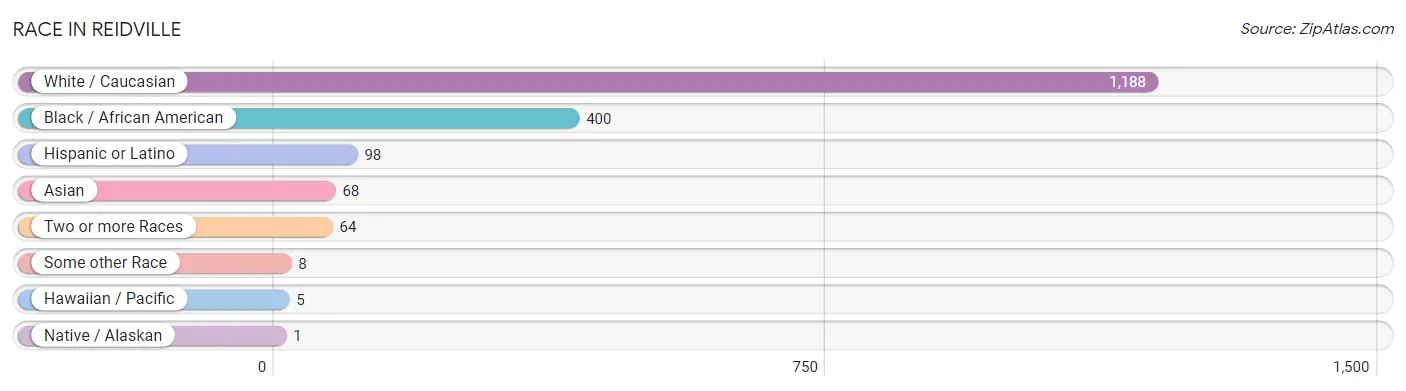
| Race | # Population | % Population |
| Asian | 68 | 3.9% |
| Black / African American | 400 | 23.1% |
| Hawaiian / Pacific | 5 | 0.3% |
| Hispanic or Latino | 98 | 5.7% |
| Native / Alaskan | 1 | 0.1% |
| White / Caucasian | 1,188 | 68.5% |
| Two or more Races | 64 | 3.7% |
| Some other Race | 8 | 0.5% |
| Total | 1,734 | 100.0% |
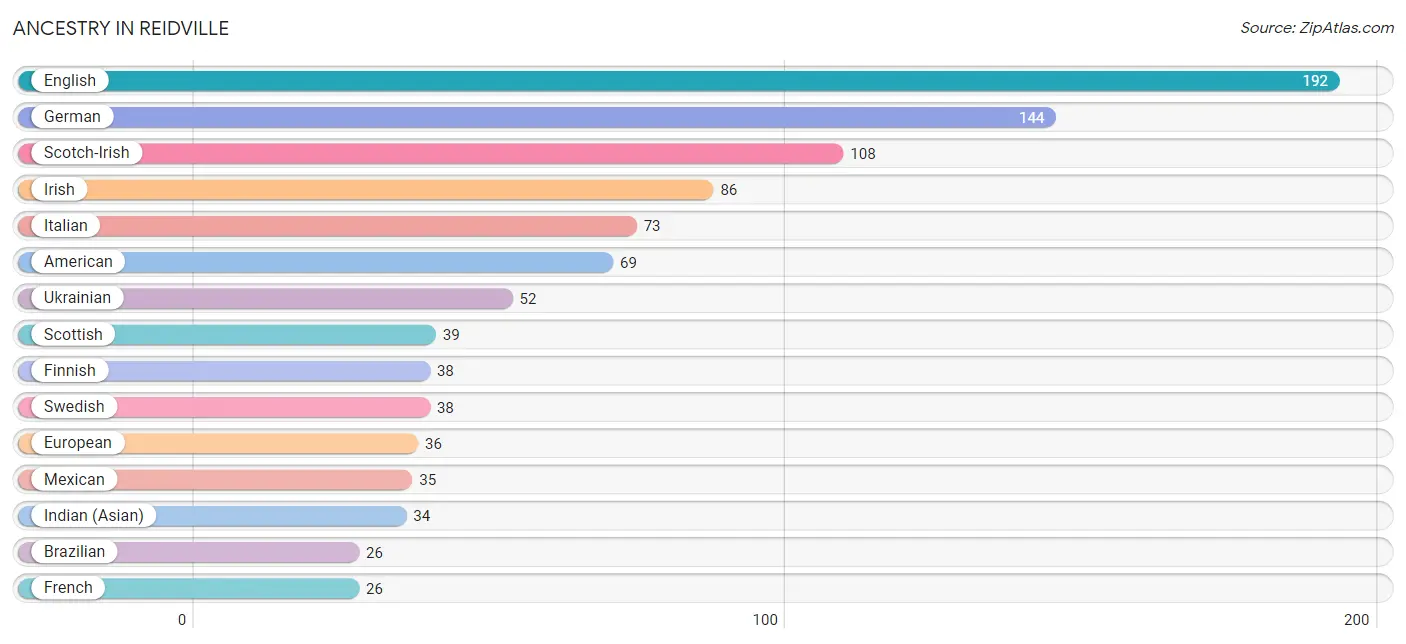
Ancestry in Reidville
The most populous ancestries reported in Reidville are English (192 | 11.1%), German (144 | 8.3%), Scotch-Irish (108 | 6.2%), Irish (86 | 5.0%), and Italian (73 | 4.2%), together accounting for 34.8% of all Reidville residents.
| Ancestry | # Population | % Population |
| Alsatian | 3 | 0.2% |
| American | 69 | 4.0% |
| Austrian | 5 | 0.3% |
| Brazilian | 26 | 1.5% |
| British | 4 | 0.2% |
| Burmese | 18 | 1.0% |
| Canadian | 6 | 0.4% |
| Celtic | 6 | 0.4% |
| Cherokee | 9 | 0.5% |
| Colombian | 9 | 0.5% |
| Cuban | 16 | 0.9% |
| Dominican | 14 | 0.8% |
| Dutch | 8 | 0.5% |
| Eastern European | 1 | 0.1% |
| English | 192 | 11.1% |
| European | 36 | 2.1% |
| Finnish | 38 | 2.2% |
| French | 26 | 1.5% |
| French Canadian | 6 | 0.4% |
| German | 144 | 8.3% |
| Hungarian | 2 | 0.1% |
| Indian (Asian) | 34 | 2.0% |
| Irish | 86 | 5.0% |
| Italian | 73 | 4.2% |
| Korean | 4 | 0.2% |
| Lithuanian | 6 | 0.4% |
| Mexican | 35 | 2.0% |
| Pennsylvania German | 7 | 0.4% |
| Peruvian | 8 | 0.5% |
| Polish | 3 | 0.2% |
| Puerto Rican | 9 | 0.5% |
| Samoan | 10 | 0.6% |
| Scandinavian | 2 | 0.1% |
| Scotch-Irish | 108 | 6.2% |
| Scottish | 39 | 2.2% |
| South American | 20 | 1.1% |
| Swedish | 38 | 2.2% |
| Thai | 9 | 0.5% |
| Ukrainian | 52 | 3.0% |
| Venezuelan | 3 | 0.2% |
| Welsh | 11 | 0.6% | View All 41 Rows |
Immigrants in Reidville
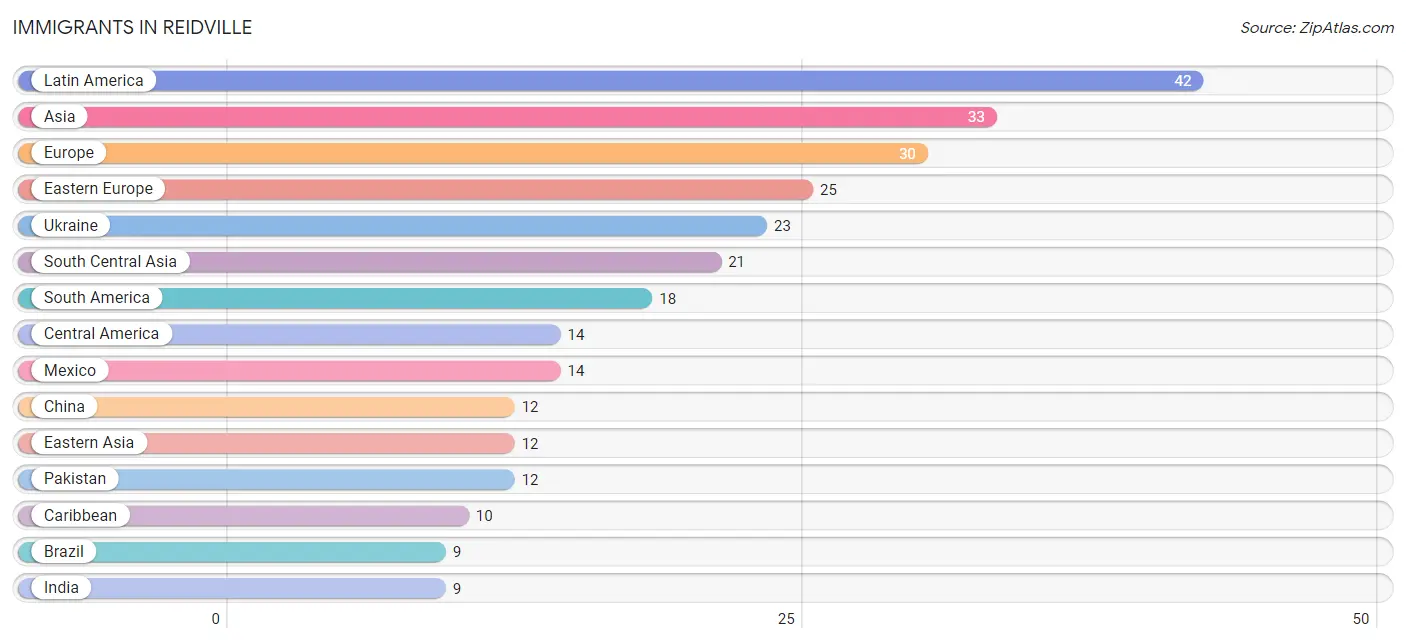
The most numerous immigrant groups reported in Reidville came from Latin America (42 | 2.4%), Asia (33 | 1.9%), Europe (30 | 1.7%), Eastern Europe (25 | 1.4%), and Ukraine (23 | 1.3%), together accounting for 8.8% of all Reidville residents.
| Immigration Origin | # Population | % Population |
| Asia | 33 | 1.9% |
| Austria | 5 | 0.3% |
| Brazil | 9 | 0.5% |
| Caribbean | 10 | 0.6% |
| Central America | 14 | 0.8% |
| China | 12 | 0.7% |
| Colombia | 4 | 0.2% |
| Cuba | 7 | 0.4% |
| Dominican Republic | 3 | 0.2% |
| Eastern Asia | 12 | 0.7% |
| Eastern Europe | 25 | 1.4% |
| Europe | 30 | 1.7% |
| India | 9 | 0.5% |
| Latin America | 42 | 2.4% |
| Mexico | 14 | 0.8% |
| Oceania | 5 | 0.3% |
| Pakistan | 12 | 0.7% |
| Peru | 2 | 0.1% |
| Romania | 2 | 0.1% |
| South America | 18 | 1.0% |
| South Central Asia | 21 | 1.2% |
| Ukraine | 23 | 1.3% |
| Venezuela | 3 | 0.2% |
| Western Europe | 5 | 0.3% | View All 24 Rows |
Sex and Age in Reidville
Sex and Age in Reidville
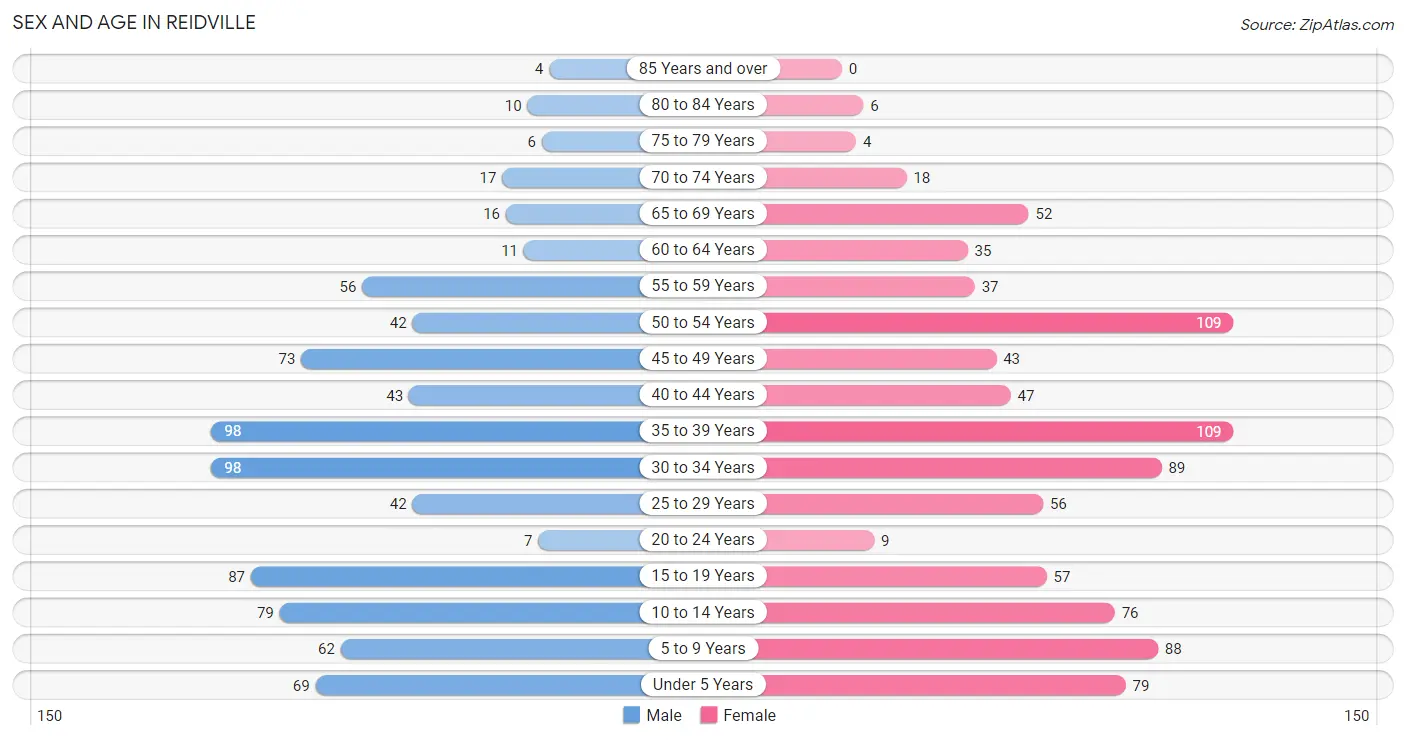
The most populous age groups in Reidville are 30 to 34 Years (98 | 11.9%) for men and 35 to 39 Years (109 | 11.9%) for women.
| Age Bracket | Male | Female |
| Under 5 Years | 69 (8.4%) | 79 (8.6%) |
| 5 to 9 Years | 62 (7.6%) | 88 (9.6%) |
| 10 to 14 Years | 79 (9.6%) | 76 (8.3%) |
| 15 to 19 Years | 87 (10.6%) | 57 (6.2%) |
| 20 to 24 Years | 7 (0.9%) | 9 (1.0%) |
| 25 to 29 Years | 42 (5.1%) | 56 (6.1%) |
| 30 to 34 Years | 98 (11.9%) | 89 (9.7%) |
| 35 to 39 Years | 98 (11.9%) | 109 (11.9%) |
| 40 to 44 Years | 43 (5.2%) | 47 (5.1%) |
| 45 to 49 Years | 73 (8.9%) | 43 (4.7%) |
| 50 to 54 Years | 42 (5.1%) | 109 (11.9%) |
| 55 to 59 Years | 56 (6.8%) | 37 (4.1%) |
| 60 to 64 Years | 11 (1.3%) | 35 (3.8%) |
| 65 to 69 Years | 16 (1.9%) | 52 (5.7%) |
| 70 to 74 Years | 17 (2.1%) | 18 (2.0%) |
| 75 to 79 Years | 6 (0.7%) | 4 (0.4%) |
| 80 to 84 Years | 10 (1.2%) | 6 (0.7%) |
| 85 Years and over | 4 (0.5%) | 0 (0.0%) |
| Total | 820 (100.0%) | 914 (100.0%) |
Families and Households in Reidville
Median Family Size in Reidville
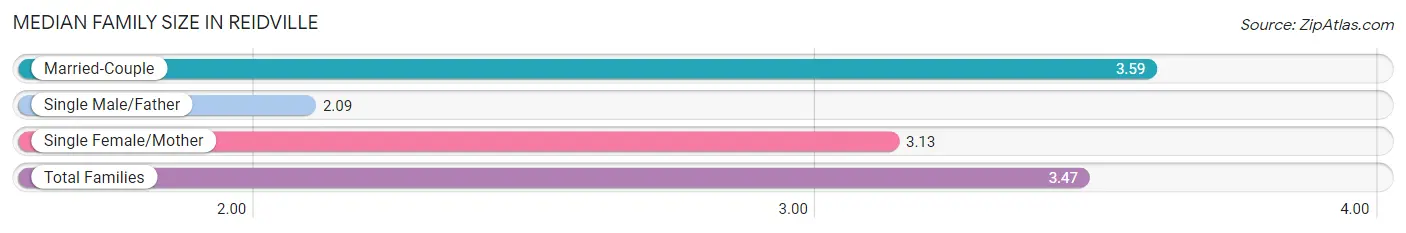
The median family size in Reidville is 3.47 persons per family, with married-couple families (366 | 79.6%) accounting for the largest median family size of 3.59 persons per family. On the other hand, single male/father families (11 | 2.4%) represent the smallest median family size with 2.09 persons per family.
| Family Type | # Families | Family Size |
| Married-Couple | 366 (79.6%) | 3.59 |
| Single Male/Father | 11 (2.4%) | 2.09 |
| Single Female/Mother | 83 (18.0%) | 3.13 |
| Total Families | 460 (100.0%) | 3.47 |
Median Household Size in Reidville
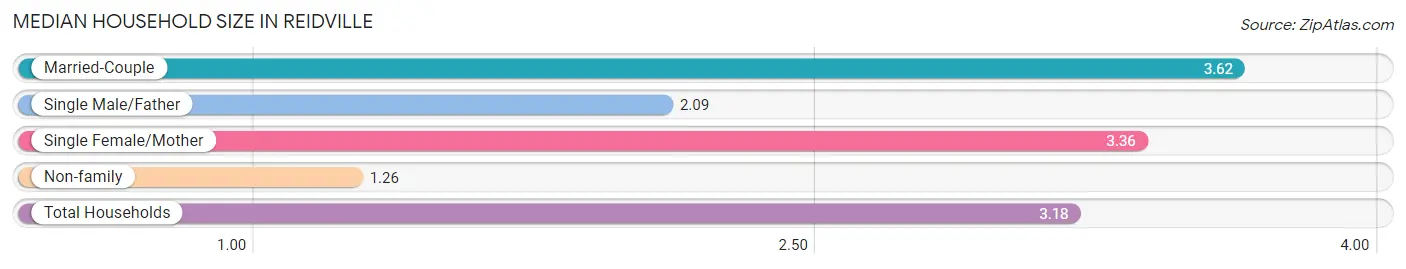
The median household size in Reidville is 3.18 persons per household, with married-couple households (366 | 67.2%) accounting for the largest median household size of 3.62 persons per household. non-family households (85 | 15.6%) represent the smallest median household size with 1.26 persons per household.
| Household Type | # Households | Household Size |
| Married-Couple | 366 (67.2%) | 3.62 |
| Single Male/Father | 11 (2.0%) | 2.09 |
| Single Female/Mother | 83 (15.2%) | 3.36 |
| Non-family | 85 (15.6%) | 1.26 |
| Total Households | 545 (100.0%) | 3.18 |
Household Size by Marriage Status in Reidville
Out of a total of 545 households in Reidville, 460 (84.4%) are family households, while 85 (15.6%) are nonfamily households. The most numerous type of family households are 2-person households, comprising 161, and the most common type of nonfamily households are 1-person households, comprising 67.
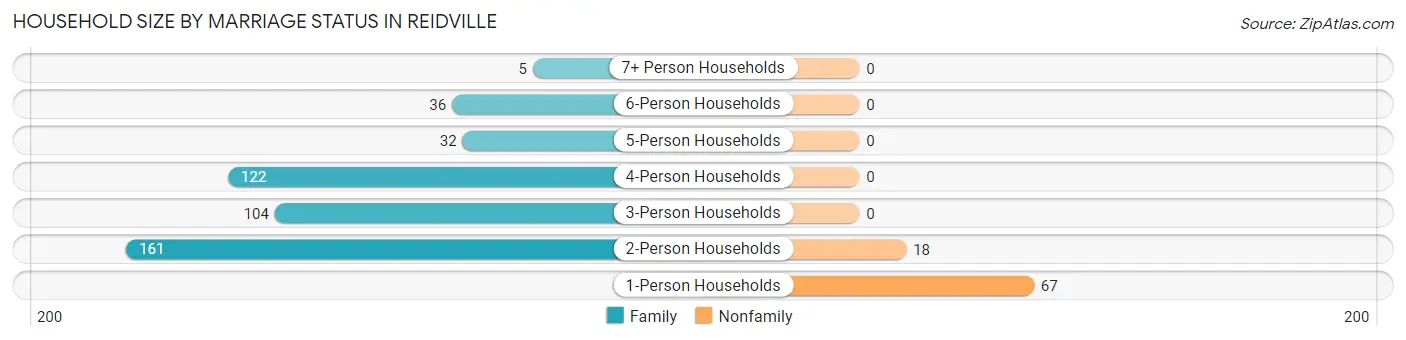
| Household Size | Family Households | Nonfamily Households |
| 1-Person Households | - | 67 (12.3%) |
| 2-Person Households | 161 (29.5%) | 18 (3.3%) |
| 3-Person Households | 104 (19.1%) | 0 (0.0%) |
| 4-Person Households | 122 (22.4%) | 0 (0.0%) |
| 5-Person Households | 32 (5.9%) | 0 (0.0%) |
| 6-Person Households | 36 (6.6%) | 0 (0.0%) |
| 7+ Person Households | 5 (0.9%) | 0 (0.0%) |
| Total | 460 (84.4%) | 85 (15.6%) |
Female Fertility in Reidville
Fertility by Age in Reidville
Average fertility rate in Reidville is 85.0 births per 1,000 women. Women in the age bracket of 20 to 34 years have the highest fertility rate with 143.0 births per 1,000 women. Women in the age bracket of 20 to 34 years acount for 61.1% of all women with births.
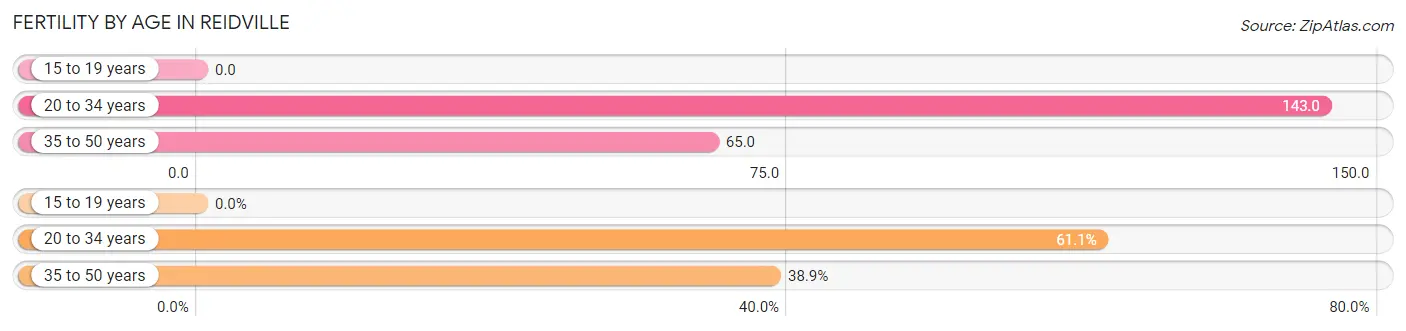
| Age Bracket | Women with Births | Births / 1,000 Women |
| 15 to 19 years | 0 (0.0%) | 0.0 |
| 20 to 34 years | 22 (61.1%) | 143.0 |
| 35 to 50 years | 14 (38.9%) | 65.0 |
| Total | 36 (100.0%) | 85.0 |
Fertility by Age by Marriage Status in Reidville
41.7% of women with births (36) in Reidville are married. The highest percentage of unmarried women with births falls into 35 to 50 years age bracket with 71.4% of them unmarried at the time of birth, while the lowest percentage of unmarried women with births belong to 20 to 34 years age bracket with 50.0% of them unmarried.
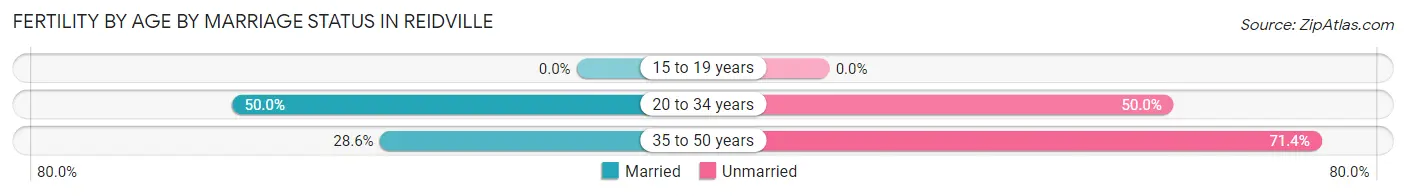
| Age Bracket | Married | Unmarried |
| 15 to 19 years | 0 (0.0%) | 0 (0.0%) |
| 20 to 34 years | 11 (50.0%) | 11 (50.0%) |
| 35 to 50 years | 4 (28.6%) | 10 (71.4%) |
| Total | 15 (41.7%) | 21 (58.3%) |
Fertility by Education in Reidville
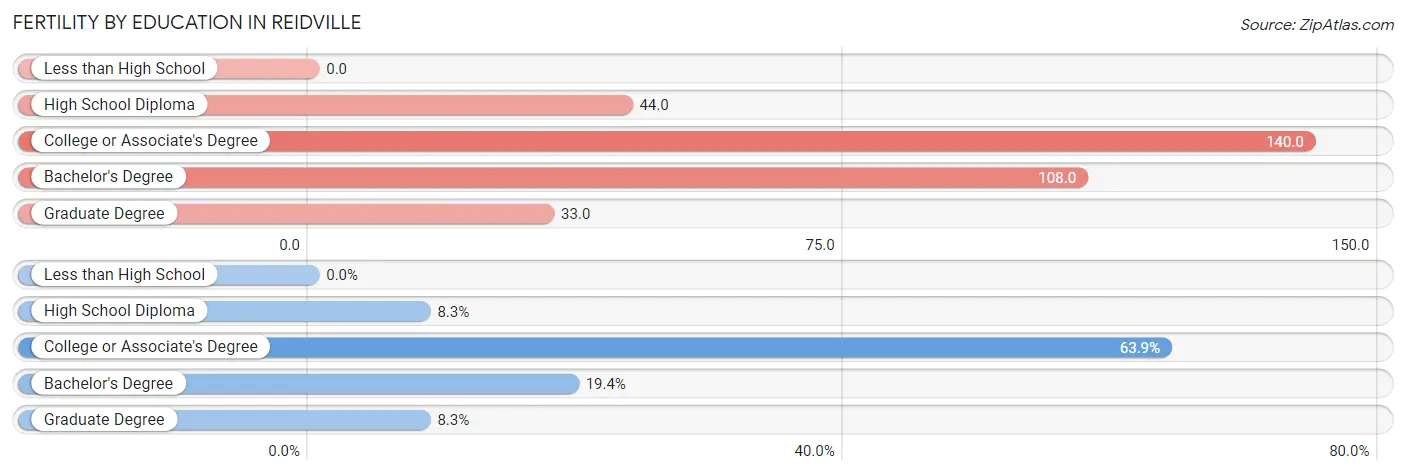
| Educational Attainment | Women with Births | Births / 1,000 Women |
| Less than High School | 0 (0.0%) | 0.0 |
| High School Diploma | 3 (8.3%) | 44.0 |
| College or Associate's Degree | 23 (63.9%) | 140.0 |
| Bachelor's Degree | 7 (19.4%) | 108.0 |
| Graduate Degree | 3 (8.3%) | 33.0 |
| Total | 36 (100.0%) | 85.0 |
Fertility by Education by Marriage Status in Reidville
58.3% of women with births in Reidville are unmarried. Women with the educational attainment of high school diploma are most likely to be married with 100.0% of them married at childbirth, while women with the educational attainment of graduate degree are least likely to be married with 100.0% of them unmarried at childbirth.
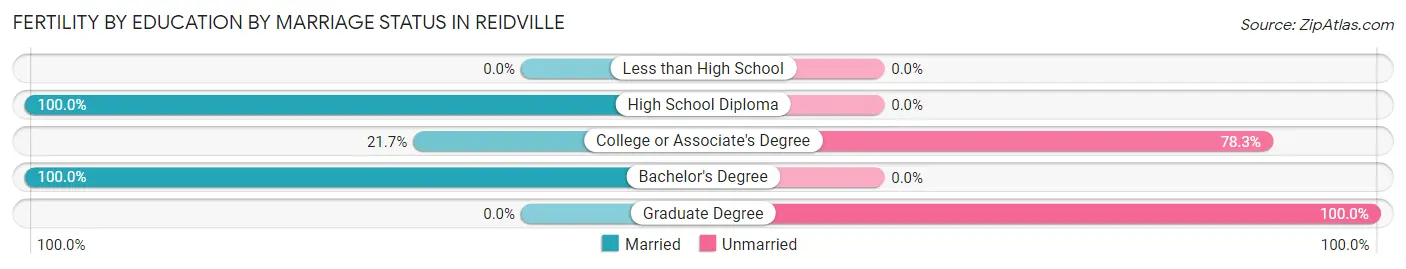
| Educational Attainment | Married | Unmarried |
| Less than High School | 0 (0.0%) | 0 (0.0%) |
| High School Diploma | 3 (100.0%) | 0 (0.0%) |
| College or Associate's Degree | 5 (21.7%) | 18 (78.3%) |
| Bachelor's Degree | 7 (100.0%) | 0 (0.0%) |
| Graduate Degree | 0 (0.0%) | 3 (100.0%) |
| Total | 15 (41.7%) | 21 (58.3%) |
Employment Characteristics in Reidville
Employment by Class of Employer in Reidville
Among the 920 employed individuals in Reidville, private company employees (665 | 72.3%), local government employees (89 | 9.7%), and state government employees (67 | 7.3%) make up the most common classes of employment.
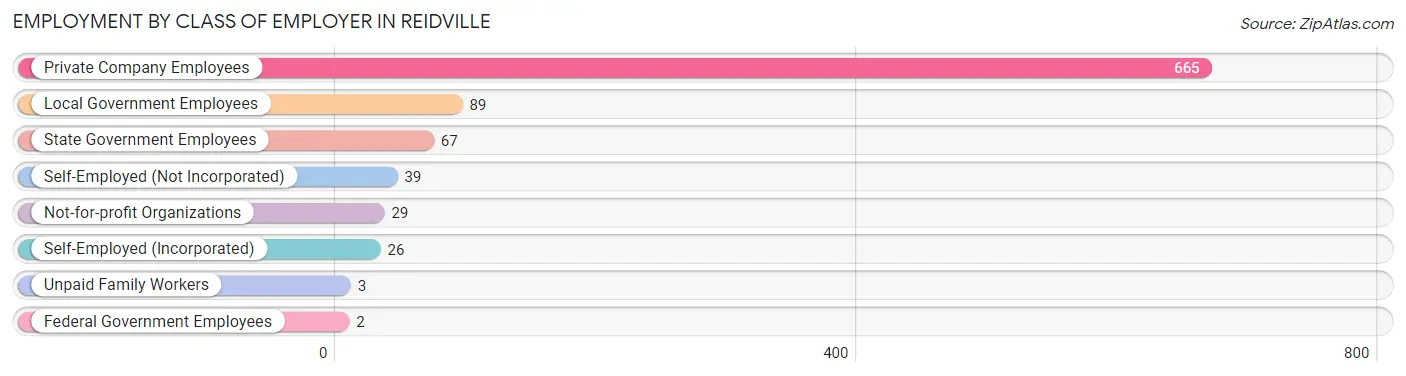
| Employer Class | # Employees | % Employees |
| Private Company Employees | 665 | 72.3% |
| Self-Employed (Incorporated) | 26 | 2.8% |
| Self-Employed (Not Incorporated) | 39 | 4.2% |
| Not-for-profit Organizations | 29 | 3.2% |
| Local Government Employees | 89 | 9.7% |
| State Government Employees | 67 | 7.3% |
| Federal Government Employees | 2 | 0.2% |
| Unpaid Family Workers | 3 | 0.3% |
| Total | 920 | 100.0% |
Employment Status by Age in Reidville
According to the labor force statistics for Reidville, out of the total population over 16 years of age (1,236), 78.8% or 974 individuals are in the labor force, with 4.5% or 44 of them unemployed. The age group with the highest labor force participation rate is 25 to 29 years, with 95.9% or 94 individuals in the labor force. Within the labor force, the 16 to 19 years age range has the highest percentage of unemployed individuals, with 30.2% or 19 of them being unemployed.
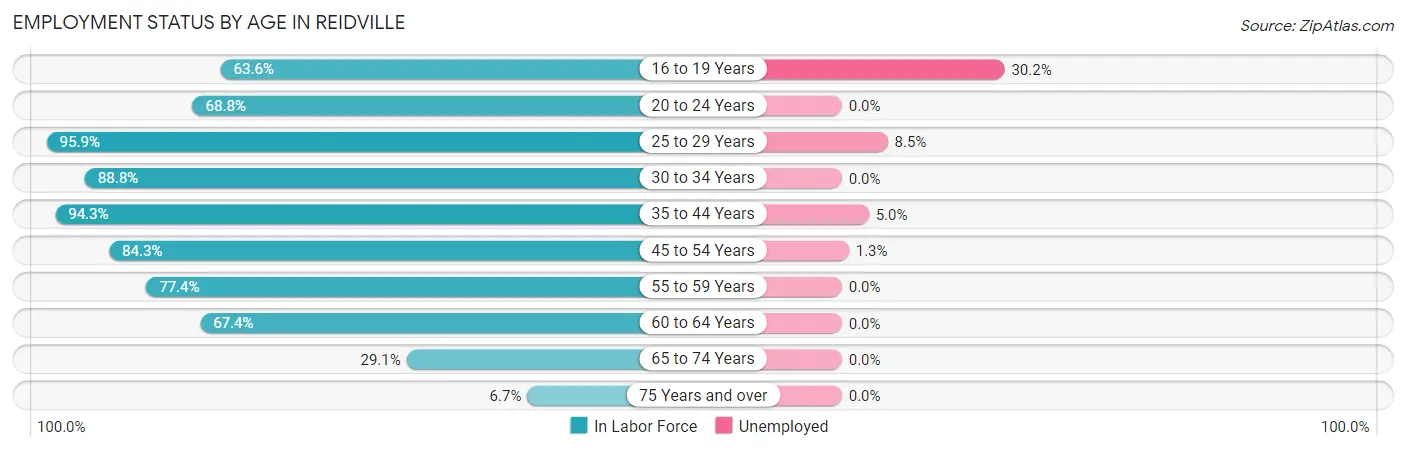
| Age Bracket | In Labor Force | Unemployed |
| 16 to 19 Years | 63 (63.6%) | 19 (30.2%) |
| 20 to 24 Years | 11 (68.8%) | 0 (0.0%) |
| 25 to 29 Years | 94 (95.9%) | 8 (8.5%) |
| 30 to 34 Years | 166 (88.8%) | 0 (0.0%) |
| 35 to 44 Years | 280 (94.3%) | 14 (5.0%) |
| 45 to 54 Years | 225 (84.3%) | 3 (1.3%) |
| 55 to 59 Years | 72 (77.4%) | 0 (0.0%) |
| 60 to 64 Years | 31 (67.4%) | 0 (0.0%) |
| 65 to 74 Years | 30 (29.1%) | 0 (0.0%) |
| 75 Years and over | 2 (6.7%) | 0 (0.0%) |
| Total | 974 (78.8%) | 44 (4.5%) |
Employment Status by Educational Attainment in Reidville
According to labor force statistics for Reidville, 87.9% of individuals (868) out of the total population between 25 and 64 years of age (988) are in the labor force, with 2.9% or 25 of them being unemployed. The group with the highest labor force participation rate are those with the educational attainment of bachelor's degree or higher, with 96.9% or 407 individuals in the labor force. Within the labor force, individuals with less than high school education have the highest percentage of unemployment, with 10.7% or 3 of them being unemployed.
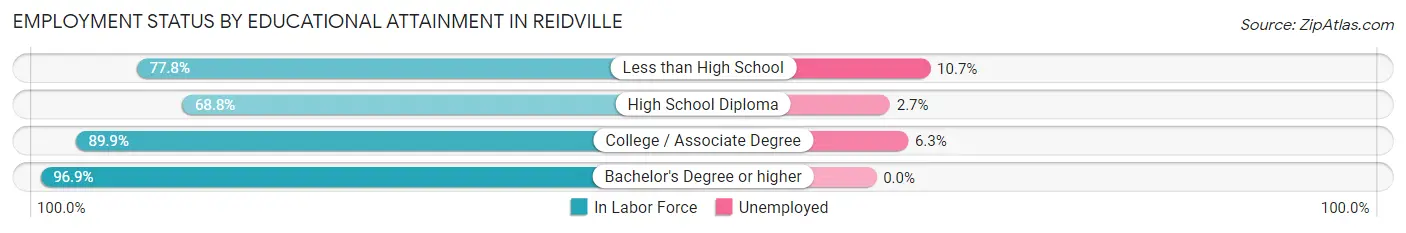
| Educational Attainment | In Labor Force | Unemployed |
| Less than High School | 28 (77.8%) | 4 (10.7%) |
| High School Diploma | 148 (68.8%) | 6 (2.7%) |
| College / Associate Degree | 285 (89.9%) | 20 (6.3%) |
| Bachelor's Degree or higher | 407 (96.9%) | 0 (0.0%) |
| Total | 868 (87.9%) | 29 (2.9%) |
Employment Occupations by Sex in Reidville
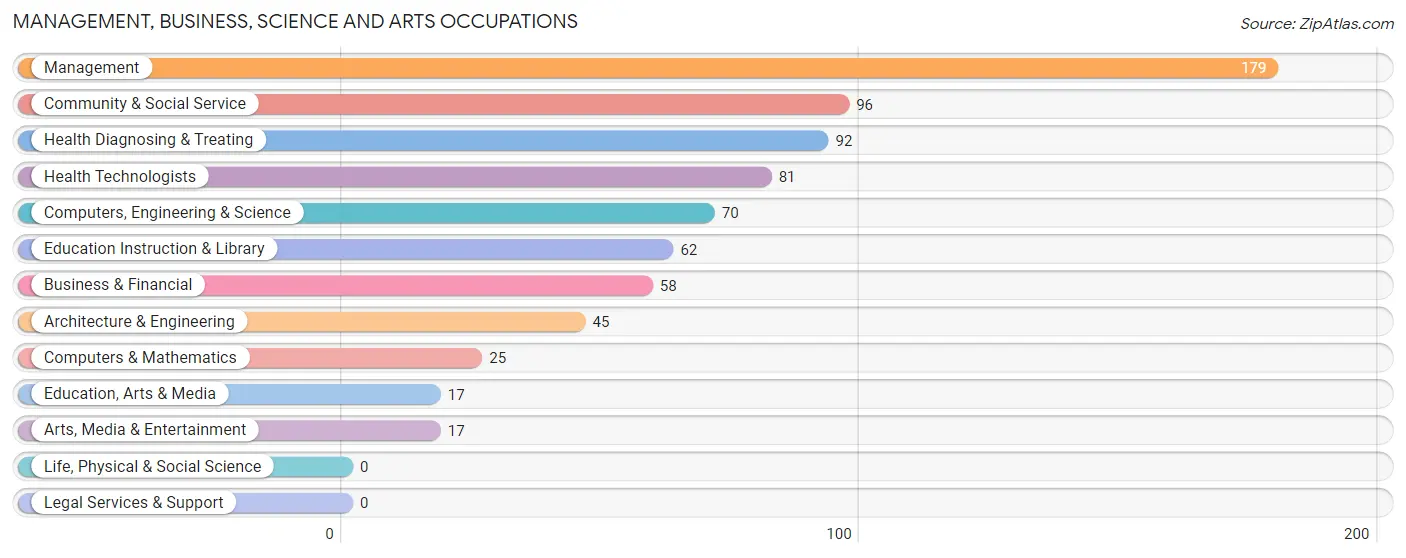
Management, Business, Science and Arts Occupations
The most common Management, Business, Science and Arts occupations in Reidville are Management (179 | 19.3%), Community & Social Service (96 | 10.3%), Health Diagnosing & Treating (92 | 9.9%), Health Technologists (81 | 8.7%), and Computers, Engineering & Science (70 | 7.5%).
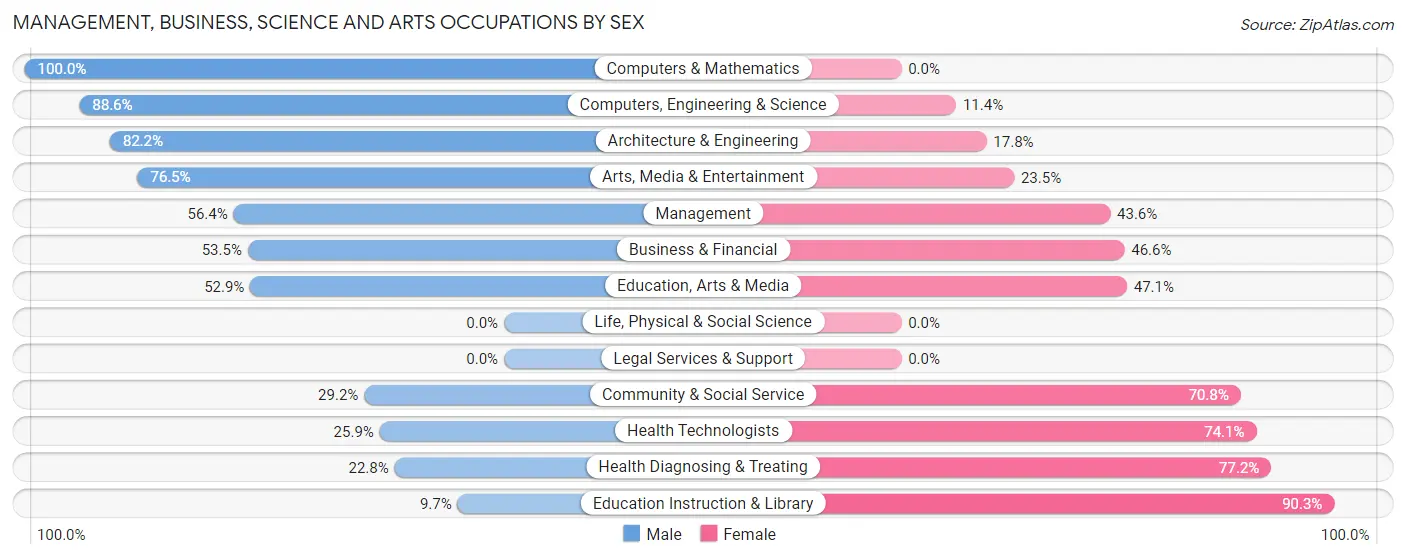
Management, Business, Science and Arts Occupations by Sex
Within the Management, Business, Science and Arts occupations in Reidville, the most male-oriented occupations are Computers & Mathematics (100.0%), Computers, Engineering & Science (88.6%), and Architecture & Engineering (82.2%), while the most female-oriented occupations are Education Instruction & Library (90.3%), Health Diagnosing & Treating (77.2%), and Health Technologists (74.1%).
| Occupation | Male | Female |
| Management | 101 (56.4%) | 78 (43.6%) |
| Business & Financial | 31 (53.4%) | 27 (46.6%) |
| Computers, Engineering & Science | 62 (88.6%) | 8 (11.4%) |
| Computers & Mathematics | 25 (100.0%) | 0 (0.0%) |
| Architecture & Engineering | 37 (82.2%) | 8 (17.8%) |
| Life, Physical & Social Science | 0 (0.0%) | 0 (0.0%) |
| Community & Social Service | 28 (29.2%) | 68 (70.8%) |
| Education, Arts & Media | 9 (52.9%) | 8 (47.1%) |
| Legal Services & Support | 0 (0.0%) | 0 (0.0%) |
| Education Instruction & Library | 6 (9.7%) | 56 (90.3%) |
| Arts, Media & Entertainment | 13 (76.5%) | 4 (23.5%) |
| Health Diagnosing & Treating | 21 (22.8%) | 71 (77.2%) |
| Health Technologists | 21 (25.9%) | 60 (74.1%) |
| Total (Category) | 243 (49.1%) | 252 (50.9%) |
| Total (Overall) | 489 (52.6%) | 441 (47.4%) |
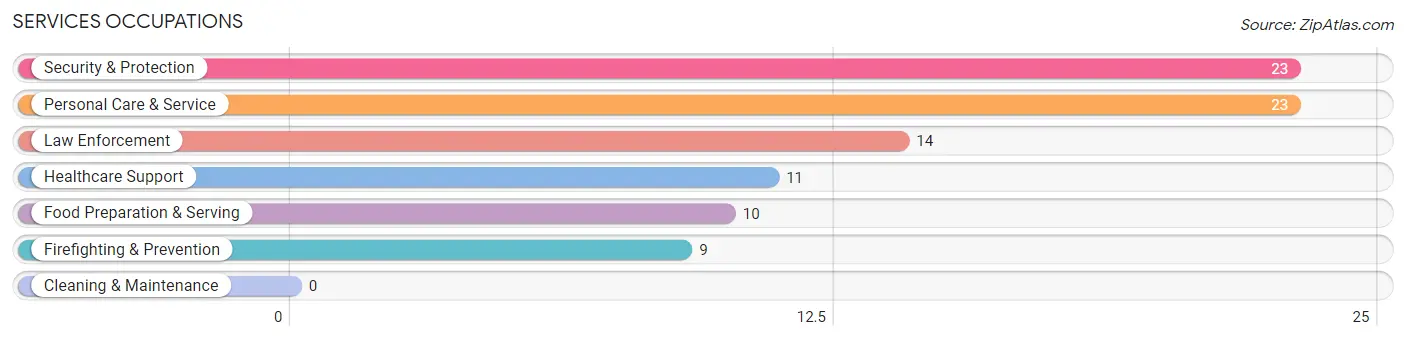
Services Occupations
The most common Services occupations in Reidville are Security & Protection (23 | 2.5%), Personal Care & Service (23 | 2.5%), Law Enforcement (14 | 1.5%), Healthcare Support (11 | 1.2%), and Food Preparation & Serving (10 | 1.1%).
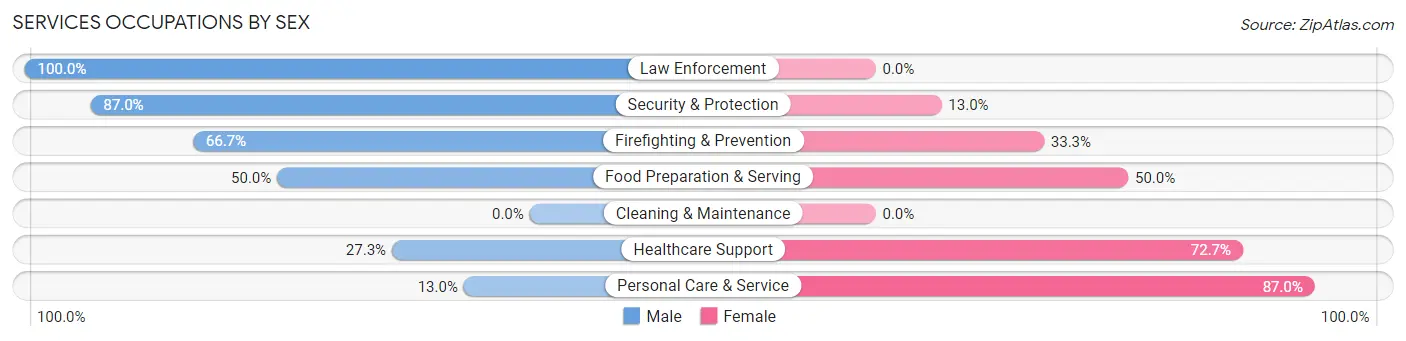
Services Occupations by Sex
Within the Services occupations in Reidville, the most male-oriented occupations are Law Enforcement (100.0%), Security & Protection (87.0%), and Firefighting & Prevention (66.7%), while the most female-oriented occupations are Personal Care & Service (87.0%), Healthcare Support (72.7%), and Food Preparation & Serving (50.0%).
| Occupation | Male | Female |
| Healthcare Support | 3 (27.3%) | 8 (72.7%) |
| Security & Protection | 20 (87.0%) | 3 (13.0%) |
| Firefighting & Prevention | 6 (66.7%) | 3 (33.3%) |
| Law Enforcement | 14 (100.0%) | 0 (0.0%) |
| Food Preparation & Serving | 5 (50.0%) | 5 (50.0%) |
| Cleaning & Maintenance | 0 (0.0%) | 0 (0.0%) |
| Personal Care & Service | 3 (13.0%) | 20 (87.0%) |
| Total (Category) | 31 (46.3%) | 36 (53.7%) |
| Total (Overall) | 489 (52.6%) | 441 (47.4%) |
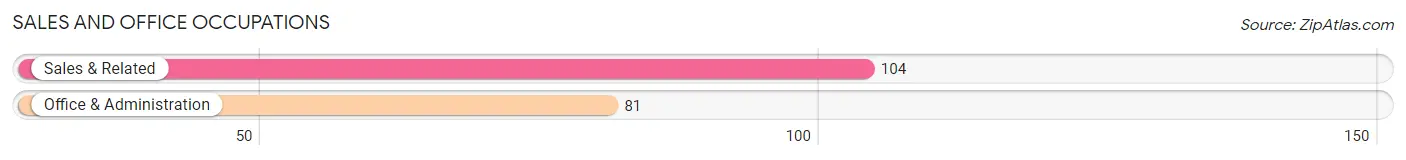
Sales and Office Occupations
The most common Sales and Office occupations in Reidville are Sales & Related (104 | 11.2%), and Office & Administration (81 | 8.7%).
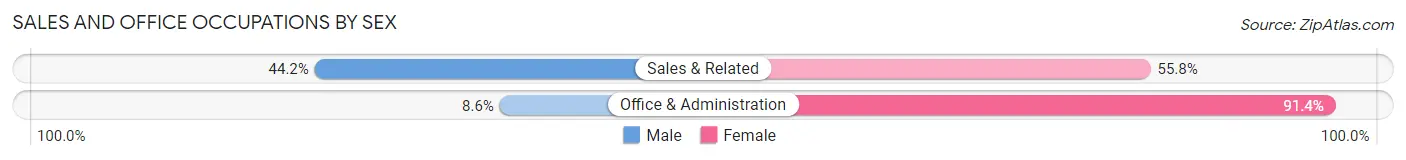
Sales and Office Occupations by Sex
| Occupation | Male | Female |
| Sales & Related | 46 (44.2%) | 58 (55.8%) |
| Office & Administration | 7 (8.6%) | 74 (91.4%) |
| Total (Category) | 53 (28.6%) | 132 (71.4%) |
| Total (Overall) | 489 (52.6%) | 441 (47.4%) |
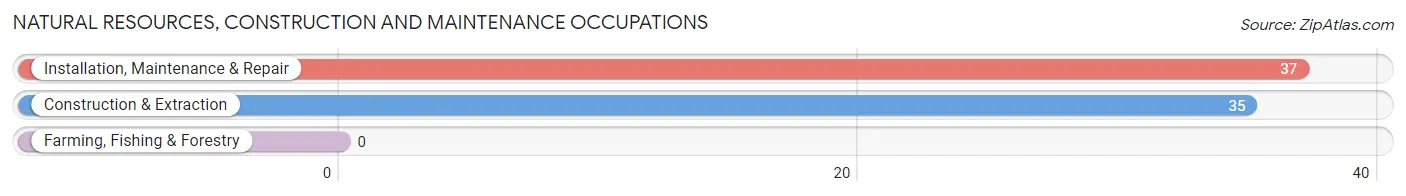
Natural Resources, Construction and Maintenance Occupations
The most common Natural Resources, Construction and Maintenance occupations in Reidville are Installation, Maintenance & Repair (37 | 4.0%), and Construction & Extraction (35 | 3.8%).
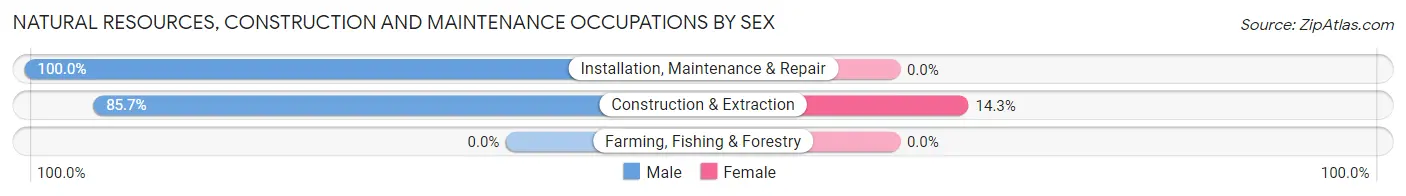
Natural Resources, Construction and Maintenance Occupations by Sex
| Occupation | Male | Female |
| Farming, Fishing & Forestry | 0 (0.0%) | 0 (0.0%) |
| Construction & Extraction | 30 (85.7%) | 5 (14.3%) |
| Installation, Maintenance & Repair | 37 (100.0%) | 0 (0.0%) |
| Total (Category) | 67 (93.1%) | 5 (6.9%) |
| Total (Overall) | 489 (52.6%) | 441 (47.4%) |
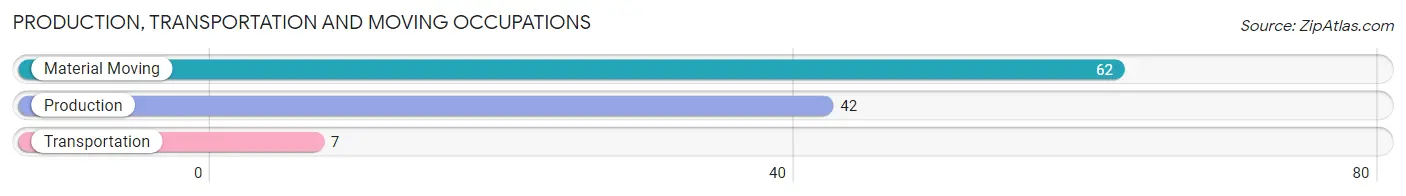
Production, Transportation and Moving Occupations
The most common Production, Transportation and Moving occupations in Reidville are Material Moving (62 | 6.7%), Production (42 | 4.5%), and Transportation (7 | 0.7%).
Production, Transportation and Moving Occupations by Sex
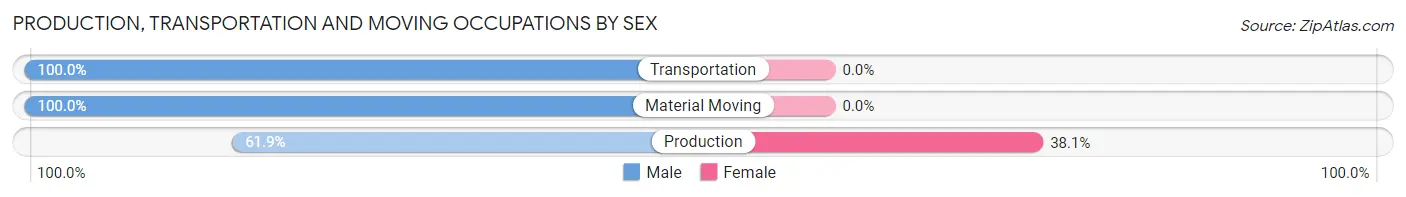
| Occupation | Male | Female |
| Production | 26 (61.9%) | 16 (38.1%) |
| Transportation | 7 (100.0%) | 0 (0.0%) |
| Material Moving | 62 (100.0%) | 0 (0.0%) |
| Total (Category) | 95 (85.6%) | 16 (14.4%) |
| Total (Overall) | 489 (52.6%) | 441 (47.4%) |
Employment Industries by Sex in Reidville
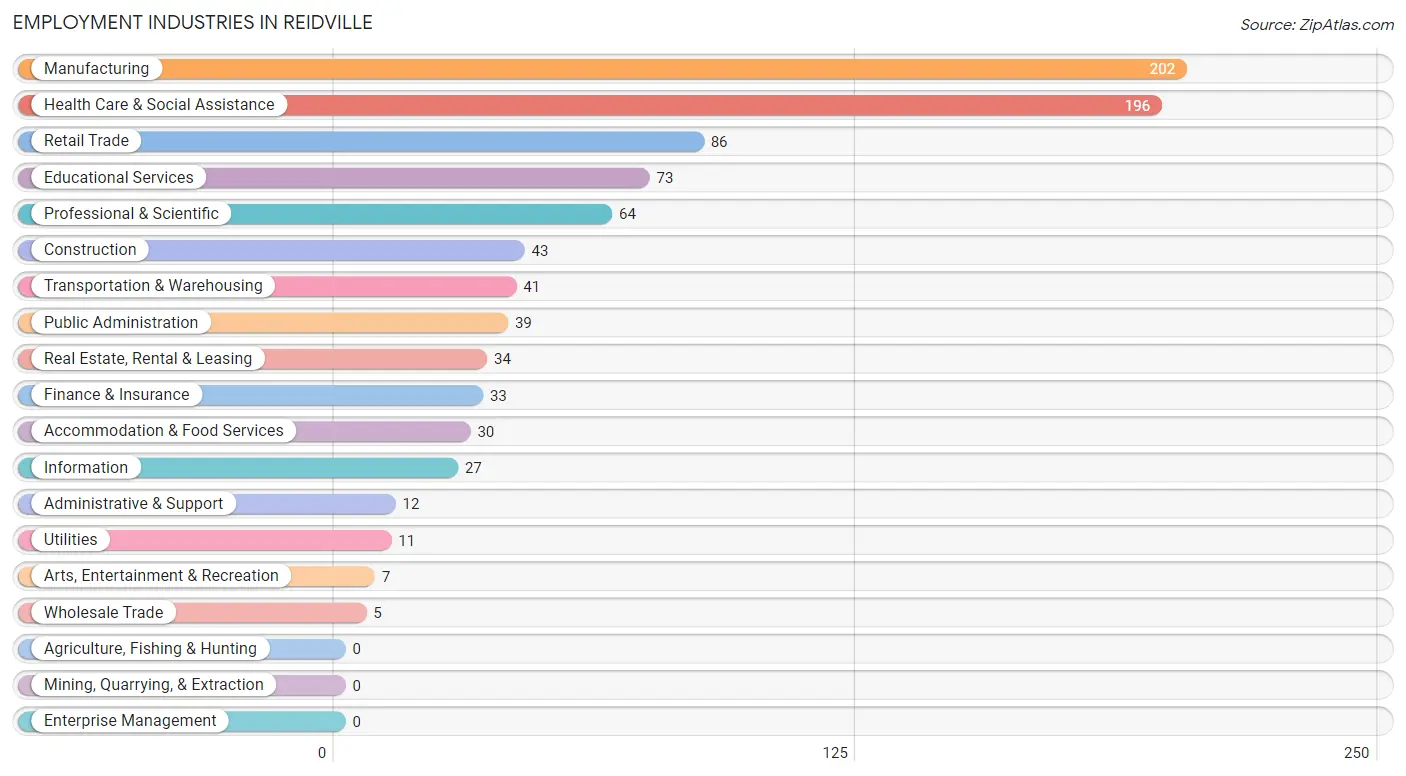
Employment Industries in Reidville
The major employment industries in Reidville include Manufacturing (202 | 21.7%), Health Care & Social Assistance (196 | 21.1%), Retail Trade (86 | 9.2%), Educational Services (73 | 7.9%), and Professional & Scientific (64 | 6.9%).
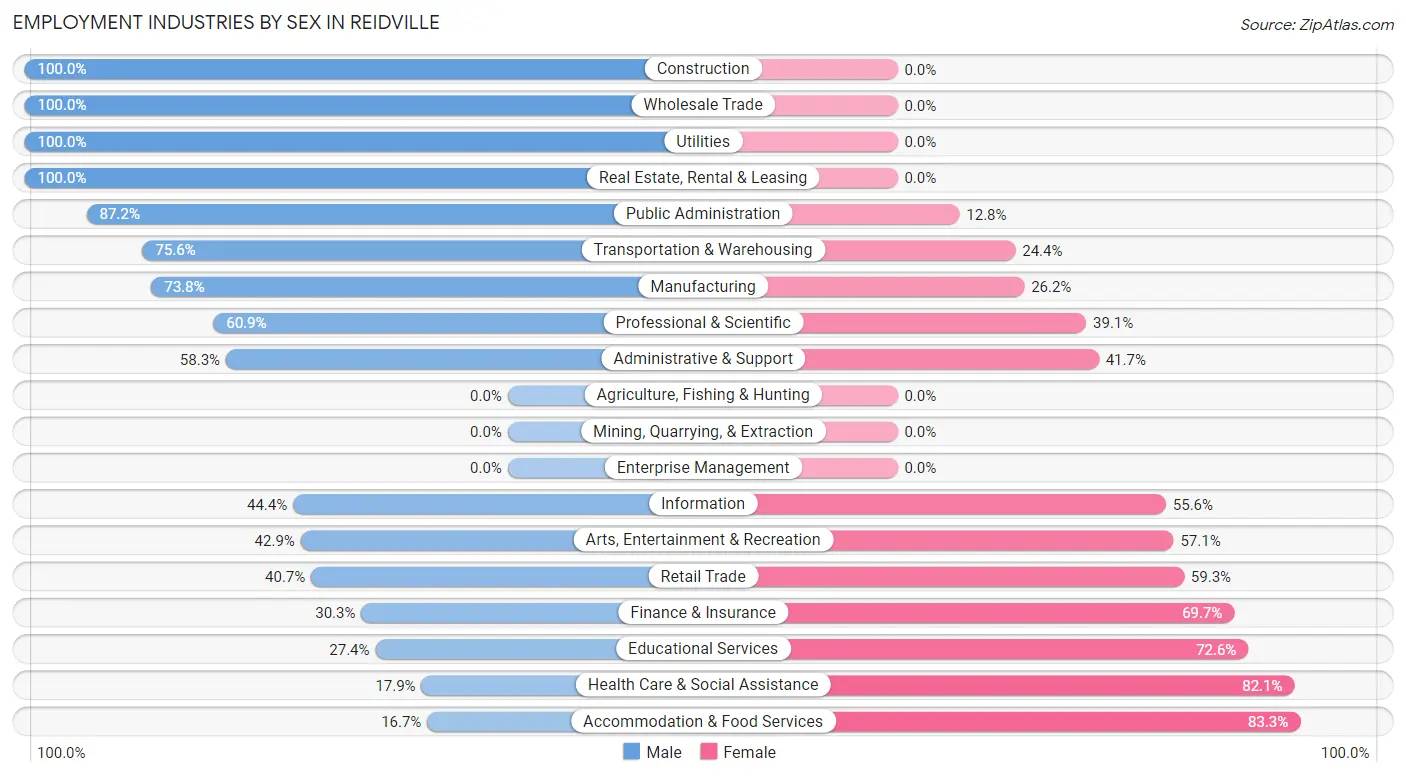
Employment Industries by Sex in Reidville
The Reidville industries that see more men than women are Construction (100.0%), Wholesale Trade (100.0%), and Utilities (100.0%), whereas the industries that tend to have a higher number of women are Accommodation & Food Services (83.3%), Health Care & Social Assistance (82.1%), and Educational Services (72.6%).
| Industry | Male | Female |
| Agriculture, Fishing & Hunting | 0 (0.0%) | 0 (0.0%) |
| Mining, Quarrying, & Extraction | 0 (0.0%) | 0 (0.0%) |
| Construction | 43 (100.0%) | 0 (0.0%) |
| Manufacturing | 149 (73.8%) | 53 (26.2%) |
| Wholesale Trade | 5 (100.0%) | 0 (0.0%) |
| Retail Trade | 35 (40.7%) | 51 (59.3%) |
| Transportation & Warehousing | 31 (75.6%) | 10 (24.4%) |
| Utilities | 11 (100.0%) | 0 (0.0%) |
| Information | 12 (44.4%) | 15 (55.6%) |
| Finance & Insurance | 10 (30.3%) | 23 (69.7%) |
| Real Estate, Rental & Leasing | 34 (100.0%) | 0 (0.0%) |
| Professional & Scientific | 39 (60.9%) | 25 (39.1%) |
| Enterprise Management | 0 (0.0%) | 0 (0.0%) |
| Administrative & Support | 7 (58.3%) | 5 (41.7%) |
| Educational Services | 20 (27.4%) | 53 (72.6%) |
| Health Care & Social Assistance | 35 (17.9%) | 161 (82.1%) |
| Arts, Entertainment & Recreation | 3 (42.9%) | 4 (57.1%) |
| Accommodation & Food Services | 5 (16.7%) | 25 (83.3%) |
| Public Administration | 34 (87.2%) | 5 (12.8%) |
| Total | 489 (52.6%) | 441 (47.4%) |
Education in Reidville
School Enrollment in Reidville
The most common levels of schooling among the 540 students in Reidville are high school (127 | 23.5%), elementary school (123 | 22.8%), and middle school (116 | 21.5%).
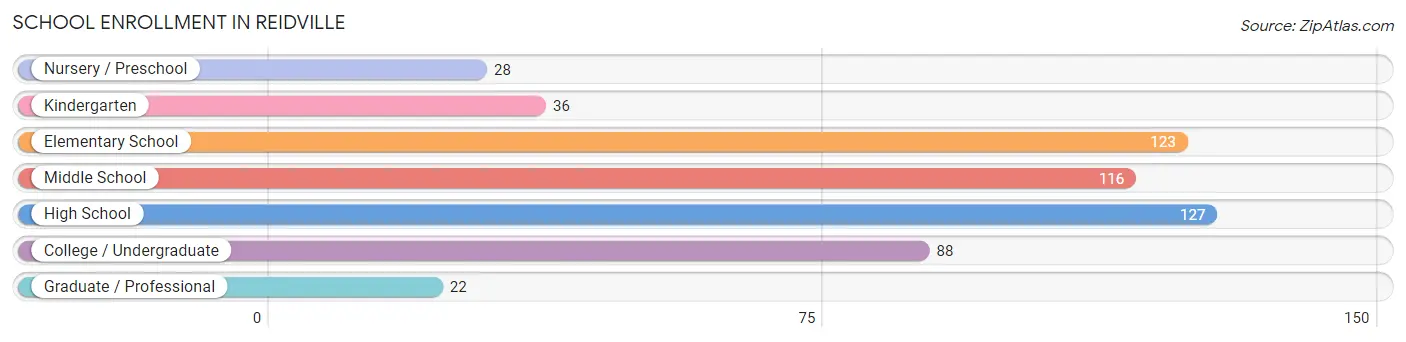
| School Level | # Students | % Students |
| Nursery / Preschool | 28 | 5.2% |
| Kindergarten | 36 | 6.7% |
| Elementary School | 123 | 22.8% |
| Middle School | 116 | 21.5% |
| High School | 127 | 23.5% |
| College / Undergraduate | 88 | 16.3% |
| Graduate / Professional | 22 | 4.1% |
| Total | 540 | 100.0% |
School Enrollment by Age by Funding Source in Reidville
Out of a total of 540 students who are enrolled in schools in Reidville, 58 (10.7%) attend a private institution, while the remaining 482 (89.3%) are enrolled in public schools. The age group of 3 to 4 year olds has the highest likelihood of being enrolled in private schools, with 14 (56.0% in the age bracket) enrolled. Conversely, the age group of 10 to 14 year olds has the lowest likelihood of being enrolled in a private school, with 155 (100.0% in the age bracket) attending a public institution.
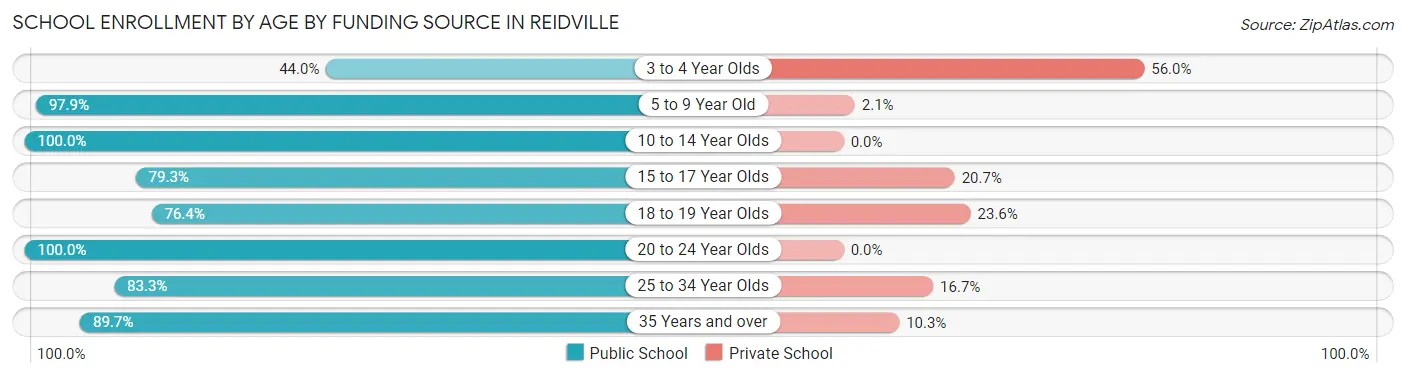
| Age Bracket | Public School | Private School |
| 3 to 4 Year Olds | 11 (44.0%) | 14 (56.0%) |
| 5 to 9 Year Old | 141 (97.9%) | 3 (2.1%) |
| 10 to 14 Year Olds | 155 (100.0%) | 0 (0.0%) |
| 15 to 17 Year Olds | 69 (79.3%) | 18 (20.7%) |
| 18 to 19 Year Olds | 42 (76.4%) | 13 (23.6%) |
| 20 to 24 Year Olds | 3 (100.0%) | 0 (0.0%) |
| 25 to 34 Year Olds | 35 (83.3%) | 7 (16.7%) |
| 35 Years and over | 26 (89.7%) | 3 (10.3%) |
| Total | 482 (89.3%) | 58 (10.7%) |
Educational Attainment by Field of Study in Reidville
Business (111 | 21.8%), engineering (92 | 18.1%), science & technology (69 | 13.6%), education (62 | 12.2%), and bio, nature & agricultural (34 | 6.7%) are the most common fields of study among 509 individuals in Reidville who have obtained a bachelor's degree or higher.
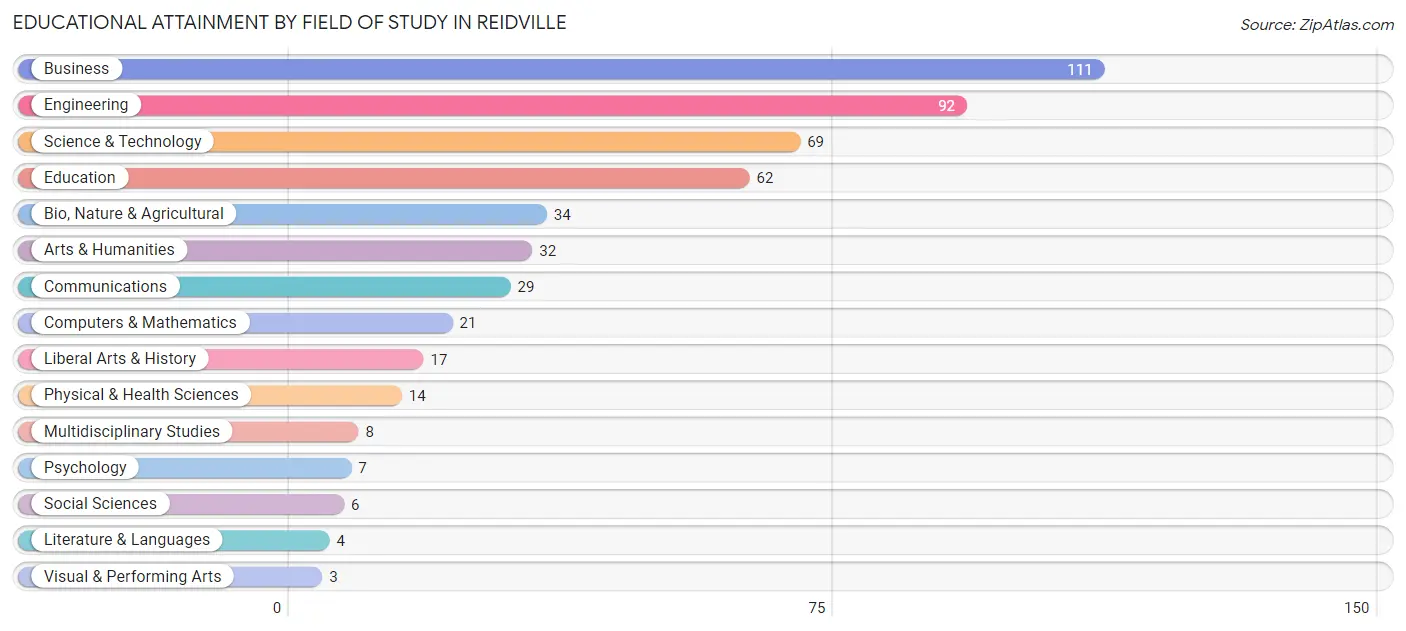
| Field of Study | # Graduates | % Graduates |
| Computers & Mathematics | 21 | 4.1% |
| Bio, Nature & Agricultural | 34 | 6.7% |
| Physical & Health Sciences | 14 | 2.8% |
| Psychology | 7 | 1.4% |
| Social Sciences | 6 | 1.2% |
| Engineering | 92 | 18.1% |
| Multidisciplinary Studies | 8 | 1.6% |
| Science & Technology | 69 | 13.6% |
| Business | 111 | 21.8% |
| Education | 62 | 12.2% |
| Literature & Languages | 4 | 0.8% |
| Liberal Arts & History | 17 | 3.3% |
| Visual & Performing Arts | 3 | 0.6% |
| Communications | 29 | 5.7% |
| Arts & Humanities | 32 | 6.3% |
| Total | 509 | 100.0% |
Transportation & Commute in Reidville
Vehicle Availability by Sex in Reidville
The most prevalent vehicle ownership categories in Reidville are males with 2 vehicles (206, accounting for 42.1%) and females with 2 vehicles (199, making up 47.8%).
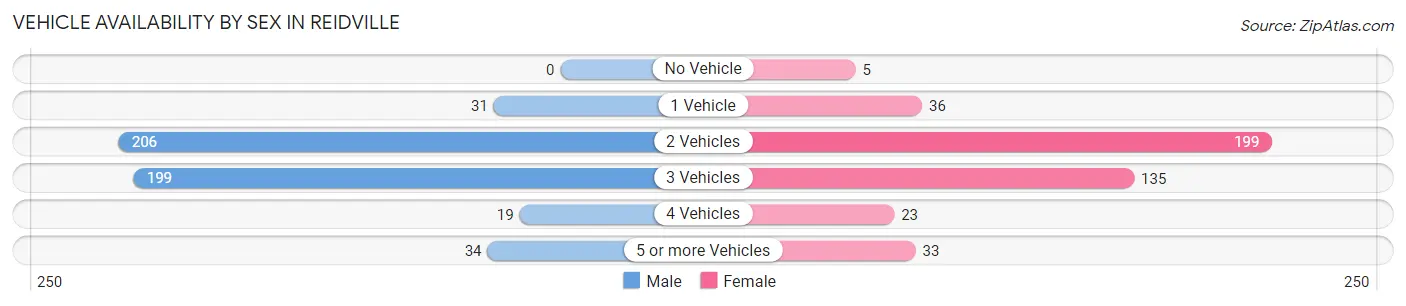
| Vehicles Available | Male | Female |
| No Vehicle | 0 (0.0%) | 5 (1.2%) |
| 1 Vehicle | 31 (6.3%) | 36 (8.4%) |
| 2 Vehicles | 206 (42.1%) | 199 (46.2%) |
| 3 Vehicles | 199 (40.7%) | 135 (31.3%) |
| 4 Vehicles | 19 (3.9%) | 23 (5.3%) |
| 5 or more Vehicles | 34 (7.0%) | 33 (7.7%) |
| Total | 489 (100.0%) | 431 (100.0%) |
Commute Time in Reidville
The most frequently occuring commute durations in Reidville are 30 to 34 minutes (198 commuters, 22.7%), 20 to 24 minutes (165 commuters, 18.9%), and 10 to 14 minutes (115 commuters, 13.2%).
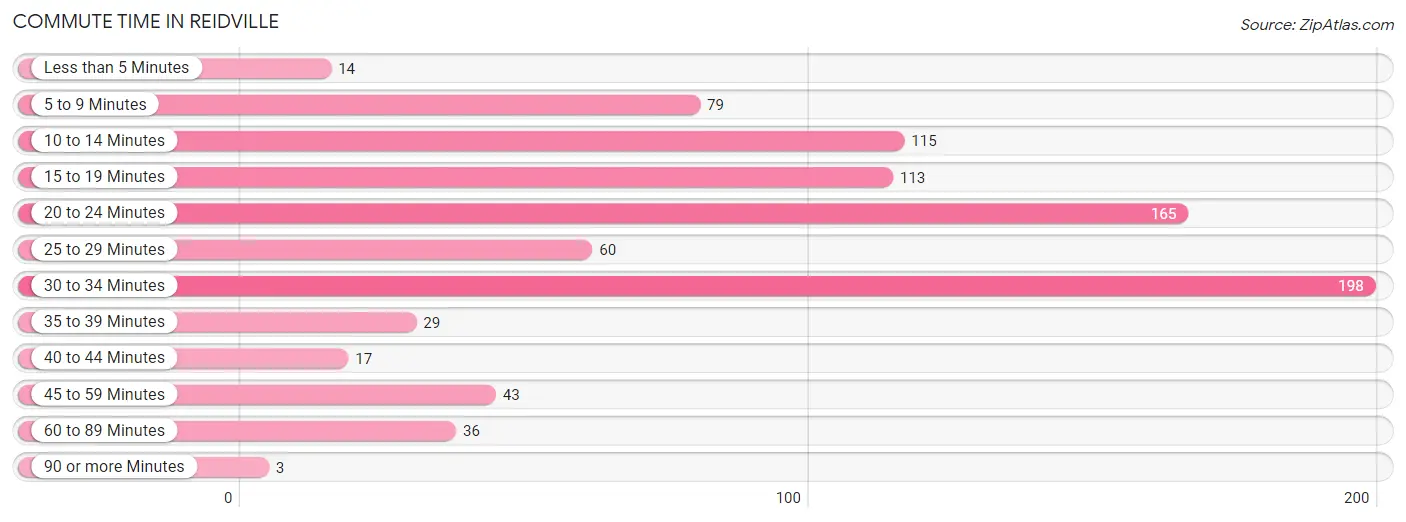
| Commute Time | # Commuters | % Commuters |
| Less than 5 Minutes | 14 | 1.6% |
| 5 to 9 Minutes | 79 | 9.1% |
| 10 to 14 Minutes | 115 | 13.2% |
| 15 to 19 Minutes | 113 | 13.0% |
| 20 to 24 Minutes | 165 | 18.9% |
| 25 to 29 Minutes | 60 | 6.9% |
| 30 to 34 Minutes | 198 | 22.7% |
| 35 to 39 Minutes | 29 | 3.3% |
| 40 to 44 Minutes | 17 | 1.9% |
| 45 to 59 Minutes | 43 | 4.9% |
| 60 to 89 Minutes | 36 | 4.1% |
| 90 or more Minutes | 3 | 0.3% |
Commute Time by Sex in Reidville
The most common commute times in Reidville are 30 to 34 minutes (111 commuters, 23.9%) for males and 30 to 34 minutes (87 commuters, 21.4%) for females.
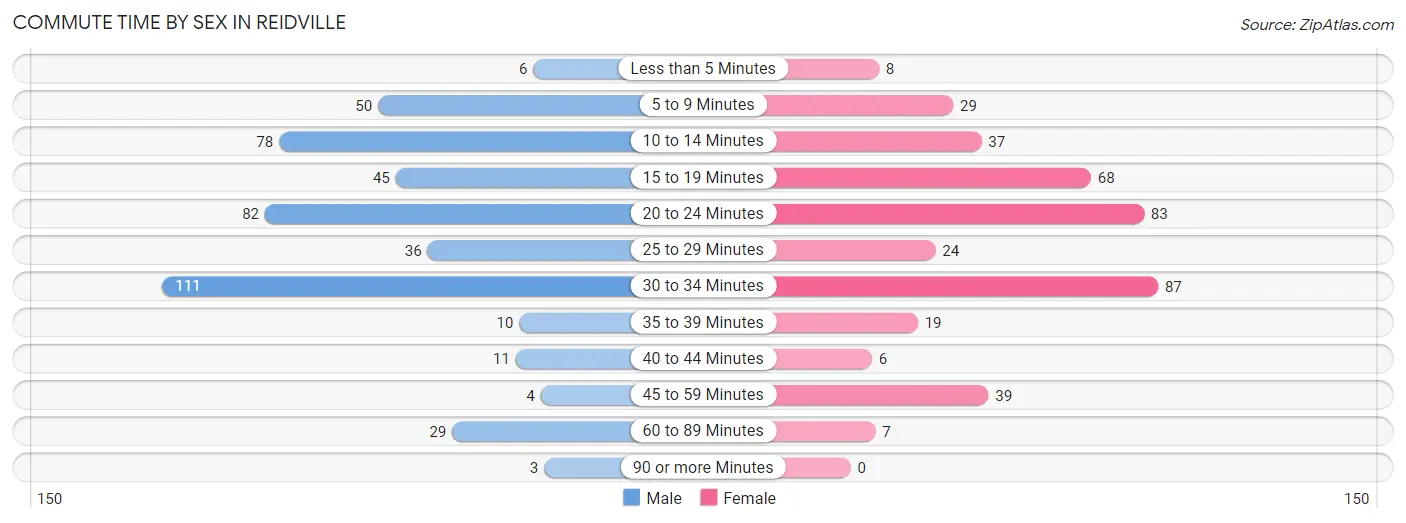
| Commute Time | Male | Female |
| Less than 5 Minutes | 6 (1.3%) | 8 (2.0%) |
| 5 to 9 Minutes | 50 (10.7%) | 29 (7.1%) |
| 10 to 14 Minutes | 78 (16.8%) | 37 (9.1%) |
| 15 to 19 Minutes | 45 (9.7%) | 68 (16.7%) |
| 20 to 24 Minutes | 82 (17.6%) | 83 (20.4%) |
| 25 to 29 Minutes | 36 (7.7%) | 24 (5.9%) |
| 30 to 34 Minutes | 111 (23.9%) | 87 (21.4%) |
| 35 to 39 Minutes | 10 (2.1%) | 19 (4.7%) |
| 40 to 44 Minutes | 11 (2.4%) | 6 (1.5%) |
| 45 to 59 Minutes | 4 (0.9%) | 39 (9.6%) |
| 60 to 89 Minutes | 29 (6.2%) | 7 (1.7%) |
| 90 or more Minutes | 3 (0.6%) | 0 (0.0%) |
Time of Departure to Work by Sex in Reidville
The most frequent times of departure to work in Reidville are 7:00 AM to 7:29 AM (128, 27.5%) for males and 8:00 AM to 8:29 AM (80, 19.7%) for females.
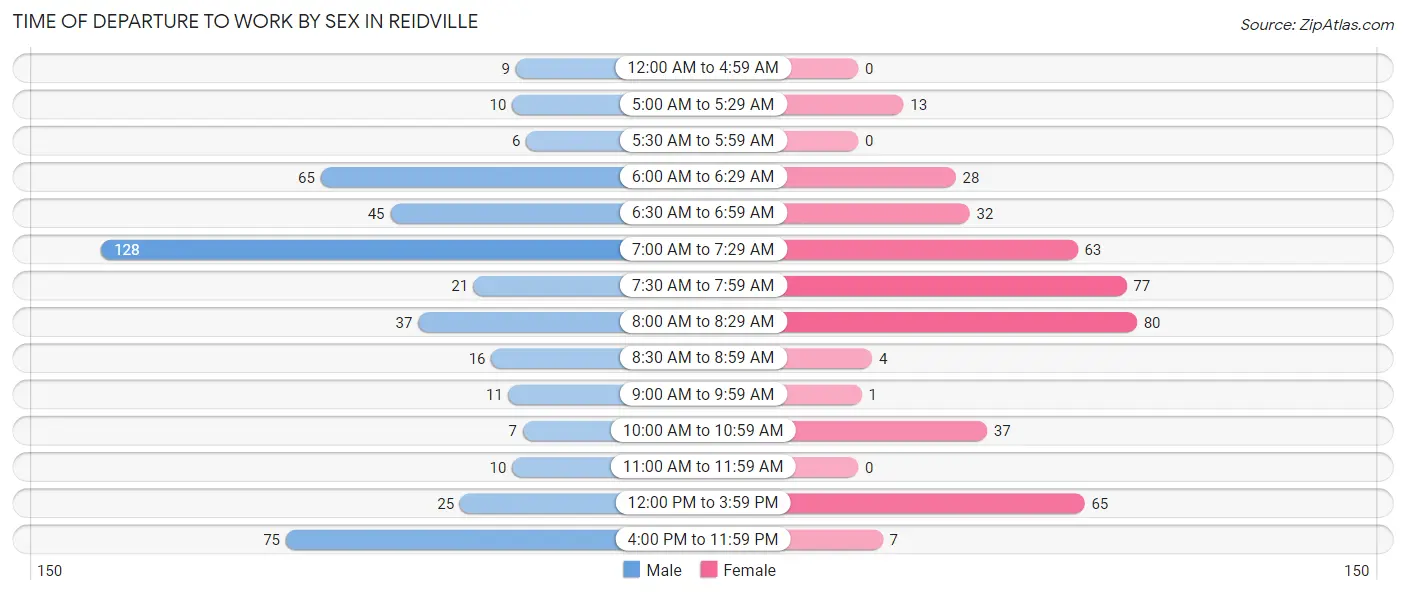
| Time of Departure | Male | Female |
| 12:00 AM to 4:59 AM | 9 (1.9%) | 0 (0.0%) |
| 5:00 AM to 5:29 AM | 10 (2.1%) | 13 (3.2%) |
| 5:30 AM to 5:59 AM | 6 (1.3%) | 0 (0.0%) |
| 6:00 AM to 6:29 AM | 65 (14.0%) | 28 (6.9%) |
| 6:30 AM to 6:59 AM | 45 (9.7%) | 32 (7.9%) |
| 7:00 AM to 7:29 AM | 128 (27.5%) | 63 (15.5%) |
| 7:30 AM to 7:59 AM | 21 (4.5%) | 77 (18.9%) |
| 8:00 AM to 8:29 AM | 37 (8.0%) | 80 (19.7%) |
| 8:30 AM to 8:59 AM | 16 (3.4%) | 4 (1.0%) |
| 9:00 AM to 9:59 AM | 11 (2.4%) | 1 (0.3%) |
| 10:00 AM to 10:59 AM | 7 (1.5%) | 37 (9.1%) |
| 11:00 AM to 11:59 AM | 10 (2.1%) | 0 (0.0%) |
| 12:00 PM to 3:59 PM | 25 (5.4%) | 65 (16.0%) |
| 4:00 PM to 11:59 PM | 75 (16.1%) | 7 (1.7%) |
| Total | 465 (100.0%) | 407 (100.0%) |
Housing Occupancy in Reidville
Occupancy by Ownership in Reidville
Of the total 545 dwellings in Reidville, owner-occupied units account for 511 (93.8%), while renter-occupied units make up 34 (6.2%).
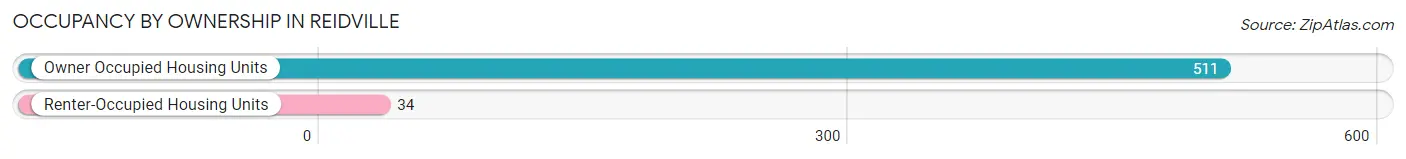
| Occupancy | # Housing Units | % Housing Units |
| Owner Occupied Housing Units | 511 | 93.8% |
| Renter-Occupied Housing Units | 34 | 6.2% |
| Total Occupied Housing Units | 545 | 100.0% |
Occupancy by Household Size in Reidville
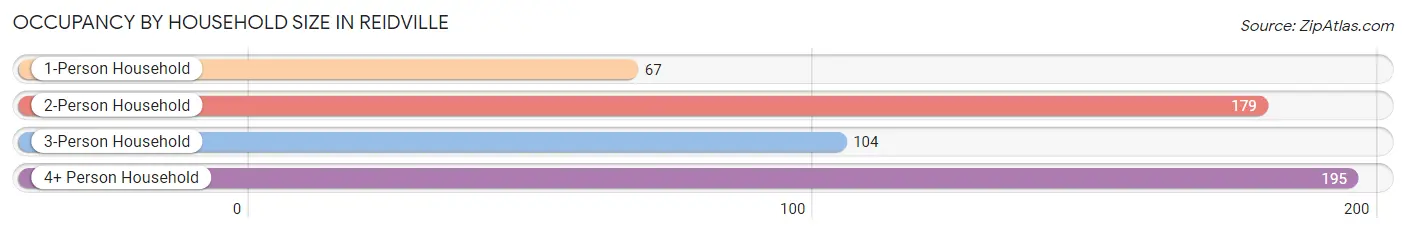
| Household Size | # Housing Units | % Housing Units |
| 1-Person Household | 67 | 12.3% |
| 2-Person Household | 179 | 32.8% |
| 3-Person Household | 104 | 19.1% |
| 4+ Person Household | 195 | 35.8% |
| Total Housing Units | 545 | 100.0% |
Occupancy by Ownership by Household Size in Reidville
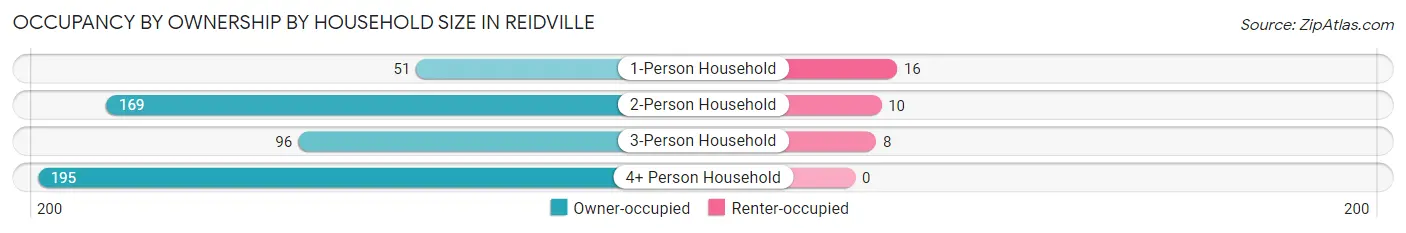
| Household Size | Owner-occupied | Renter-occupied |
| 1-Person Household | 51 (76.1%) | 16 (23.9%) |
| 2-Person Household | 169 (94.4%) | 10 (5.6%) |
| 3-Person Household | 96 (92.3%) | 8 (7.7%) |
| 4+ Person Household | 195 (100.0%) | 0 (0.0%) |
| Total Housing Units | 511 (93.8%) | 34 (6.2%) |
Occupancy by Educational Attainment in Reidville
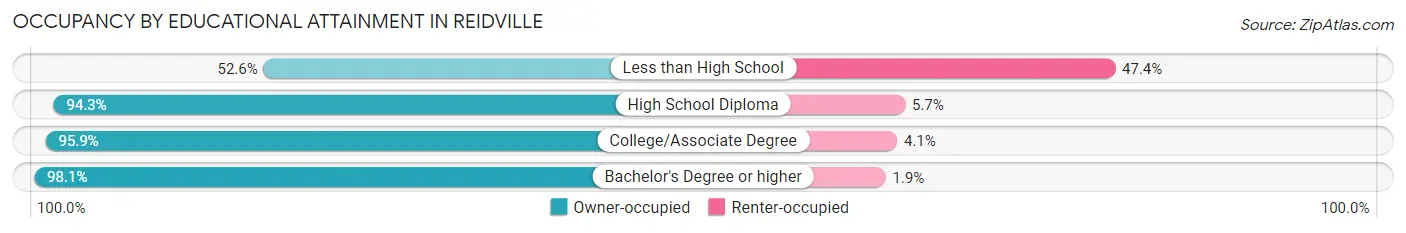
| Household Size | Owner-occupied | Renter-occupied |
| Less than High School | 20 (52.6%) | 18 (47.4%) |
| High School Diploma | 66 (94.3%) | 4 (5.7%) |
| College/Associate Degree | 162 (95.9%) | 7 (4.1%) |
| Bachelor's Degree or higher | 263 (98.1%) | 5 (1.9%) |
Occupancy by Age of Householder in Reidville
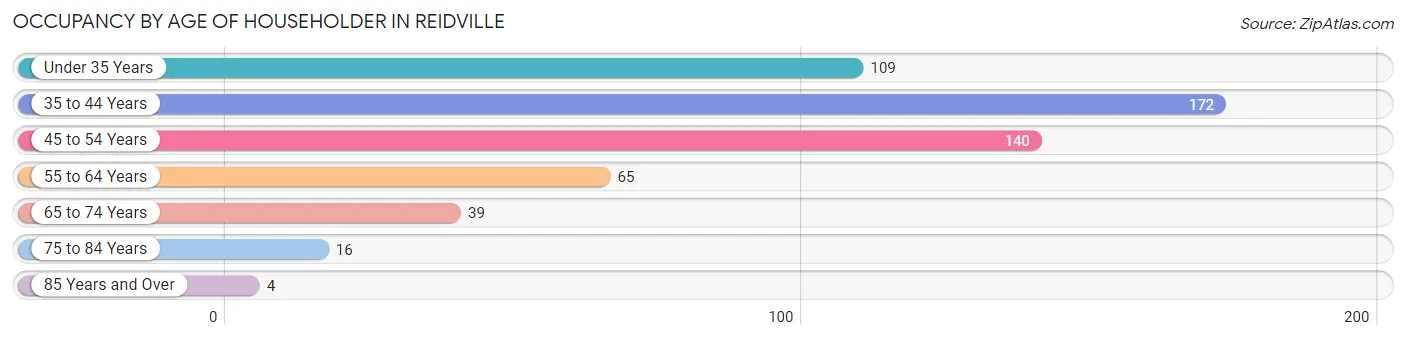
| Age Bracket | # Households | % Households |
| Under 35 Years | 109 | 20.0% |
| 35 to 44 Years | 172 | 31.6% |
| 45 to 54 Years | 140 | 25.7% |
| 55 to 64 Years | 65 | 11.9% |
| 65 to 74 Years | 39 | 7.2% |
| 75 to 84 Years | 16 | 2.9% |
| 85 Years and Over | 4 | 0.7% |
| Total | 545 | 100.0% |
Housing Finances in Reidville
Median Income by Occupancy in Reidville
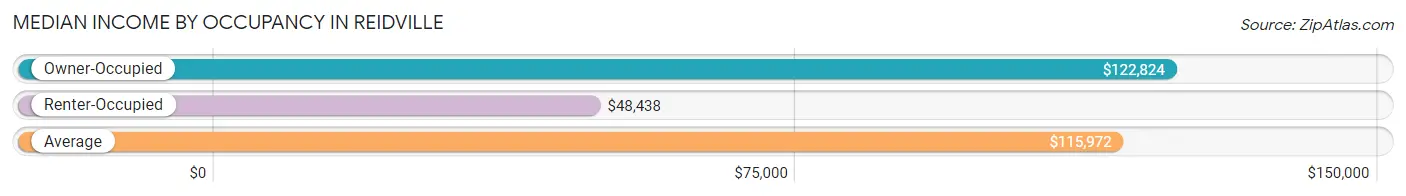
| Occupancy Type | # Households | Median Income |
| Owner-Occupied | 511 (93.8%) | $122,824 |
| Renter-Occupied | 34 (6.2%) | $48,438 |
| Average | 545 (100.0%) | $115,972 |
Occupancy by Householder Income Bracket in Reidville
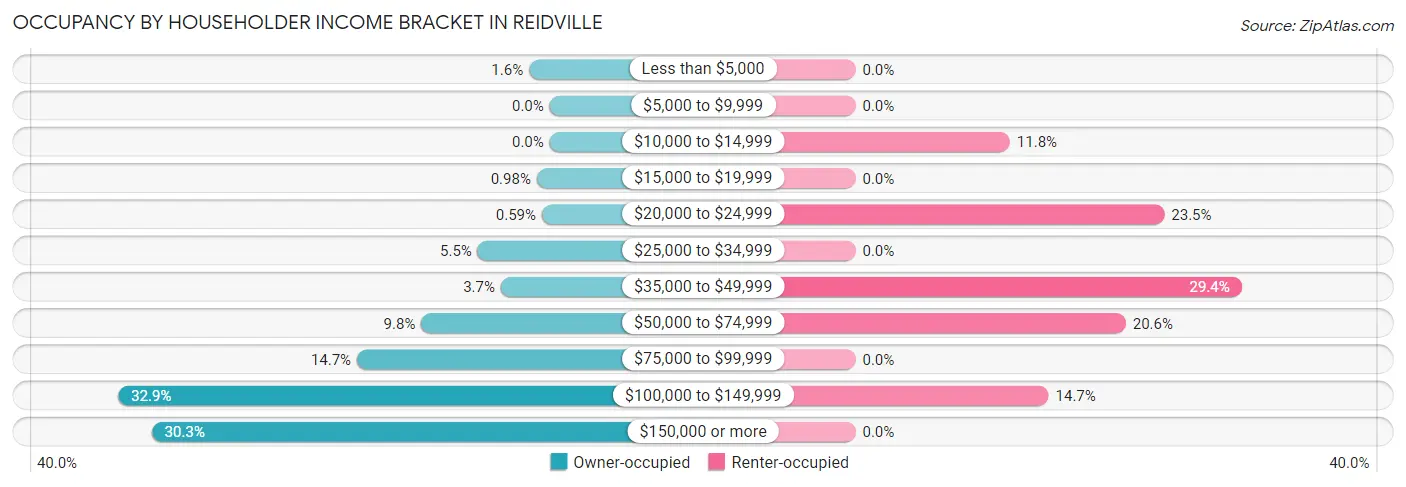
| Income Bracket | Owner-occupied | Renter-occupied |
| Less than $5,000 | 8 (1.6%) | 0 (0.0%) |
| $5,000 to $9,999 | 0 (0.0%) | 0 (0.0%) |
| $10,000 to $14,999 | 0 (0.0%) | 4 (11.8%) |
| $15,000 to $19,999 | 5 (1.0%) | 0 (0.0%) |
| $20,000 to $24,999 | 3 (0.6%) | 8 (23.5%) |
| $25,000 to $34,999 | 28 (5.5%) | 0 (0.0%) |
| $35,000 to $49,999 | 19 (3.7%) | 10 (29.4%) |
| $50,000 to $74,999 | 50 (9.8%) | 7 (20.6%) |
| $75,000 to $99,999 | 75 (14.7%) | 0 (0.0%) |
| $100,000 to $149,999 | 168 (32.9%) | 5 (14.7%) |
| $150,000 or more | 155 (30.3%) | 0 (0.0%) |
| Total | 511 (100.0%) | 34 (100.0%) |
Monthly Housing Cost Tiers in Reidville
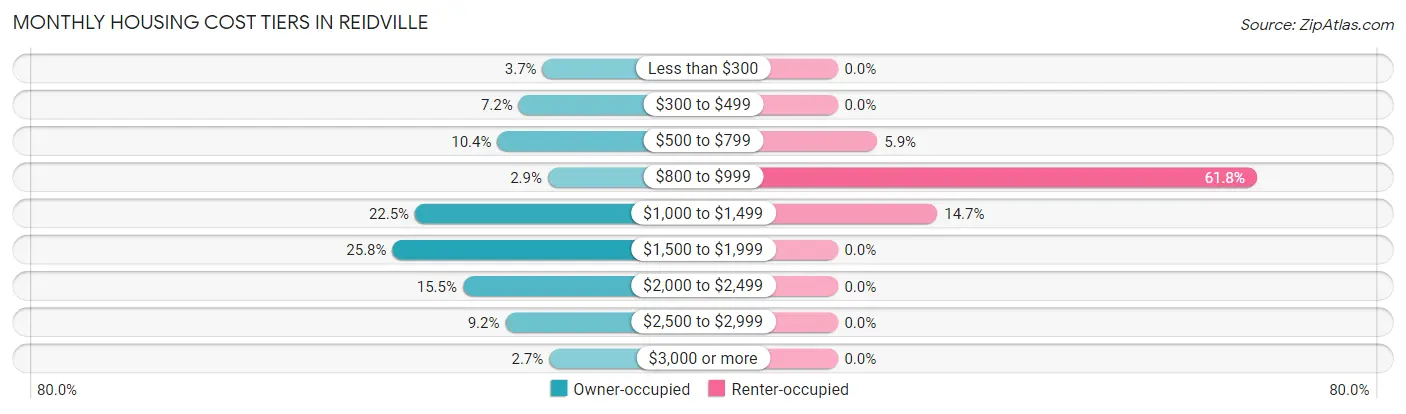
| Monthly Cost | Owner-occupied | Renter-occupied |
| Less than $300 | 19 (3.7%) | 0 (0.0%) |
| $300 to $499 | 37 (7.2%) | 0 (0.0%) |
| $500 to $799 | 53 (10.4%) | 2 (5.9%) |
| $800 to $999 | 15 (2.9%) | 21 (61.8%) |
| $1,000 to $1,499 | 115 (22.5%) | 5 (14.7%) |
| $1,500 to $1,999 | 132 (25.8%) | 0 (0.0%) |
| $2,000 to $2,499 | 79 (15.5%) | 0 (0.0%) |
| $2,500 to $2,999 | 47 (9.2%) | 0 (0.0%) |
| $3,000 or more | 14 (2.7%) | 0 (0.0%) |
| Total | 511 (100.0%) | 34 (100.0%) |
Physical Housing Characteristics in Reidville
Housing Structures in Reidville
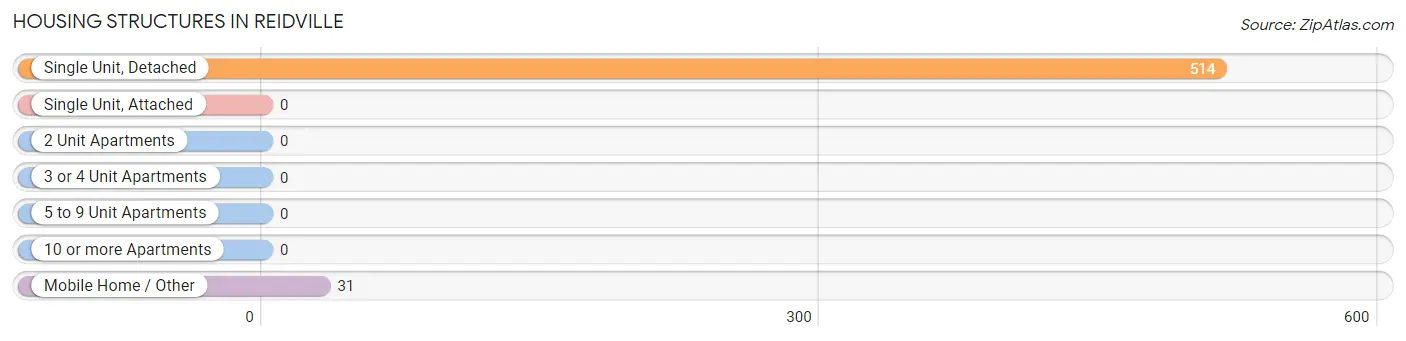
| Structure Type | # Housing Units | % Housing Units |
| Single Unit, Detached | 514 | 94.3% |
| Single Unit, Attached | 0 | 0.0% |
| 2 Unit Apartments | 0 | 0.0% |
| 3 or 4 Unit Apartments | 0 | 0.0% |
| 5 to 9 Unit Apartments | 0 | 0.0% |
| 10 or more Apartments | 0 | 0.0% |
| Mobile Home / Other | 31 | 5.7% |
| Total | 545 | 100.0% |
Housing Structures by Occupancy in Reidville
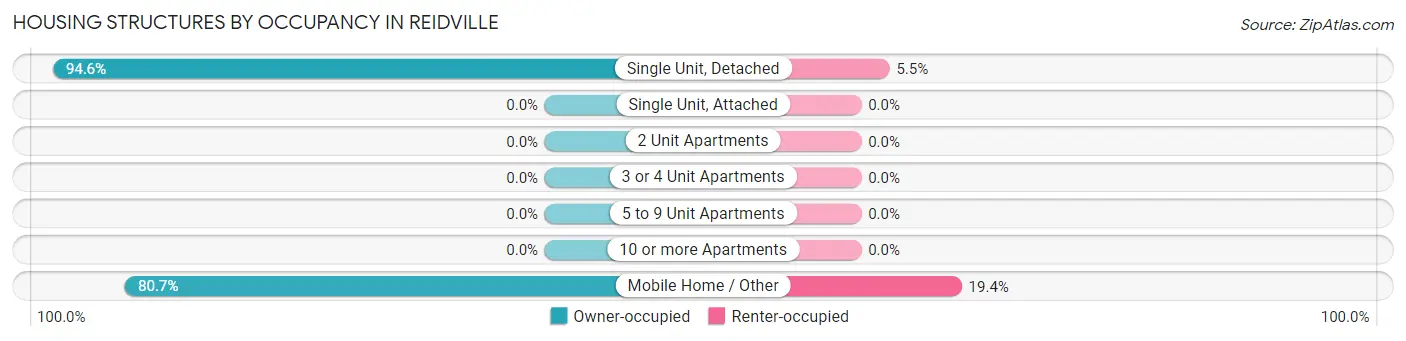
| Structure Type | Owner-occupied | Renter-occupied |
| Single Unit, Detached | 486 (94.6%) | 28 (5.4%) |
| Single Unit, Attached | 0 (0.0%) | 0 (0.0%) |
| 2 Unit Apartments | 0 (0.0%) | 0 (0.0%) |
| 3 or 4 Unit Apartments | 0 (0.0%) | 0 (0.0%) |
| 5 to 9 Unit Apartments | 0 (0.0%) | 0 (0.0%) |
| 10 or more Apartments | 0 (0.0%) | 0 (0.0%) |
| Mobile Home / Other | 25 (80.6%) | 6 (19.4%) |
| Total | 511 (93.8%) | 34 (6.2%) |
Housing Structures by Number of Rooms in Reidville
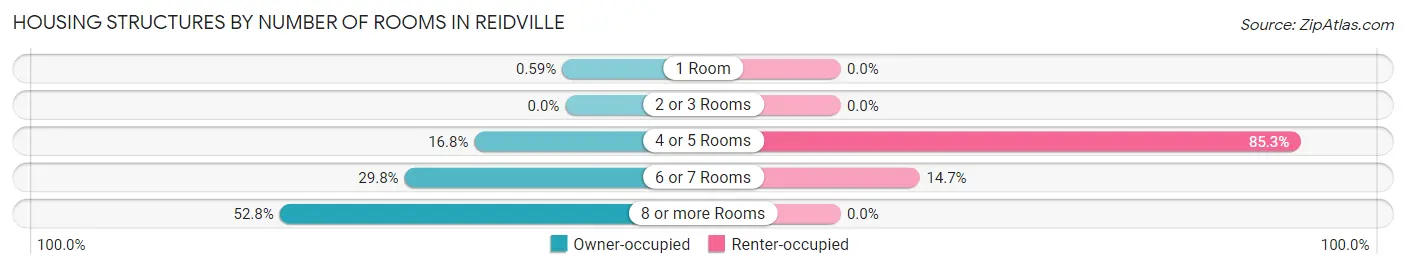
| Number of Rooms | Owner-occupied | Renter-occupied |
| 1 Room | 3 (0.6%) | 0 (0.0%) |
| 2 or 3 Rooms | 0 (0.0%) | 0 (0.0%) |
| 4 or 5 Rooms | 86 (16.8%) | 29 (85.3%) |
| 6 or 7 Rooms | 152 (29.7%) | 5 (14.7%) |
| 8 or more Rooms | 270 (52.8%) | 0 (0.0%) |
| Total | 511 (100.0%) | 34 (100.0%) |
Housing Structure by Heating Type in Reidville
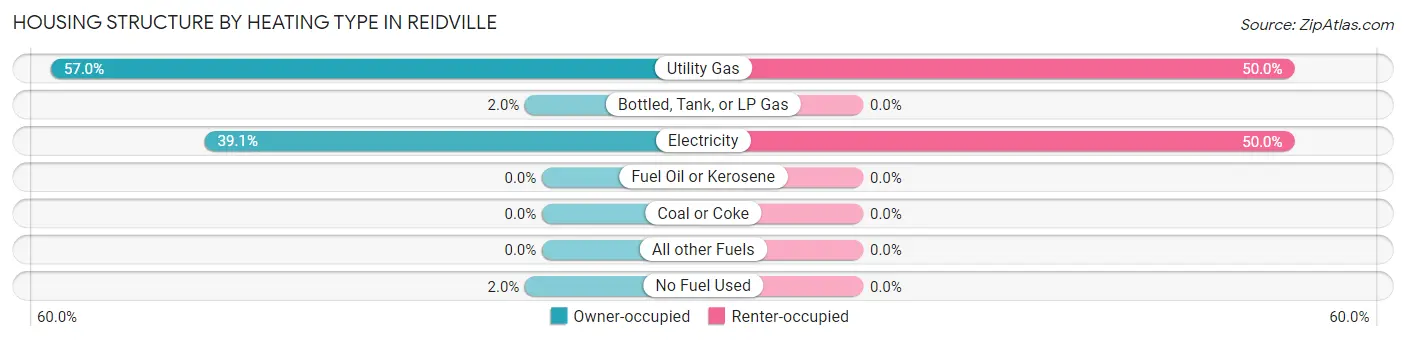
| Heating Type | Owner-occupied | Renter-occupied |
| Utility Gas | 291 (57.0%) | 17 (50.0%) |
| Bottled, Tank, or LP Gas | 10 (2.0%) | 0 (0.0%) |
| Electricity | 200 (39.1%) | 17 (50.0%) |
| Fuel Oil or Kerosene | 0 (0.0%) | 0 (0.0%) |
| Coal or Coke | 0 (0.0%) | 0 (0.0%) |
| All other Fuels | 0 (0.0%) | 0 (0.0%) |
| No Fuel Used | 10 (2.0%) | 0 (0.0%) |
| Total | 511 (100.0%) | 34 (100.0%) |
Household Vehicle Usage in Reidville
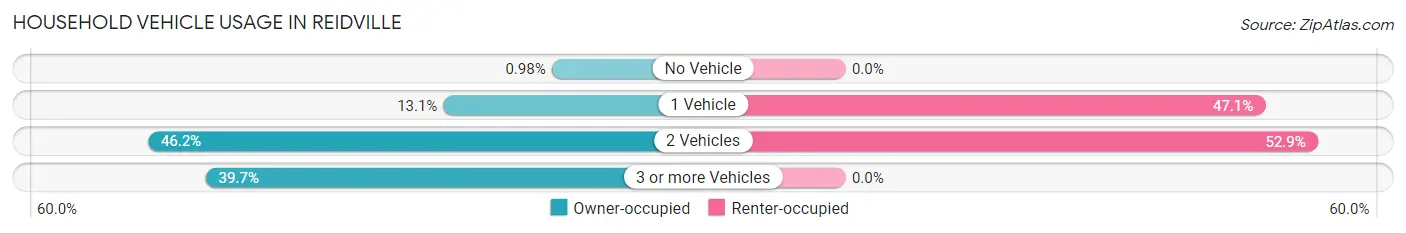
| Vehicles per Household | Owner-occupied | Renter-occupied |
| No Vehicle | 5 (1.0%) | 0 (0.0%) |
| 1 Vehicle | 67 (13.1%) | 16 (47.1%) |
| 2 Vehicles | 236 (46.2%) | 18 (52.9%) |
| 3 or more Vehicles | 203 (39.7%) | 0 (0.0%) |
| Total | 511 (100.0%) | 34 (100.0%) |
Real Estate & Mortgages in Reidville
Real Estate and Mortgage Overview in Reidville
| Characteristic | Without Mortgage | With Mortgage |
| Housing Units | 103 | 408 |
| Median Property Value | $271,300 | $315,700 |
| Median Household Income | $110,515 | $142 |
| Monthly Housing Costs | $397 | $14 |
| Real Estate Taxes | $1,350 | $0 |
Property Value by Mortgage Status in Reidville
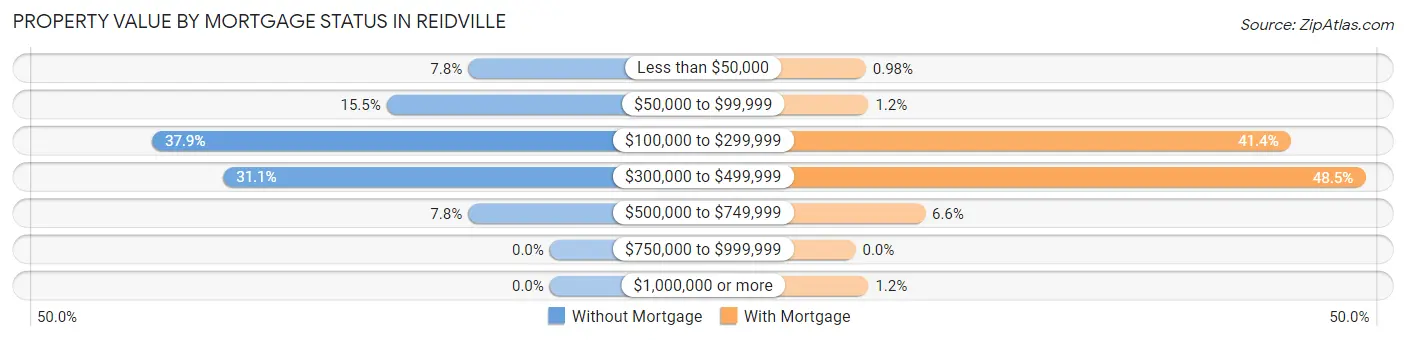
| Property Value | Without Mortgage | With Mortgage |
| Less than $50,000 | 8 (7.8%) | 4 (1.0%) |
| $50,000 to $99,999 | 16 (15.5%) | 5 (1.2%) |
| $100,000 to $299,999 | 39 (37.9%) | 169 (41.4%) |
| $300,000 to $499,999 | 32 (31.1%) | 198 (48.5%) |
| $500,000 to $749,999 | 8 (7.8%) | 27 (6.6%) |
| $750,000 to $999,999 | 0 (0.0%) | 0 (0.0%) |
| $1,000,000 or more | 0 (0.0%) | 5 (1.2%) |
| Total | 103 (100.0%) | 408 (100.0%) |
Household Income by Mortgage Status in Reidville
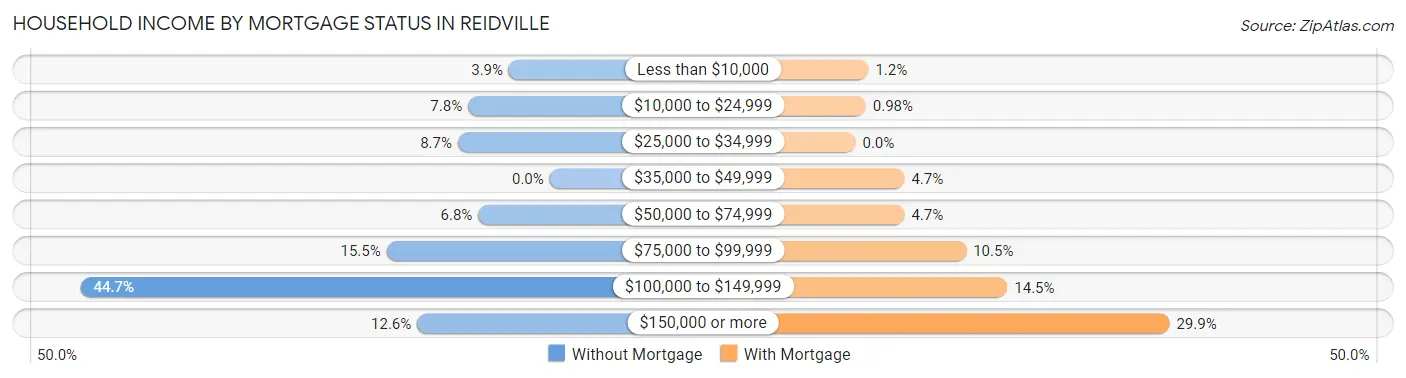
| Household Income | Without Mortgage | With Mortgage |
| Less than $10,000 | 4 (3.9%) | 5 (1.2%) |
| $10,000 to $24,999 | 8 (7.8%) | 4 (1.0%) |
| $25,000 to $34,999 | 9 (8.7%) | 0 (0.0%) |
| $35,000 to $49,999 | 0 (0.0%) | 19 (4.7%) |
| $50,000 to $74,999 | 7 (6.8%) | 19 (4.7%) |
| $75,000 to $99,999 | 16 (15.5%) | 43 (10.5%) |
| $100,000 to $149,999 | 46 (44.7%) | 59 (14.5%) |
| $150,000 or more | 13 (12.6%) | 122 (29.9%) |
| Total | 103 (100.0%) | 408 (100.0%) |
Property Value to Household Income Ratio in Reidville
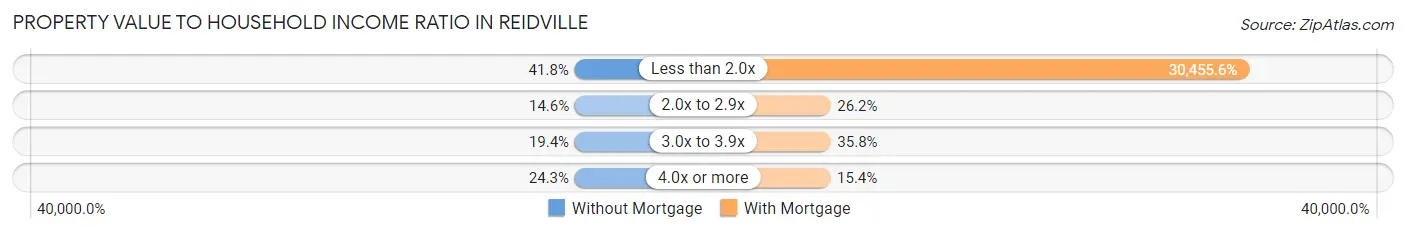
| Value-to-Income Ratio | Without Mortgage | With Mortgage |
| Less than 2.0x | 43 (41.7%) | 124,259 (30,455.6%) |
| 2.0x to 2.9x | 15 (14.6%) | 107 (26.2%) |
| 3.0x to 3.9x | 20 (19.4%) | 146 (35.8%) |
| 4.0x or more | 25 (24.3%) | 63 (15.4%) |
| Total | 103 (100.0%) | 408 (100.0%) |
Real Estate Taxes by Mortgage Status in Reidville
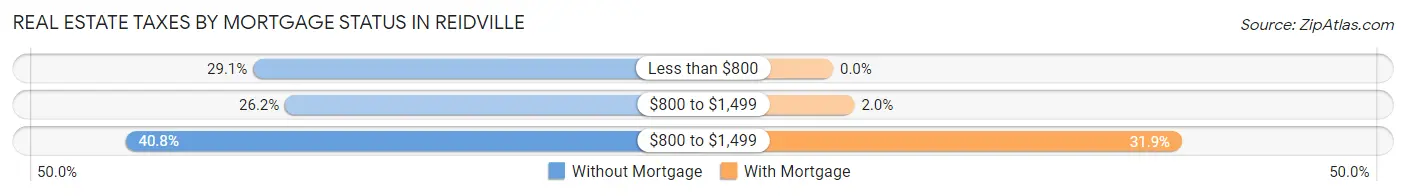
| Property Taxes | Without Mortgage | With Mortgage |
| Less than $800 | 30 (29.1%) | 0 (0.0%) |
| $800 to $1,499 | 27 (26.2%) | 8 (2.0%) |
| $800 to $1,499 | 42 (40.8%) | 130 (31.9%) |
| Total | 103 (100.0%) | 408 (100.0%) |
Health & Disability in Reidville
Health Insurance Coverage by Age in Reidville
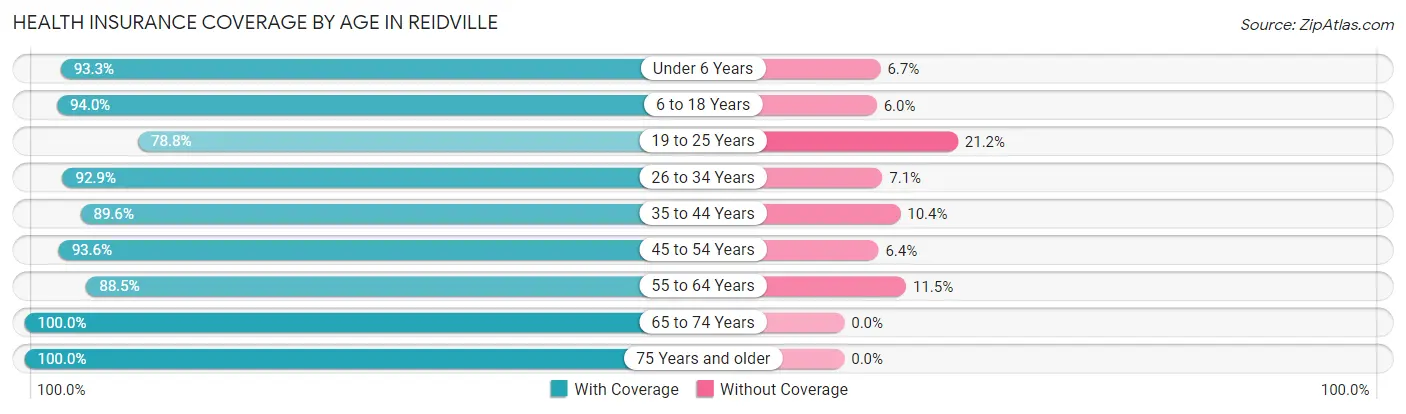
| Age Bracket | With Coverage | Without Coverage |
| Under 6 Years | 166 (93.3%) | 12 (6.7%) |
| 6 to 18 Years | 358 (94.0%) | 23 (6.0%) |
| 19 to 25 Years | 67 (78.8%) | 18 (21.2%) |
| 26 to 34 Years | 236 (92.9%) | 18 (7.1%) |
| 35 to 44 Years | 266 (89.6%) | 31 (10.4%) |
| 45 to 54 Years | 250 (93.6%) | 17 (6.4%) |
| 55 to 64 Years | 123 (88.5%) | 16 (11.5%) |
| 65 to 74 Years | 103 (100.0%) | 0 (0.0%) |
| 75 Years and older | 30 (100.0%) | 0 (0.0%) |
| Total | 1,599 (92.2%) | 135 (7.8%) |
Health Insurance Coverage by Citizenship Status in Reidville
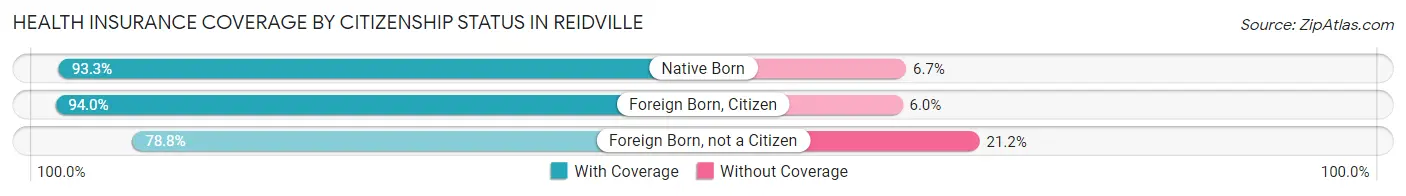
| Citizenship Status | With Coverage | Without Coverage |
| Native Born | 166 (93.3%) | 12 (6.7%) |
| Foreign Born, Citizen | 358 (94.0%) | 23 (6.0%) |
| Foreign Born, not a Citizen | 67 (78.8%) | 18 (21.2%) |
Health Insurance Coverage by Household Income in Reidville
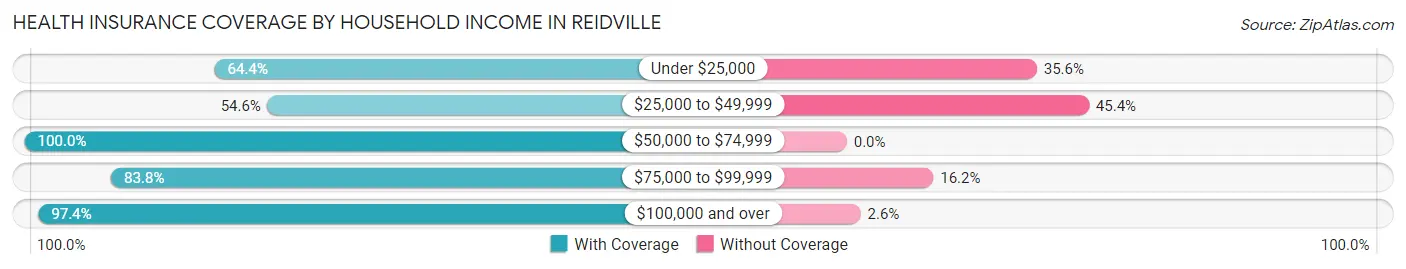
| Household Income | With Coverage | Without Coverage |
| Under $25,000 | 38 (64.4%) | 21 (35.6%) |
| $25,000 to $49,999 | 53 (54.6%) | 44 (45.4%) |
| $50,000 to $74,999 | 200 (100.0%) | 0 (0.0%) |
| $75,000 to $99,999 | 212 (83.8%) | 41 (16.2%) |
| $100,000 and over | 1,096 (97.4%) | 29 (2.6%) |
Public vs Private Health Insurance Coverage by Age in Reidville
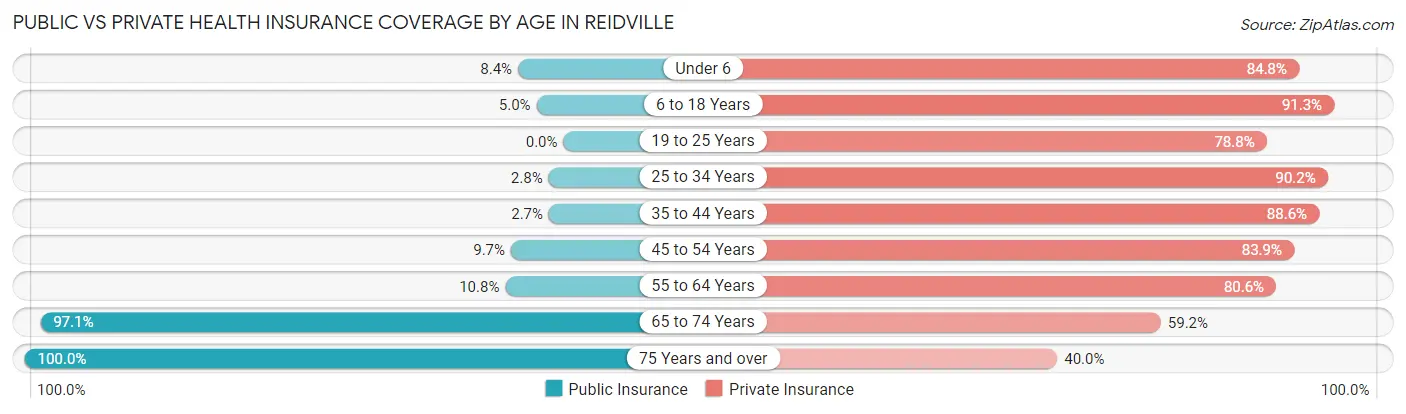
| Age Bracket | Public Insurance | Private Insurance |
| Under 6 | 15 (8.4%) | 151 (84.8%) |
| 6 to 18 Years | 19 (5.0%) | 348 (91.3%) |
| 19 to 25 Years | 0 (0.0%) | 67 (78.8%) |
| 25 to 34 Years | 7 (2.8%) | 229 (90.2%) |
| 35 to 44 Years | 8 (2.7%) | 263 (88.5%) |
| 45 to 54 Years | 26 (9.7%) | 224 (83.9%) |
| 55 to 64 Years | 15 (10.8%) | 112 (80.6%) |
| 65 to 74 Years | 100 (97.1%) | 61 (59.2%) |
| 75 Years and over | 30 (100.0%) | 12 (40.0%) |
| Total | 220 (12.7%) | 1,467 (84.6%) |
Disability Status by Sex by Age in Reidville
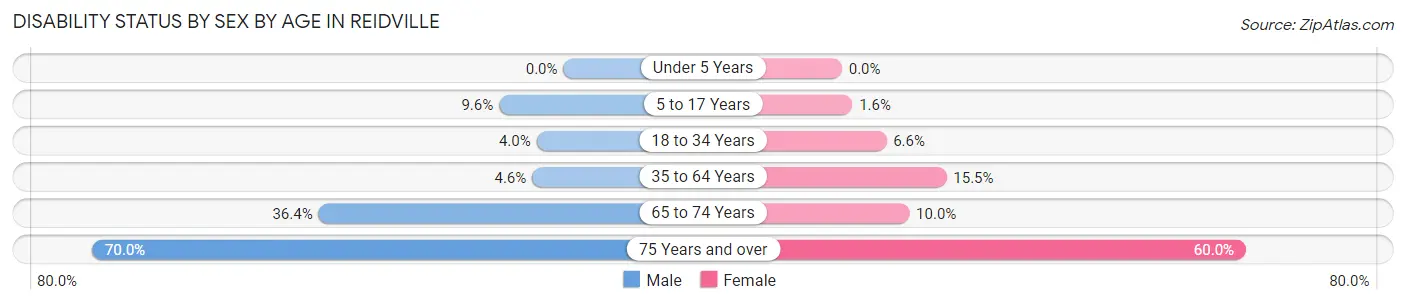
| Age Bracket | Male | Female |
| Under 5 Years | 0 (0.0%) | 0 (0.0%) |
| 5 to 17 Years | 19 (9.6%) | 3 (1.5%) |
| 18 to 34 Years | 7 (4.0%) | 12 (6.6%) |
| 35 to 64 Years | 15 (4.6%) | 59 (15.5%) |
| 65 to 74 Years | 12 (36.4%) | 7 (10.0%) |
| 75 Years and over | 14 (70.0%) | 6 (60.0%) |
Disability Class by Sex by Age in Reidville
Disability Class: Hearing Difficulty
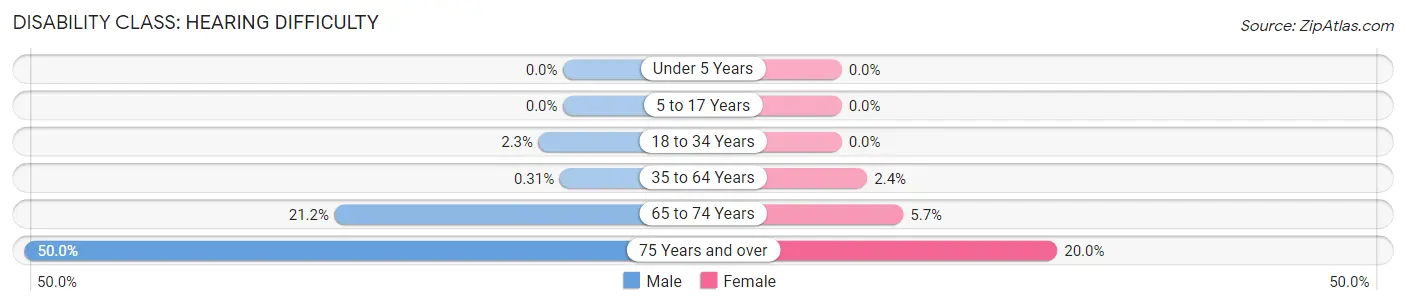
| Age Bracket | Male | Female |
| Under 5 Years | 0 (0.0%) | 0 (0.0%) |
| 5 to 17 Years | 0 (0.0%) | 0 (0.0%) |
| 18 to 34 Years | 4 (2.3%) | 0 (0.0%) |
| 35 to 64 Years | 1 (0.3%) | 9 (2.4%) |
| 65 to 74 Years | 7 (21.2%) | 4 (5.7%) |
| 75 Years and over | 10 (50.0%) | 2 (20.0%) |
Disability Class: Vision Difficulty
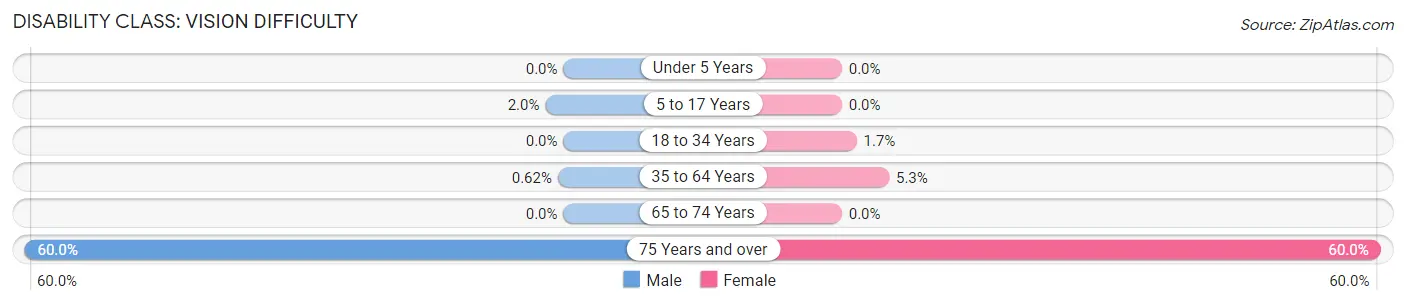
| Age Bracket | Male | Female |
| Under 5 Years | 0 (0.0%) | 0 (0.0%) |
| 5 to 17 Years | 4 (2.0%) | 0 (0.0%) |
| 18 to 34 Years | 0 (0.0%) | 3 (1.7%) |
| 35 to 64 Years | 2 (0.6%) | 20 (5.3%) |
| 65 to 74 Years | 0 (0.0%) | 0 (0.0%) |
| 75 Years and over | 12 (60.0%) | 6 (60.0%) |
Disability Class: Cognitive Difficulty
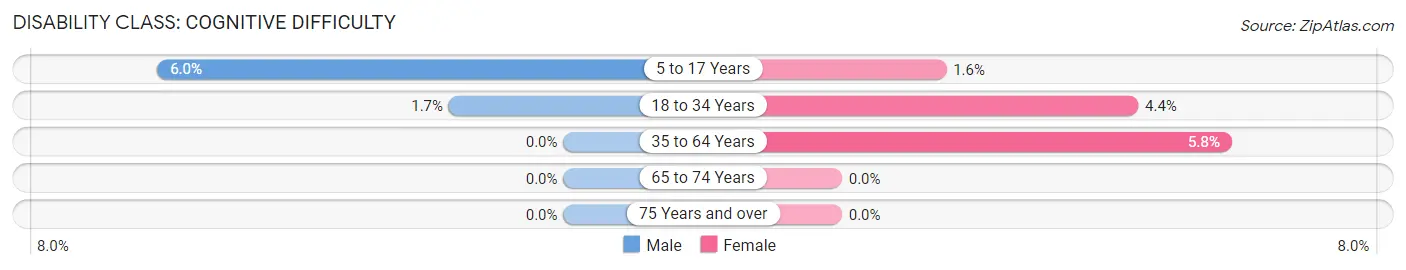
| Age Bracket | Male | Female |
| 5 to 17 Years | 12 (6.0%) | 3 (1.5%) |
| 18 to 34 Years | 3 (1.7%) | 8 (4.4%) |
| 35 to 64 Years | 0 (0.0%) | 22 (5.8%) |
| 65 to 74 Years | 0 (0.0%) | 0 (0.0%) |
| 75 Years and over | 0 (0.0%) | 0 (0.0%) |
Disability Class: Ambulatory Difficulty
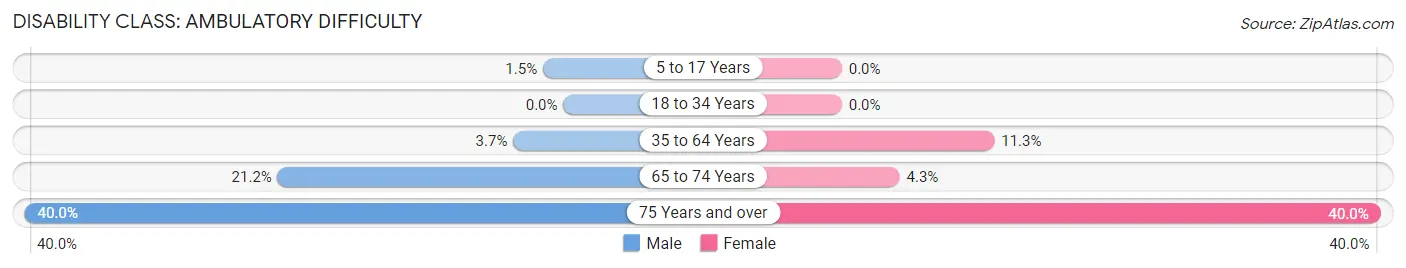
| Age Bracket | Male | Female |
| 5 to 17 Years | 3 (1.5%) | 0 (0.0%) |
| 18 to 34 Years | 0 (0.0%) | 0 (0.0%) |
| 35 to 64 Years | 12 (3.7%) | 43 (11.3%) |
| 65 to 74 Years | 7 (21.2%) | 3 (4.3%) |
| 75 Years and over | 8 (40.0%) | 4 (40.0%) |
Disability Class: Self-Care Difficulty
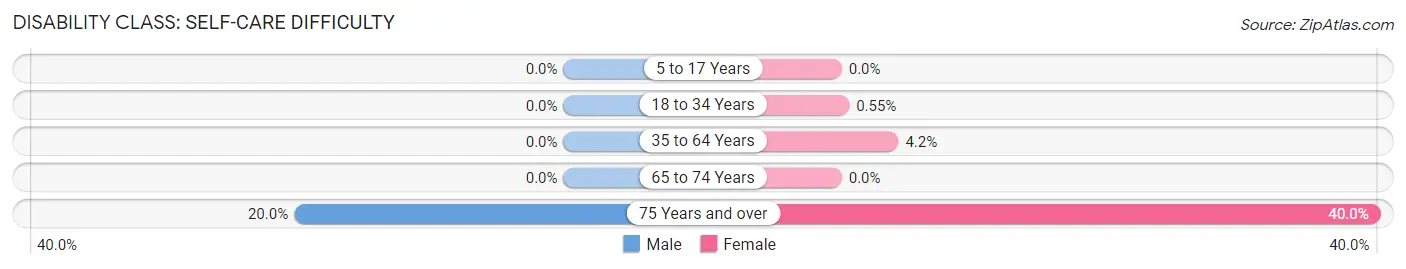
| Age Bracket | Male | Female |
| 5 to 17 Years | 0 (0.0%) | 0 (0.0%) |
| 18 to 34 Years | 0 (0.0%) | 1 (0.5%) |
| 35 to 64 Years | 0 (0.0%) | 16 (4.2%) |
| 65 to 74 Years | 0 (0.0%) | 0 (0.0%) |
| 75 Years and over | 4 (20.0%) | 4 (40.0%) |
Technology Access in Reidville
Computing Device Access in Reidville
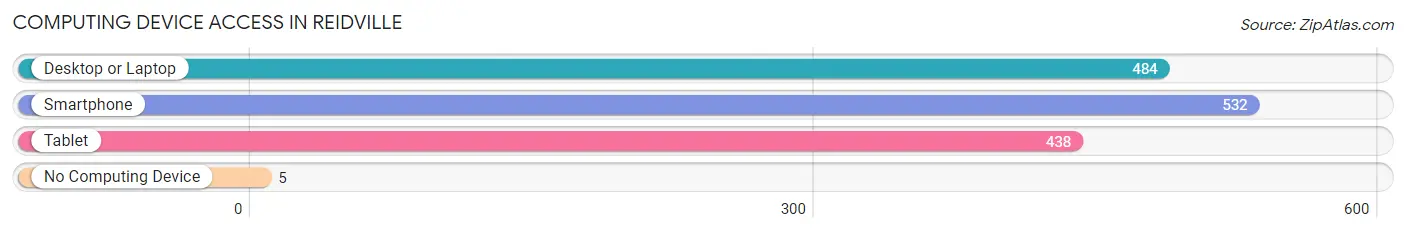
| Device Type | # Households | % Households |
| Desktop or Laptop | 484 | 88.8% |
| Smartphone | 532 | 97.6% |
| Tablet | 438 | 80.4% |
| No Computing Device | 5 | 0.9% |
| Total | 545 | 100.0% |
Internet Access in Reidville
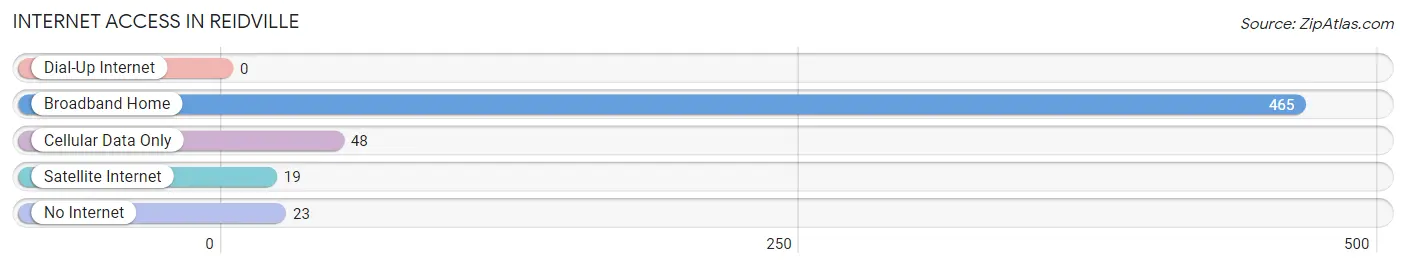
| Internet Type | # Households | % Households |
| Dial-Up Internet | 0 | 0.0% |
| Broadband Home | 465 | 85.3% |
| Cellular Data Only | 48 | 8.8% |
| Satellite Internet | 19 | 3.5% |
| No Internet | 23 | 4.2% |
| Total | 545 | 100.0% |
Reidville Summary
Reidville is a small town located in Spartanburg County, South Carolina. It is situated in the foothills of the Blue Ridge Mountains, approximately 20 miles northwest of Spartanburg. The town was founded in 1820 and named after the Reid family, who were among the first settlers in the area.
Geography
Reidville is located in the foothills of the Blue Ridge Mountains, approximately 20 miles northwest of Spartanburg. The town is situated on the banks of the Pacolet River, which flows through the town and provides a source of recreation for the locals. The town is surrounded by rolling hills and forests, providing a picturesque backdrop for the town. The climate in Reidville is mild, with temperatures ranging from the mid-50s in the winter to the mid-80s in the summer.
Economy
Reidville’s economy is largely based on agriculture and manufacturing. The town is home to several small businesses, including a grocery store, a hardware store, and a few restaurants. The town also has a few small manufacturing plants, which produce a variety of products, including furniture, textiles, and automotive parts.
Demographics
As of the 2010 census, Reidville had a population of 1,845. The population is predominantly white (90.2%), with African Americans making up the largest minority group (7.3%). The median household income in Reidville is $37,917, and the median age is 39.7 years.
Education
Reidville is served by the Spartanburg County School District. The town has one elementary school, one middle school, and one high school. The town also has a library, which offers a variety of services, including books, magazines, and computers.
Conclusion
Reidville is a small town located in Spartanburg County, South Carolina. It is situated in the foothills of the Blue Ridge Mountains, approximately 20 miles northwest of Spartanburg. The town was founded in 1820 and named after the Reid family, who were among the first settlers in the area. The town’s economy is largely based on agriculture and manufacturing, and the population is predominantly white. Reidville is served by the Spartanburg County School District, and the town has a library, which offers a variety of services.
Common Questions
What is Per Capita Income in Reidville?
Per Capita income in Reidville is $40,210.
What is the Median Family Income in Reidville?
Median Family Income in Reidville is $124,167.
What is the Median Household income in Reidville?
Median Household Income in Reidville is $115,972.
What is Income or Wage Gap in Reidville?
Income or Wage Gap in Reidville is 28.6%.
Women in Reidville earn 71.4 cents for every dollar earned by a man.
What is Inequality or Gini Index in Reidville?
Inequality or Gini Index in Reidville is 0.32.
What is the Total Population of Reidville?
Total Population of Reidville is 1,734.
What is the Total Male Population of Reidville?
Total Male Population of Reidville is 820.
What is the Total Female Population of Reidville?
Total Female Population of Reidville is 914.
What is the Ratio of Males per 100 Females in Reidville?
There are 89.72 Males per 100 Females in Reidville.
What is the Ratio of Females per 100 Males in Reidville?
There are 111.46 Females per 100 Males in Reidville.
What is the Median Population Age in Reidville?
Median Population Age in Reidville is 34.0 Years.
What is the Average Family Size in Reidville
Average Family Size in Reidville is 3.5 People.
What is the Average Household Size in Reidville
Average Household Size in Reidville is 3.2 People.
How Large is the Labor Force in Reidville?
There are 974 People in the Labor Forcein in Reidville.
What is the Percentage of People in the Labor Force in Reidville?
78.8% of People are in the Labor Force in Reidville.
What is the Unemployment Rate in Reidville?
Unemployment Rate in Reidville is 4.5%.