Travelers Rest, SC Map & Demographics
Travelers Rest Map
Travelers Rest Overview
$20,908
PER CAPITA INCOME
$61,750
AVG FAMILY INCOME
$44,375
AVG HOUSEHOLD INCOME
28.5%
WAGE / INCOME GAP [ % ]
71.5¢/ $1
WAGE / INCOME GAP [ $ ]
0.45
INEQUALITY / GINI INDEX
7,929
TOTAL POPULATION
3,381
MALE POPULATION
4,548
FEMALE POPULATION
74.34
MALES / 100 FEMALES
134.52
FEMALES / 100 MALES
21.4
MEDIAN AGE
3.2
AVG FAMILY SIZE
2.6
AVG HOUSEHOLD SIZE
3,490
LABOR FORCE [ PEOPLE ]
55.8%
PERCENT IN LABOR FORCE
6.4%
UNEMPLOYMENT RATE
Travelers Rest Zip Codes
Travelers Rest Area Codes
Income in Travelers Rest
Income Overview in Travelers Rest
Per Capita Income in Travelers Rest is $20,908, while median incomes of families and households are $61,750 and $44,375 respectively.
| Characteristic | Number | Measure |
| Per Capita Income | 7,929 | $20,908 |
| Median Family Income | 1,430 | $61,750 |
| Mean Family Income | 1,430 | $86,069 |
| Median Household Income | 2,095 | $44,375 |
| Mean Household Income | 2,095 | $73,193 |
| Income Deficit | 1,430 | $0 |
| Wage / Income Gap (%) | 7,929 | 28.50% |
| Wage / Income Gap ($) | 7,929 | 71.50¢ per $1 |
| Gini / Inequality Index | 7,929 | 0.45 |
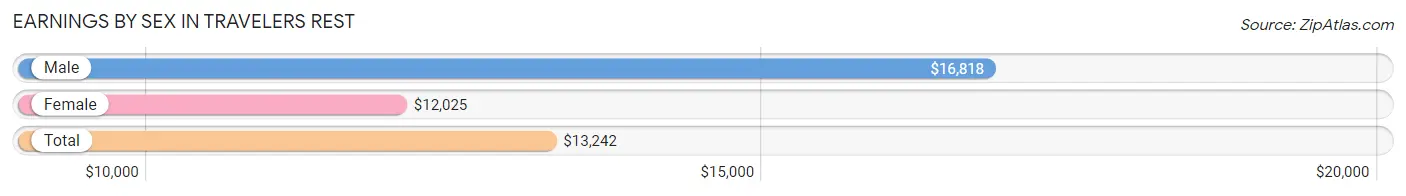
Earnings by Sex in Travelers Rest
Average Earnings in Travelers Rest are $13,242, $16,818 for men and $12,025 for women, a difference of 28.5%.
| Sex | Number | Average Earnings |
| Male | 1,664 (40.4%) | $16,818 |
| Female | 2,460 (59.7%) | $12,025 |
| Total | 4,124 (100.0%) | $13,242 |
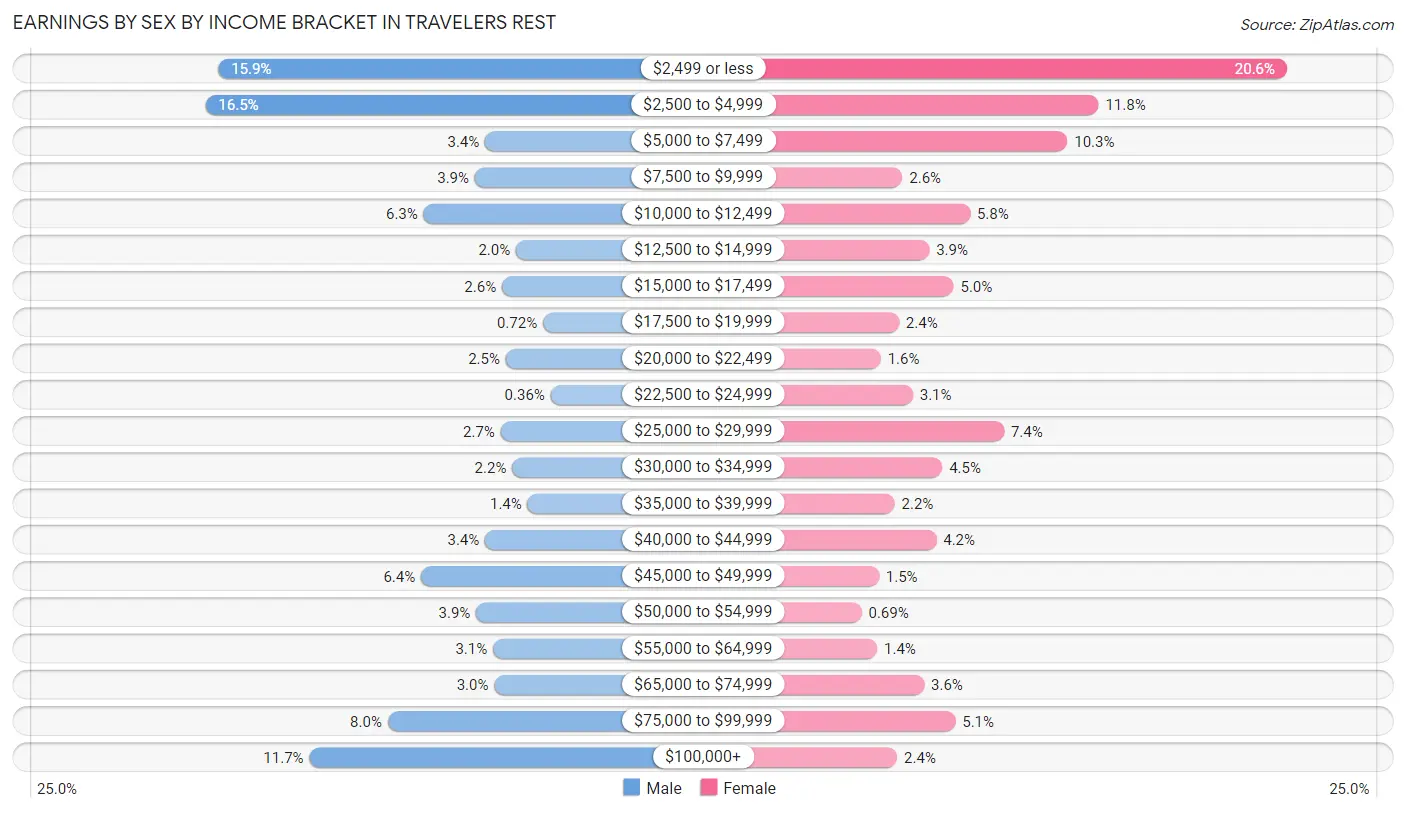
Earnings by Sex by Income Bracket in Travelers Rest
The most common earnings brackets in Travelers Rest are $2,500 to $4,999 for men (275 | 16.5%) and $2,499 or less for women (507 | 20.6%).
| Income | Male | Female |
| $2,499 or less | 265 (15.9%) | 507 (20.6%) |
| $2,500 to $4,999 | 275 (16.5%) | 290 (11.8%) |
| $5,000 to $7,499 | 57 (3.4%) | 254 (10.3%) |
| $7,500 to $9,999 | 65 (3.9%) | 64 (2.6%) |
| $10,000 to $12,499 | 105 (6.3%) | 142 (5.8%) |
| $12,500 to $14,999 | 33 (2.0%) | 95 (3.9%) |
| $15,000 to $17,499 | 44 (2.6%) | 123 (5.0%) |
| $17,500 to $19,999 | 12 (0.7%) | 60 (2.4%) |
| $20,000 to $22,499 | 41 (2.5%) | 39 (1.6%) |
| $22,500 to $24,999 | 6 (0.4%) | 76 (3.1%) |
| $25,000 to $29,999 | 45 (2.7%) | 181 (7.4%) |
| $30,000 to $34,999 | 36 (2.2%) | 110 (4.5%) |
| $35,000 to $39,999 | 24 (1.4%) | 55 (2.2%) |
| $40,000 to $44,999 | 57 (3.4%) | 103 (4.2%) |
| $45,000 to $49,999 | 107 (6.4%) | 37 (1.5%) |
| $50,000 to $54,999 | 64 (3.8%) | 17 (0.7%) |
| $55,000 to $64,999 | 51 (3.1%) | 35 (1.4%) |
| $65,000 to $74,999 | 50 (3.0%) | 89 (3.6%) |
| $75,000 to $99,999 | 133 (8.0%) | 125 (5.1%) |
| $100,000+ | 194 (11.7%) | 58 (2.4%) |
| Total | 1,664 (100.0%) | 2,460 (100.0%) |
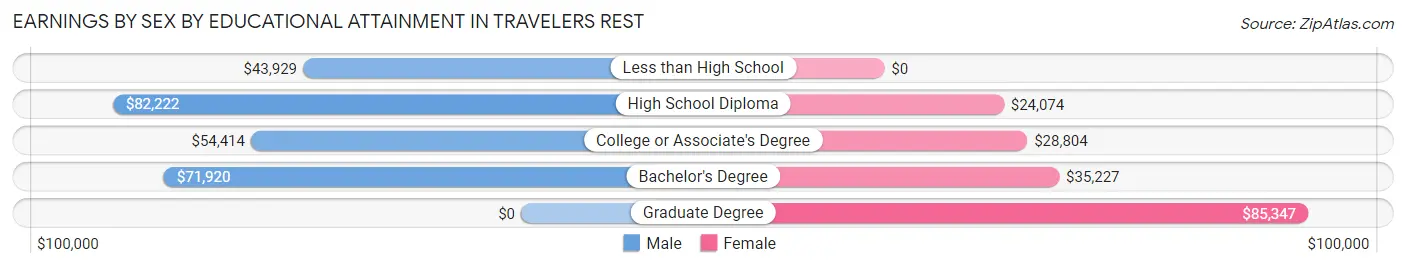
Earnings by Sex by Educational Attainment in Travelers Rest
Average earnings in Travelers Rest are $59,183 for men and $30,692 for women, a difference of 48.1%. Men with an educational attainment of high school diploma enjoy the highest average annual earnings of $82,222, while those with less than high school education earn the least with $43,929. Women with an educational attainment of graduate degree earn the most with the average annual earnings of $85,347, while those with high school diploma education have the smallest earnings of $24,074.
| Educational Attainment | Male Income | Female Income |
| Less than High School | $43,929 | $0 |
| High School Diploma | $82,222 | $24,074 |
| College or Associate's Degree | $54,414 | $28,804 |
| Bachelor's Degree | $71,920 | $35,227 |
| Graduate Degree | - | - |
| Total | $59,183 | $30,692 |
Family Income in Travelers Rest
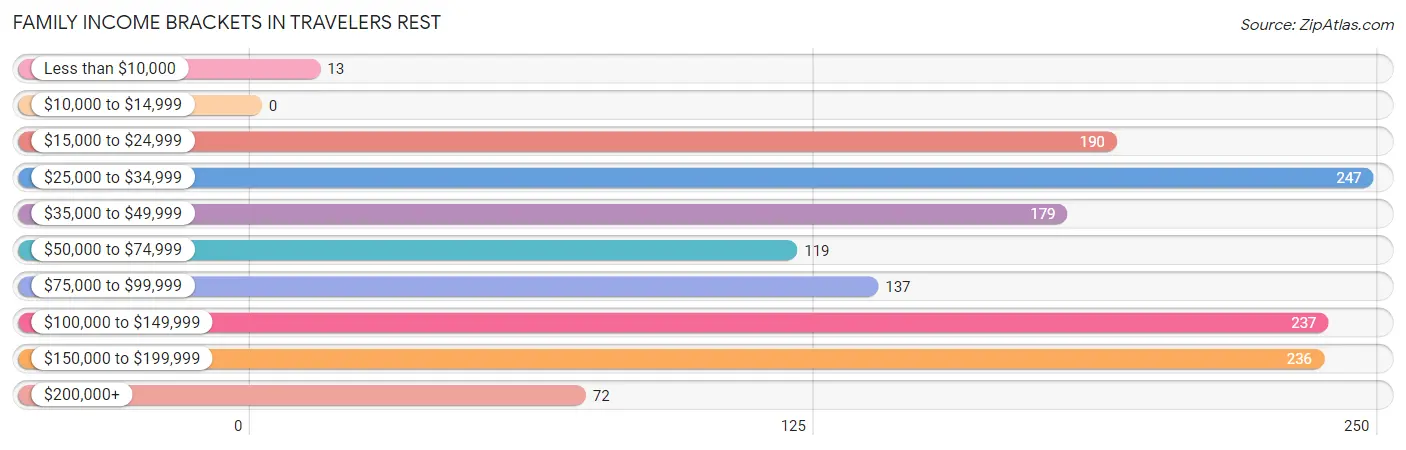
Family Income Brackets in Travelers Rest
According to the Travelers Rest family income data, there are 247 families falling into the $25,000 to $34,999 income range, which is the most common income bracket and makes up 17.3% of all families.
| Income Bracket | # Families | % Families |
| Less than $10,000 | 13 | 0.9% |
| $10,000 to $14,999 | 0 | 0.0% |
| $15,000 to $24,999 | 190 | 13.3% |
| $25,000 to $34,999 | 247 | 17.3% |
| $35,000 to $49,999 | 179 | 12.5% |
| $50,000 to $74,999 | 119 | 8.3% |
| $75,000 to $99,999 | 137 | 9.6% |
| $100,000 to $149,999 | 237 | 16.6% |
| $150,000 to $199,999 | 236 | 16.5% |
| $200,000+ | 72 | 5.0% |
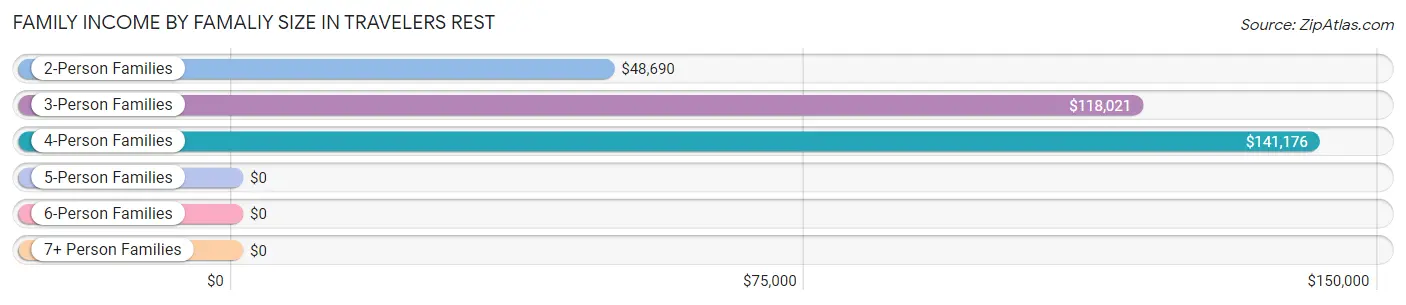
Family Income by Famaliy Size in Travelers Rest
4-person families (256 | 17.9%) account for the highest median family income in Travelers Rest with $141,176 per family, while 3-person families (255 | 17.8%) have the highest median income of $39,340 per family member.
| Income Bracket | # Families | Median Income |
| 2-Person Families | 616 (43.1%) | $48,690 |
| 3-Person Families | 255 (17.8%) | $118,021 |
| 4-Person Families | 256 (17.9%) | $141,176 |
| 5-Person Families | 110 (7.7%) | $0 |
| 6-Person Families | 152 (10.6%) | $0 |
| 7+ Person Families | 41 (2.9%) | $0 |
| Total | 1,430 (100.0%) | $61,750 |
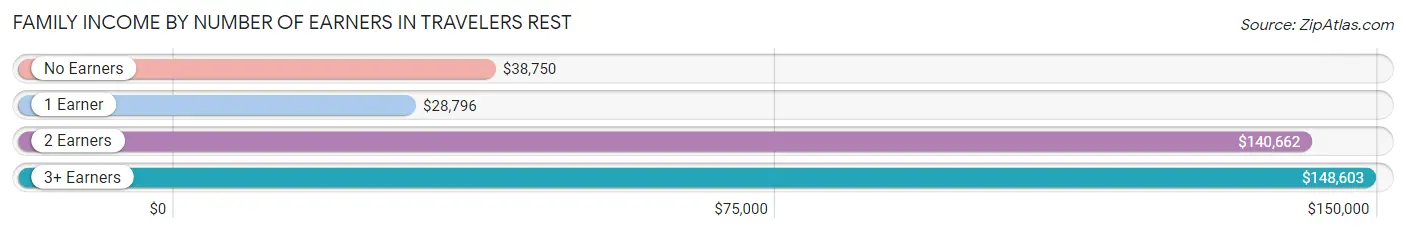
Family Income by Number of Earners in Travelers Rest
The median family income in Travelers Rest is $61,750, with families comprising 3+ earners (143) having the highest median family income of $148,603, while families with 1 earner (541) have the lowest median family income of $28,796, accounting for 10.0% and 37.8% of families, respectively.
| Number of Earners | # Families | Median Income |
| No Earners | 305 (21.3%) | $38,750 |
| 1 Earner | 541 (37.8%) | $28,796 |
| 2 Earners | 441 (30.8%) | $140,662 |
| 3+ Earners | 143 (10.0%) | $148,603 |
| Total | 1,430 (100.0%) | $61,750 |
Household Income in Travelers Rest
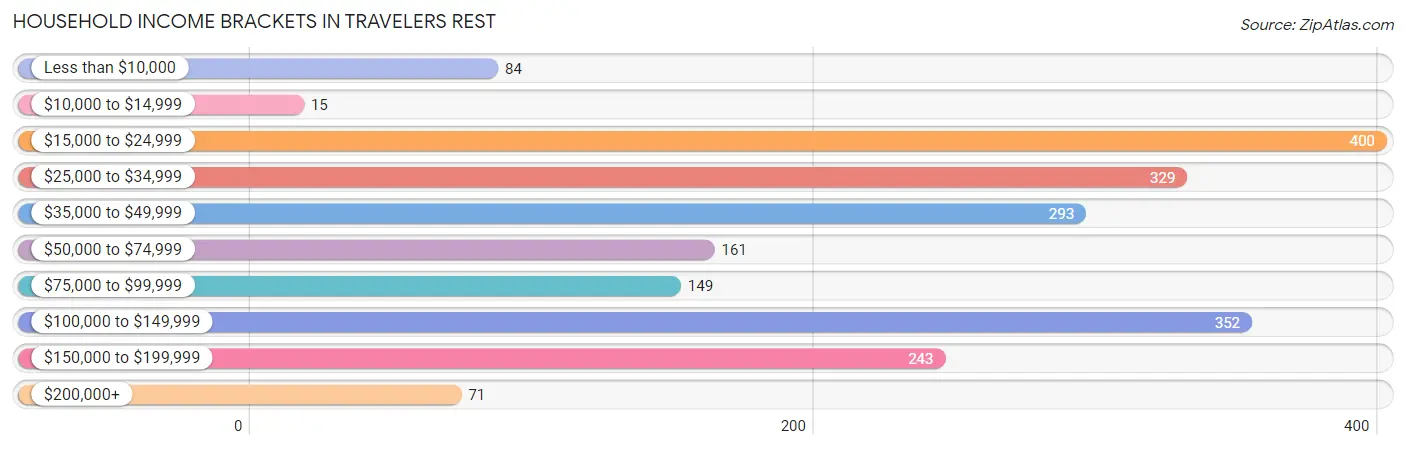
Household Income Brackets in Travelers Rest
With 400 households falling in the category, the $15,000 to $24,999 income range is the most frequent in Travelers Rest, accounting for 19.1% of all households. In contrast, only 15 households (0.7%) fall into the $10,000 to $14,999 income bracket, making it the least populous group.
| Income Bracket | # Households | % Households |
| Less than $10,000 | 84 | 4.0% |
| $10,000 to $14,999 | 15 | 0.7% |
| $15,000 to $24,999 | 400 | 19.1% |
| $25,000 to $34,999 | 329 | 15.7% |
| $35,000 to $49,999 | 293 | 14.0% |
| $50,000 to $74,999 | 161 | 7.7% |
| $75,000 to $99,999 | 149 | 7.1% |
| $100,000 to $149,999 | 352 | 16.8% |
| $150,000 to $199,999 | 243 | 11.6% |
| $200,000+ | 71 | 3.4% |
Household Income by Householder Age in Travelers Rest
The median household income in Travelers Rest is $44,375, with the highest median household income of $100,536 found in the 45 to 64 years age bracket for the primary householder. A total of 674 households (32.2%) fall into this category. Meanwhile, the 15 to 24 years age bracket for the primary householder has the lowest median household income of $28,333, with 102 households (4.9%) in this group.
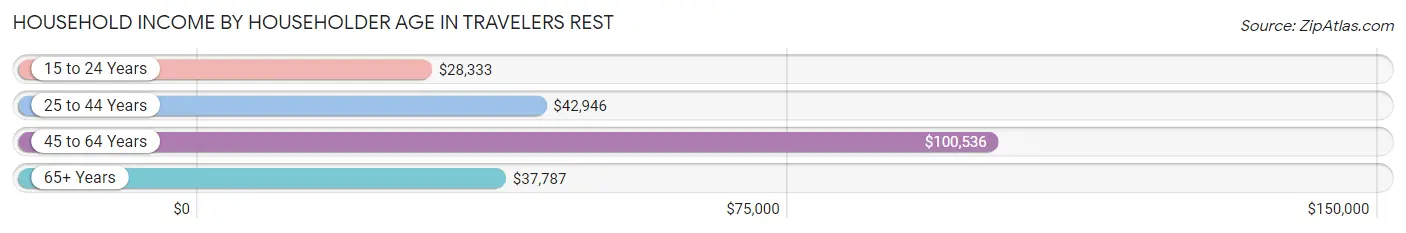
| Income Bracket | # Households | Median Income |
| 15 to 24 Years | 102 (4.9%) | $28,333 |
| 25 to 44 Years | 609 (29.1%) | $42,946 |
| 45 to 64 Years | 674 (32.2%) | $100,536 |
| 65+ Years | 710 (33.9%) | $37,787 |
| Total | 2,095 (100.0%) | $44,375 |
Poverty in Travelers Rest
Income Below Poverty by Sex and Age in Travelers Rest
With 24.6% poverty level for males and 23.1% for females among the residents of Travelers Rest, 5 year old males and 6 to 11 year old females are the most vulnerable to poverty, with 42 males (100.0%) and 124 females (64.6%) in their respective age groups living below the poverty level.
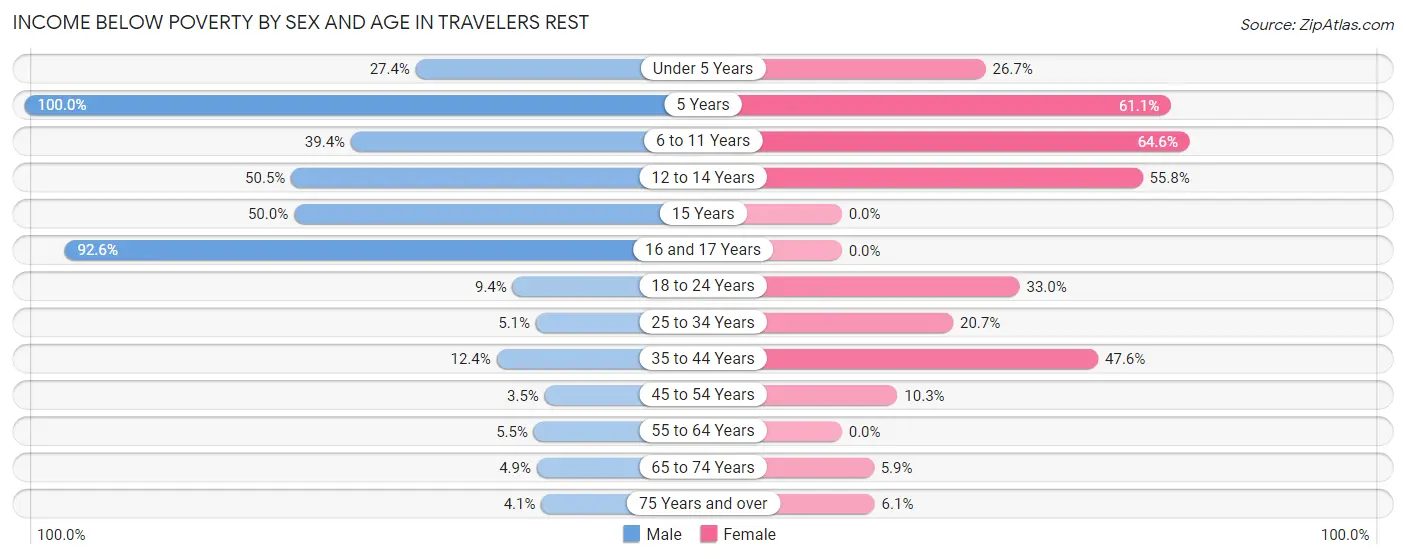
| Age Bracket | Male | Female |
| Under 5 Years | 54 (27.4%) | 107 (26.7%) |
| 5 Years | 42 (100.0%) | 11 (61.1%) |
| 6 to 11 Years | 138 (39.4%) | 124 (64.6%) |
| 12 to 14 Years | 145 (50.5%) | 72 (55.8%) |
| 15 Years | 7 (50.0%) | 0 (0.0%) |
| 16 and 17 Years | 100 (92.6%) | 0 (0.0%) |
| 18 to 24 Years | 13 (9.4%) | 99 (33.0%) |
| 25 to 34 Years | 8 (5.1%) | 70 (20.6%) |
| 35 to 44 Years | 30 (12.4%) | 157 (47.6%) |
| 45 to 54 Years | 10 (3.5%) | 42 (10.3%) |
| 55 to 64 Years | 8 (5.5%) | 0 (0.0%) |
| 65 to 74 Years | 9 (4.9%) | 21 (5.9%) |
| 75 Years and over | 7 (4.1%) | 20 (6.1%) |
| Total | 571 (24.6%) | 723 (23.1%) |
Income Above Poverty by Sex and Age in Travelers Rest
According to the poverty statistics in Travelers Rest, males aged 45 to 54 years and females aged 15 years are the age groups that are most secure financially, with 96.5% of males and 100.0% of females in these age groups living above the poverty line.
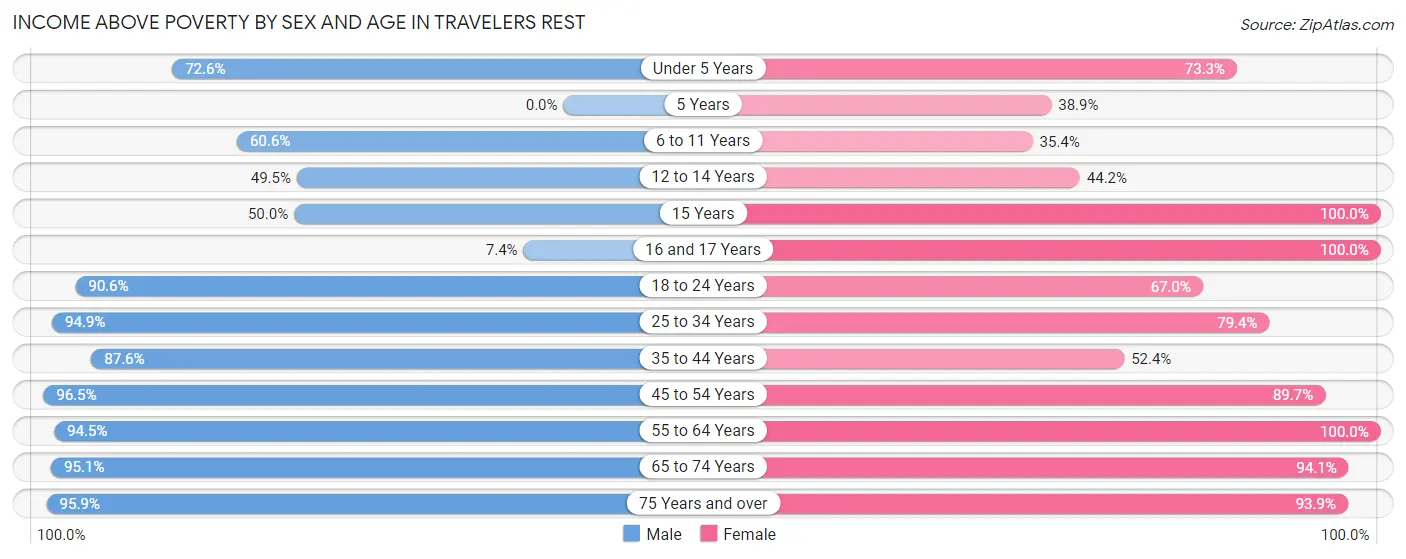
| Age Bracket | Male | Female |
| Under 5 Years | 143 (72.6%) | 294 (73.3%) |
| 5 Years | 0 (0.0%) | 7 (38.9%) |
| 6 to 11 Years | 212 (60.6%) | 68 (35.4%) |
| 12 to 14 Years | 142 (49.5%) | 57 (44.2%) |
| 15 Years | 7 (50.0%) | 36 (100.0%) |
| 16 and 17 Years | 8 (7.4%) | 72 (100.0%) |
| 18 to 24 Years | 125 (90.6%) | 201 (67.0%) |
| 25 to 34 Years | 149 (94.9%) | 269 (79.3%) |
| 35 to 44 Years | 212 (87.6%) | 173 (52.4%) |
| 45 to 54 Years | 278 (96.5%) | 365 (89.7%) |
| 55 to 64 Years | 138 (94.5%) | 219 (100.0%) |
| 65 to 74 Years | 174 (95.1%) | 333 (94.1%) |
| 75 Years and over | 164 (95.9%) | 308 (93.9%) |
| Total | 1,752 (75.4%) | 2,402 (76.9%) |
Income Below Poverty Among Married-Couple Families in Travelers Rest
The poverty statistics for married-couple families in Travelers Rest show that 3.9% or 37 of the total 945 families live below the poverty line. Families with 5 or more children have the highest poverty rate of 100.0%, comprising of 11 families. On the other hand, families with 3 or 4 children have the lowest poverty rate of 0.0%, which includes 0 families.
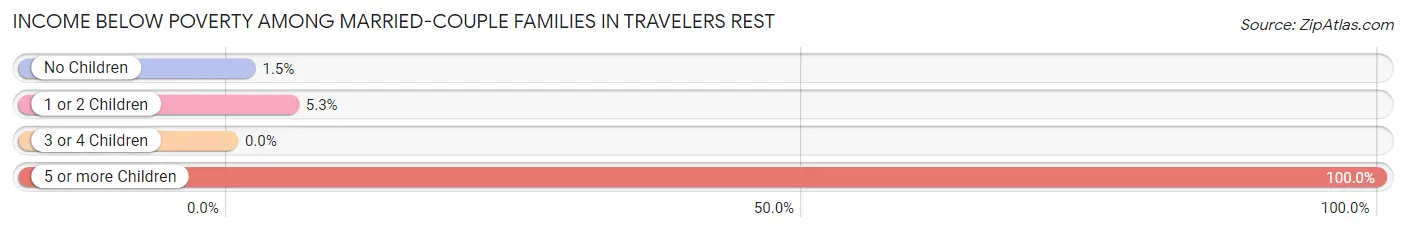
| Children | Above Poverty | Below Poverty |
| No Children | 519 (98.5%) | 8 (1.5%) |
| 1 or 2 Children | 322 (94.7%) | 18 (5.3%) |
| 3 or 4 Children | 67 (100.0%) | 0 (0.0%) |
| 5 or more Children | 0 (0.0%) | 11 (100.0%) |
| Total | 908 (96.1%) | 37 (3.9%) |
Income Below Poverty Among Single-Parent Households in Travelers Rest
According to the poverty data in Travelers Rest, 15.4% or 8 single-father households and 48.3% or 209 single-mother households are living below the poverty line. Among single-father households, those with 1 or 2 children have the highest poverty rate, with 8 households (40.0%) experiencing poverty. Likewise, among single-mother households, those with 5 or more children have the highest poverty rate, with 84 households (100.0%) falling below the poverty line.
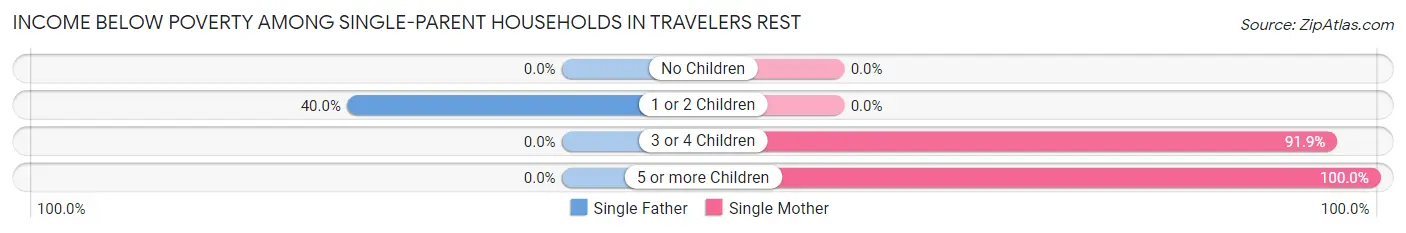
| Children | Single Father | Single Mother |
| No Children | 0 (0.0%) | 0 (0.0%) |
| 1 or 2 Children | 8 (40.0%) | 0 (0.0%) |
| 3 or 4 Children | 0 (0.0%) | 125 (91.9%) |
| 5 or more Children | 0 (0.0%) | 84 (100.0%) |
| Total | 8 (15.4%) | 209 (48.3%) |
Income Below Poverty Among Married-Couple vs Single-Parent Households in Travelers Rest
The poverty data for Travelers Rest shows that 37 of the married-couple family households (3.9%) and 217 of the single-parent households (44.7%) are living below the poverty level. Within the married-couple family households, those with 5 or more children have the highest poverty rate, with 11 households (100.0%) falling below the poverty line. Among the single-parent households, those with 5 or more children have the highest poverty rate, with 84 household (100.0%) living below poverty.
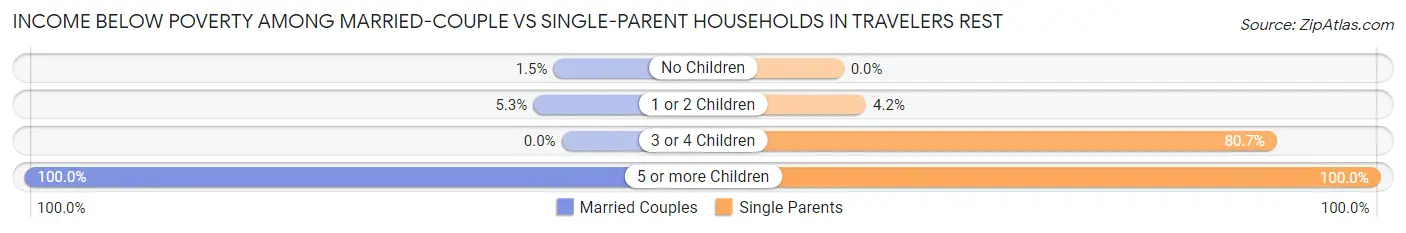
| Children | Married-Couple Families | Single-Parent Households |
| No Children | 8 (1.5%) | 0 (0.0%) |
| 1 or 2 Children | 18 (5.3%) | 8 (4.2%) |
| 3 or 4 Children | 0 (0.0%) | 125 (80.6%) |
| 5 or more Children | 11 (100.0%) | 84 (100.0%) |
| Total | 37 (3.9%) | 217 (44.7%) |
Race in Travelers Rest
The most populous races in Travelers Rest are White / Caucasian (6,120 | 77.2%), Black / African American (1,305 | 16.5%), and Hispanic or Latino (363 | 4.6%).
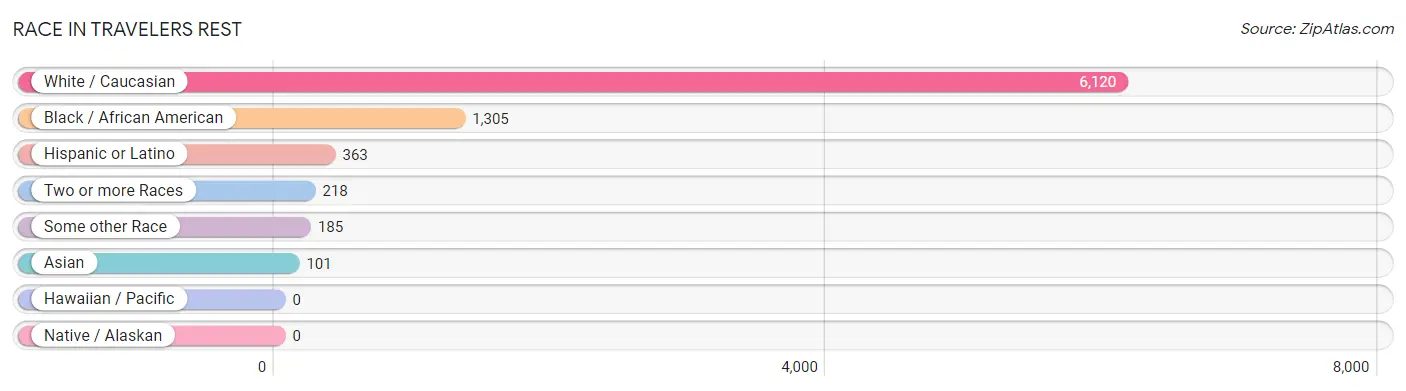
| Race | # Population | % Population |
| Asian | 101 | 1.3% |
| Black / African American | 1,305 | 16.5% |
| Hawaiian / Pacific | 0 | 0.0% |
| Hispanic or Latino | 363 | 4.6% |
| Native / Alaskan | 0 | 0.0% |
| White / Caucasian | 6,120 | 77.2% |
| Two or more Races | 218 | 2.8% |
| Some other Race | 185 | 2.3% |
| Total | 7,929 | 100.0% |
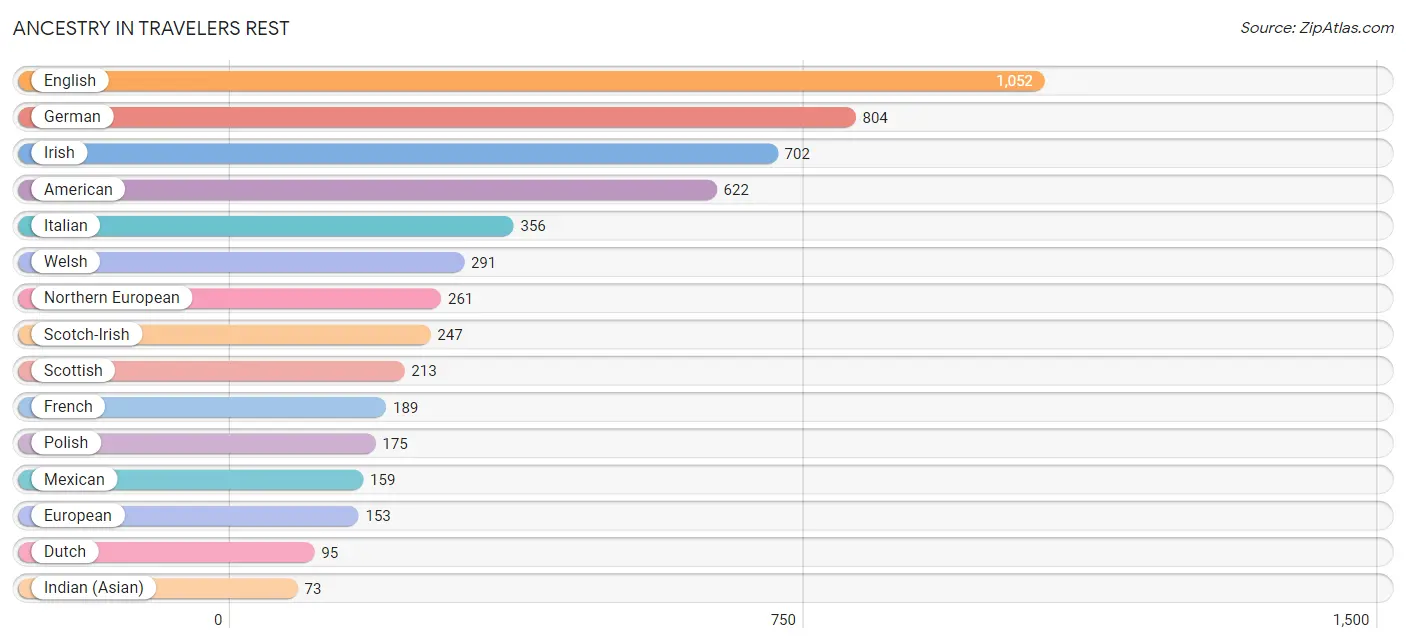
Ancestry in Travelers Rest
The most populous ancestries reported in Travelers Rest are English (1,052 | 13.3%), German (804 | 10.1%), Irish (702 | 8.8%), American (622 | 7.8%), and Italian (356 | 4.5%), together accounting for 44.6% of all Travelers Rest residents.
| Ancestry | # Population | % Population |
| African | 8 | 0.1% |
| Alsatian | 8 | 0.1% |
| American | 622 | 7.8% |
| Arab | 14 | 0.2% |
| Armenian | 7 | 0.1% |
| Austrian | 15 | 0.2% |
| Belgian | 12 | 0.2% |
| Bhutanese | 10 | 0.1% |
| British | 62 | 0.8% |
| British West Indian | 19 | 0.2% |
| Burmese | 4 | 0.1% |
| Canadian | 51 | 0.6% |
| Central American | 64 | 0.8% |
| Cherokee | 15 | 0.2% |
| Danish | 15 | 0.2% |
| Dominican | 63 | 0.8% |
| Dutch | 95 | 1.2% |
| English | 1,052 | 13.3% |
| European | 153 | 1.9% |
| French | 189 | 2.4% |
| French Canadian | 19 | 0.2% |
| German | 804 | 10.1% |
| Haitian | 7 | 0.1% |
| Honduran | 57 | 0.7% |
| Hungarian | 39 | 0.5% |
| Indian (Asian) | 73 | 0.9% |
| Indonesian | 4 | 0.1% |
| Irish | 702 | 8.8% |
| Italian | 356 | 4.5% |
| Lebanese | 14 | 0.2% |
| Lithuanian | 15 | 0.2% |
| Mexican | 159 | 2.0% |
| Northern European | 261 | 3.3% |
| Norwegian | 7 | 0.1% |
| Pennsylvania German | 6 | 0.1% |
| Peruvian | 21 | 0.3% |
| Polish | 175 | 2.2% |
| Portuguese | 5 | 0.1% |
| Puerto Rican | 35 | 0.4% |
| Russian | 15 | 0.2% |
| Salvadoran | 7 | 0.1% |
| Scandinavian | 16 | 0.2% |
| Scotch-Irish | 247 | 3.1% |
| Scottish | 213 | 2.7% |
| Sioux | 7 | 0.1% |
| Slavic | 24 | 0.3% |
| South African | 3 | 0.0% |
| South American | 27 | 0.3% |
| Spaniard | 15 | 0.2% |
| Subsaharan African | 11 | 0.1% |
| Swedish | 32 | 0.4% |
| Swiss | 8 | 0.1% |
| Syrian | 3 | 0.0% |
| Thai | 24 | 0.3% |
| Ukrainian | 12 | 0.2% |
| Venezuelan | 6 | 0.1% |
| Welsh | 291 | 3.7% | View All 57 Rows |
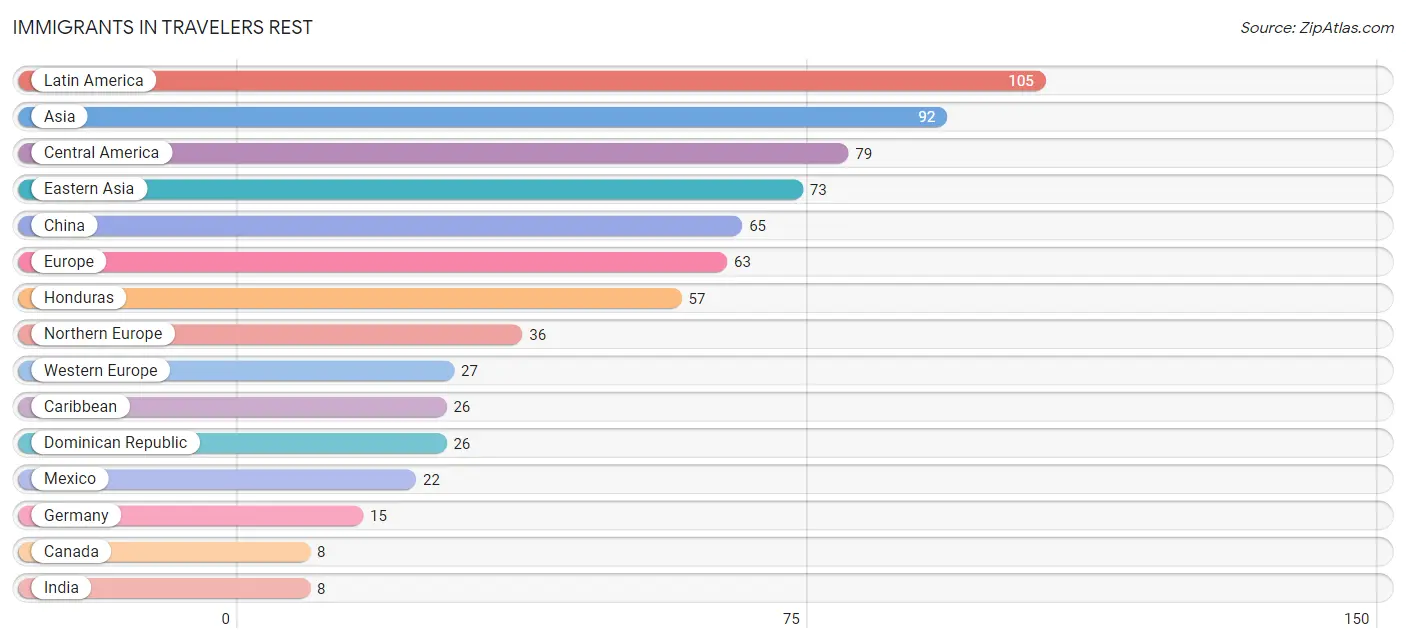
Immigrants in Travelers Rest
The most numerous immigrant groups reported in Travelers Rest came from Latin America (105 | 1.3%), Asia (92 | 1.2%), Central America (79 | 1.0%), Eastern Asia (73 | 0.9%), and China (65 | 0.8%), together accounting for 5.2% of all Travelers Rest residents.
| Immigration Origin | # Population | % Population |
| Africa | 5 | 0.1% |
| Asia | 92 | 1.2% |
| Australia | 5 | 0.1% |
| Canada | 8 | 0.1% |
| Caribbean | 26 | 0.3% |
| Central America | 79 | 1.0% |
| China | 65 | 0.8% |
| Dominican Republic | 26 | 0.3% |
| Eastern Asia | 73 | 0.9% |
| England | 6 | 0.1% |
| Europe | 63 | 0.8% |
| Germany | 15 | 0.2% |
| Honduras | 57 | 0.7% |
| India | 8 | 0.1% |
| Korea | 8 | 0.1% |
| Latin America | 105 | 1.3% |
| Lebanon | 7 | 0.1% |
| Mexico | 22 | 0.3% |
| Northern Europe | 36 | 0.4% |
| Oceania | 5 | 0.1% |
| South Africa | 5 | 0.1% |
| South Central Asia | 8 | 0.1% |
| South Eastern Asia | 4 | 0.1% |
| Western Asia | 7 | 0.1% |
| Western Europe | 27 | 0.3% | View All 25 Rows |
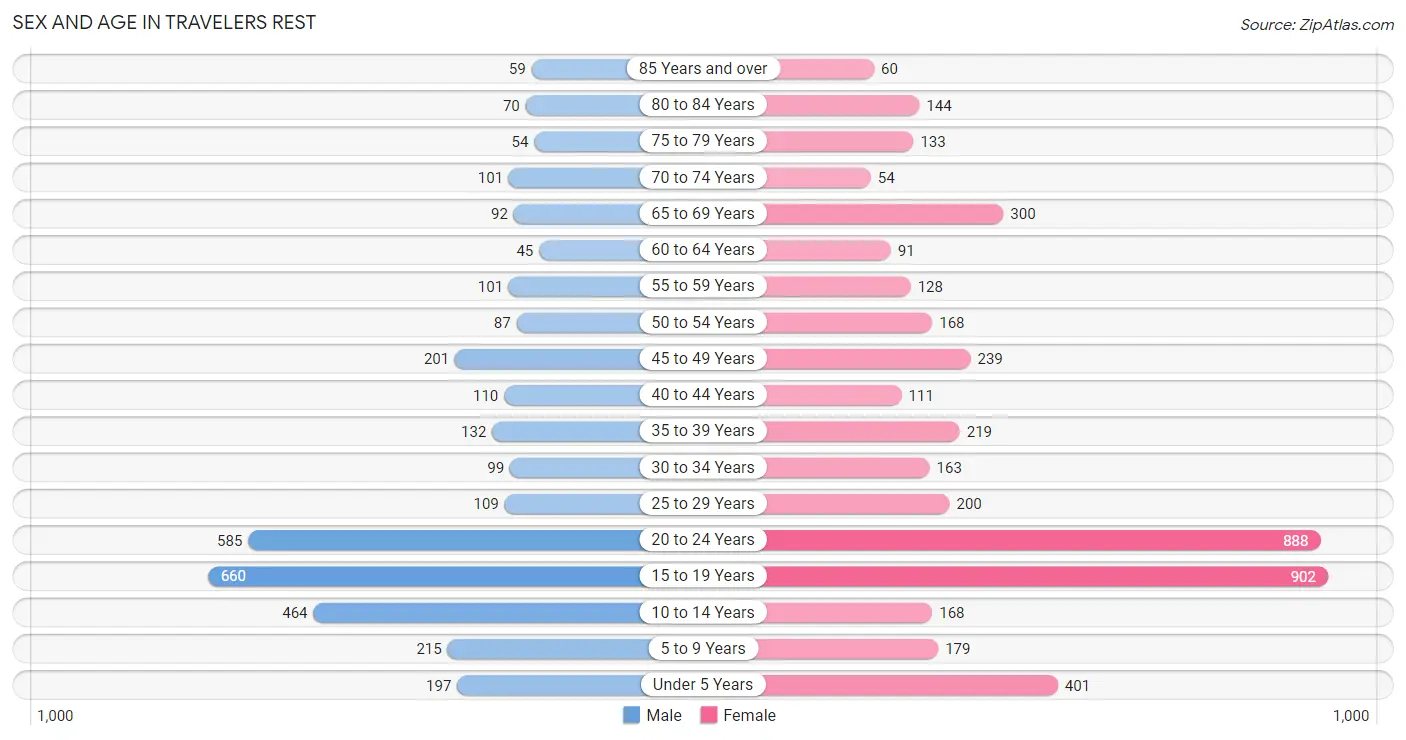
Sex and Age in Travelers Rest
Sex and Age in Travelers Rest
The most populous age groups in Travelers Rest are 15 to 19 Years (660 | 19.5%) for men and 15 to 19 Years (902 | 19.8%) for women.
| Age Bracket | Male | Female |
| Under 5 Years | 197 (5.8%) | 401 (8.8%) |
| 5 to 9 Years | 215 (6.4%) | 179 (3.9%) |
| 10 to 14 Years | 464 (13.7%) | 168 (3.7%) |
| 15 to 19 Years | 660 (19.5%) | 902 (19.8%) |
| 20 to 24 Years | 585 (17.3%) | 888 (19.5%) |
| 25 to 29 Years | 109 (3.2%) | 200 (4.4%) |
| 30 to 34 Years | 99 (2.9%) | 163 (3.6%) |
| 35 to 39 Years | 132 (3.9%) | 219 (4.8%) |
| 40 to 44 Years | 110 (3.3%) | 111 (2.4%) |
| 45 to 49 Years | 201 (5.9%) | 239 (5.3%) |
| 50 to 54 Years | 87 (2.6%) | 168 (3.7%) |
| 55 to 59 Years | 101 (3.0%) | 128 (2.8%) |
| 60 to 64 Years | 45 (1.3%) | 91 (2.0%) |
| 65 to 69 Years | 92 (2.7%) | 300 (6.6%) |
| 70 to 74 Years | 101 (3.0%) | 54 (1.2%) |
| 75 to 79 Years | 54 (1.6%) | 133 (2.9%) |
| 80 to 84 Years | 70 (2.1%) | 144 (3.2%) |
| 85 Years and over | 59 (1.8%) | 60 (1.3%) |
| Total | 3,381 (100.0%) | 4,548 (100.0%) |
Families and Households in Travelers Rest
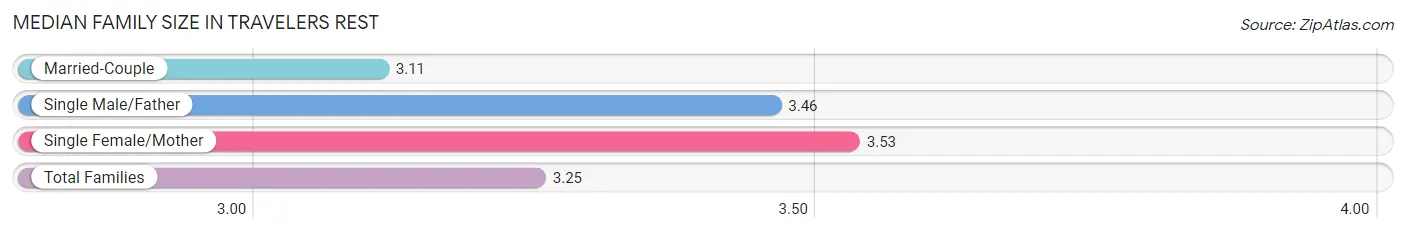
Median Family Size in Travelers Rest
The median family size in Travelers Rest is 3.25 persons per family, with single female/mother families (433 | 30.3%) accounting for the largest median family size of 3.53 persons per family. On the other hand, married-couple families (945 | 66.1%) represent the smallest median family size with 3.11 persons per family.
| Family Type | # Families | Family Size |
| Married-Couple | 945 (66.1%) | 3.11 |
| Single Male/Father | 52 (3.6%) | 3.46 |
| Single Female/Mother | 433 (30.3%) | 3.53 |
| Total Families | 1,430 (100.0%) | 3.25 |
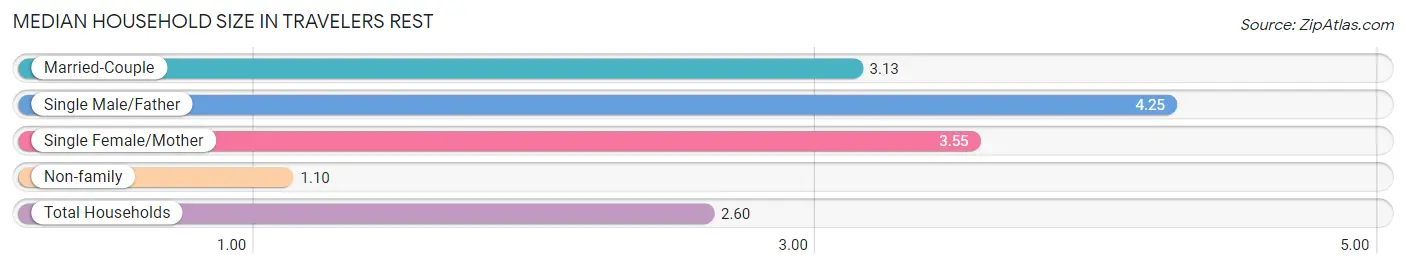
Median Household Size in Travelers Rest
The median household size in Travelers Rest is 2.60 persons per household, with single male/father households (52 | 2.5%) accounting for the largest median household size of 4.25 persons per household. non-family households (665 | 31.7%) represent the smallest median household size with 1.10 persons per household.
| Household Type | # Households | Household Size |
| Married-Couple | 945 (45.1%) | 3.13 |
| Single Male/Father | 52 (2.5%) | 4.25 |
| Single Female/Mother | 433 (20.7%) | 3.55 |
| Non-family | 665 (31.7%) | 1.10 |
| Total Households | 2,095 (100.0%) | 2.60 |
Household Size by Marriage Status in Travelers Rest
Out of a total of 2,095 households in Travelers Rest, 1,430 (68.3%) are family households, while 665 (31.7%) are nonfamily households. The most numerous type of family households are 2-person households, comprising 608, and the most common type of nonfamily households are 1-person households, comprising 601.
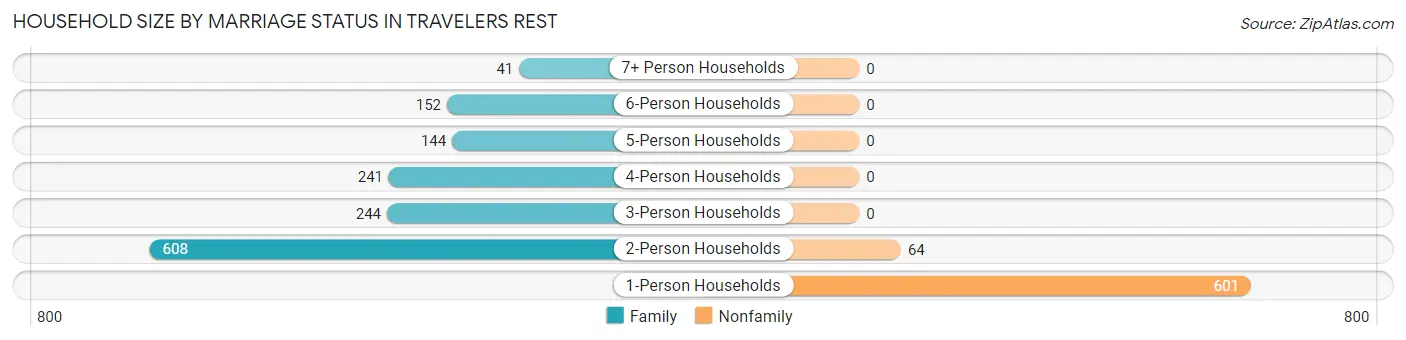
| Household Size | Family Households | Nonfamily Households |
| 1-Person Households | - | 601 (28.7%) |
| 2-Person Households | 608 (29.0%) | 64 (3.0%) |
| 3-Person Households | 244 (11.7%) | 0 (0.0%) |
| 4-Person Households | 241 (11.5%) | 0 (0.0%) |
| 5-Person Households | 144 (6.9%) | 0 (0.0%) |
| 6-Person Households | 152 (7.3%) | 0 (0.0%) |
| 7+ Person Households | 41 (2.0%) | 0 (0.0%) |
| Total | 1,430 (68.3%) | 665 (31.7%) |
Female Fertility in Travelers Rest
Fertility by Age in Travelers Rest
Average fertility rate in Travelers Rest is 88.0 births per 1,000 women. Women in the age bracket of 20 to 34 years have the highest fertility rate with 154.0 births per 1,000 women. Women in the age bracket of 20 to 34 years acount for 80.1% of all women with births.
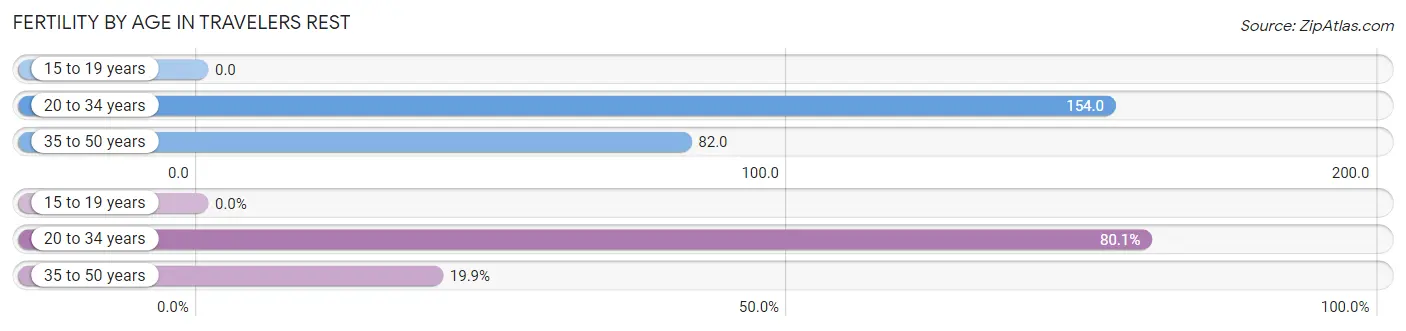
| Age Bracket | Women with Births | Births / 1,000 Women |
| 15 to 19 years | 0 (0.0%) | 0.0 |
| 20 to 34 years | 193 (80.1%) | 154.0 |
| 35 to 50 years | 48 (19.9%) | 82.0 |
| Total | 241 (100.0%) | 88.0 |
Fertility by Age by Marriage Status in Travelers Rest
32.0% of women with births (241) in Travelers Rest are married. The highest percentage of unmarried women with births falls into 20 to 34 years age bracket with 85.0% of them unmarried at the time of birth, while the lowest percentage of unmarried women with births belong to 35 to 50 years age bracket with 0.0% of them unmarried.
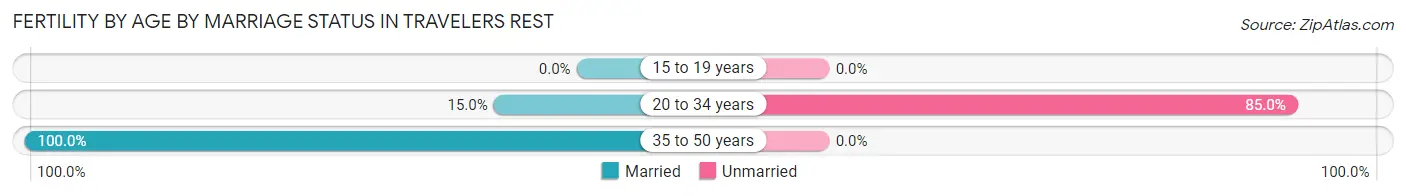
| Age Bracket | Married | Unmarried |
| 15 to 19 years | 0 (0.0%) | 0 (0.0%) |
| 20 to 34 years | 29 (15.0%) | 164 (85.0%) |
| 35 to 50 years | 48 (100.0%) | 0 (0.0%) |
| Total | 77 (32.0%) | 164 (68.0%) |
Fertility by Education in Travelers Rest
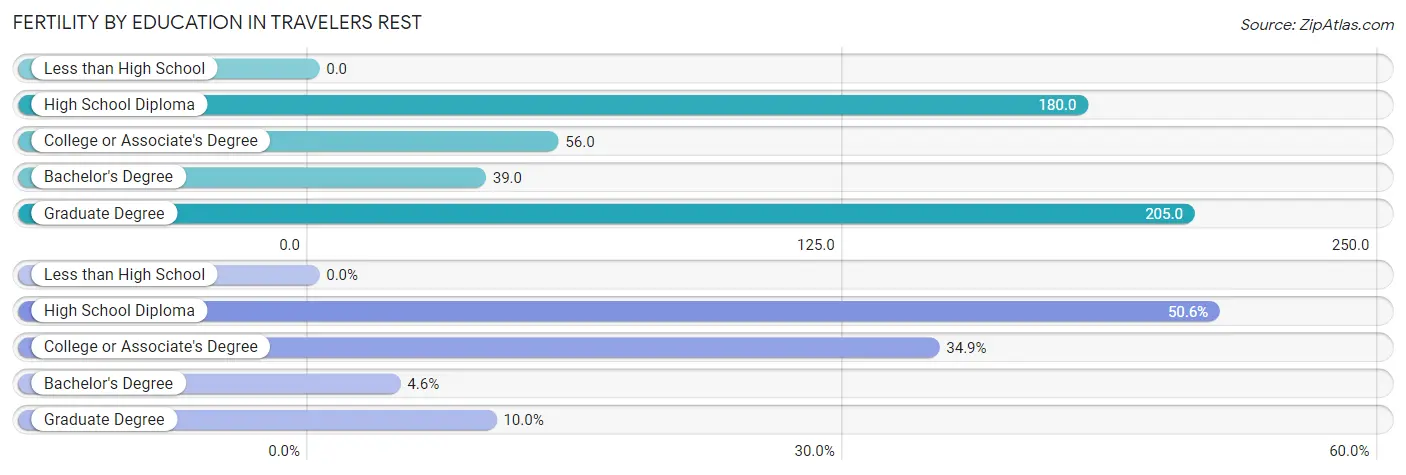
| Educational Attainment | Women with Births | Births / 1,000 Women |
| Less than High School | 0 (0.0%) | 0.0 |
| High School Diploma | 122 (50.6%) | 180.0 |
| College or Associate's Degree | 84 (34.8%) | 56.0 |
| Bachelor's Degree | 11 (4.6%) | 39.0 |
| Graduate Degree | 24 (10.0%) | 205.0 |
| Total | 241 (100.0%) | 88.0 |
Fertility by Education by Marriage Status in Travelers Rest
68.0% of women with births in Travelers Rest are unmarried. Women with the educational attainment of bachelor's degree are most likely to be married with 100.0% of them married at childbirth, while women with the educational attainment of high school diploma are least likely to be married with 100.0% of them unmarried at childbirth.
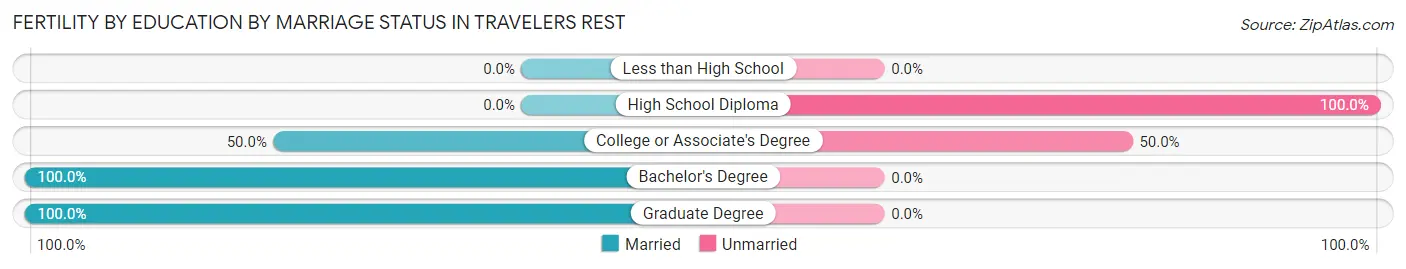
| Educational Attainment | Married | Unmarried |
| Less than High School | 0 (0.0%) | 0 (0.0%) |
| High School Diploma | 0 (0.0%) | 122 (100.0%) |
| College or Associate's Degree | 42 (50.0%) | 42 (50.0%) |
| Bachelor's Degree | 11 (100.0%) | 0 (0.0%) |
| Graduate Degree | 24 (100.0%) | 0 (0.0%) |
| Total | 77 (32.0%) | 164 (68.0%) |
Employment Characteristics in Travelers Rest
Employment by Class of Employer in Travelers Rest
Among the 3,182 employed individuals in Travelers Rest, private company employees (2,152 | 67.6%), not-for-profit organizations (528 | 16.6%), and self-employed (not incorporated) (198 | 6.2%) make up the most common classes of employment.
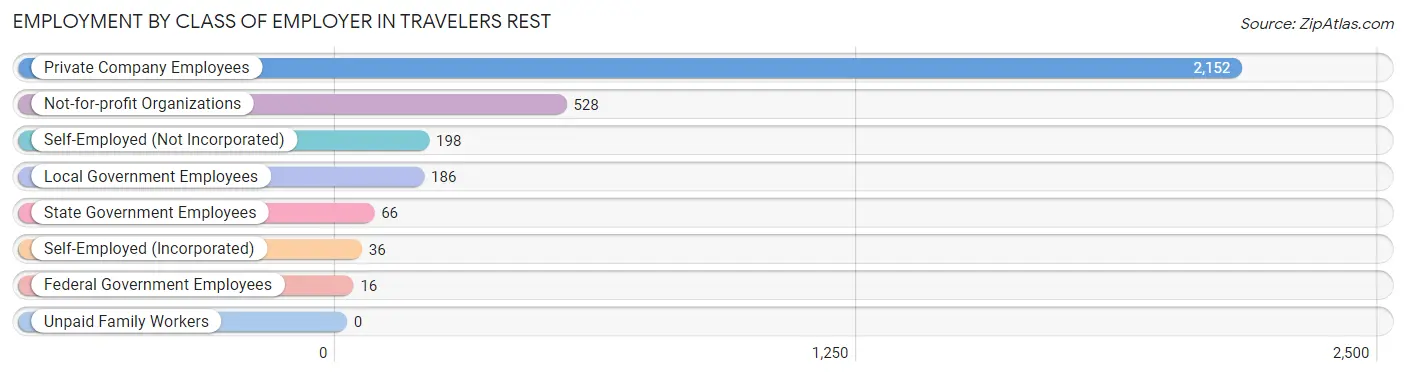
| Employer Class | # Employees | % Employees |
| Private Company Employees | 2,152 | 67.6% |
| Self-Employed (Incorporated) | 36 | 1.1% |
| Self-Employed (Not Incorporated) | 198 | 6.2% |
| Not-for-profit Organizations | 528 | 16.6% |
| Local Government Employees | 186 | 5.9% |
| State Government Employees | 66 | 2.1% |
| Federal Government Employees | 16 | 0.5% |
| Unpaid Family Workers | 0 | 0.0% |
| Total | 3,182 | 100.0% |
Employment Status by Age in Travelers Rest
According to the labor force statistics for Travelers Rest, out of the total population over 16 years of age (6,255), 55.8% or 3,490 individuals are in the labor force, with 6.4% or 223 of them unemployed. The age group with the highest labor force participation rate is 30 to 34 years, with 95.8% or 251 individuals in the labor force. Within the labor force, the 25 to 29 years age range has the highest percentage of unemployed individuals, with 20.8% or 57 of them being unemployed.
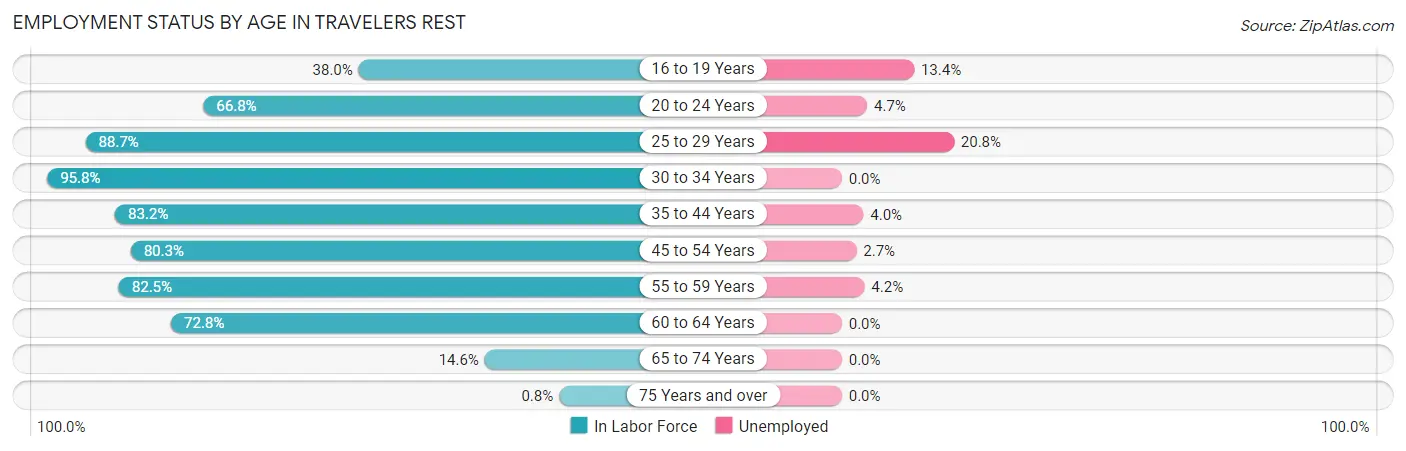
| Age Bracket | In Labor Force | Unemployed |
| 16 to 19 Years | 575 (38.0%) | 77 (13.4%) |
| 20 to 24 Years | 984 (66.8%) | 46 (4.7%) |
| 25 to 29 Years | 274 (88.7%) | 57 (20.8%) |
| 30 to 34 Years | 251 (95.8%) | 0 (0.0%) |
| 35 to 44 Years | 476 (83.2%) | 19 (4.0%) |
| 45 to 54 Years | 558 (80.3%) | 15 (2.7%) |
| 55 to 59 Years | 189 (82.5%) | 8 (4.2%) |
| 60 to 64 Years | 99 (72.8%) | 0 (0.0%) |
| 65 to 74 Years | 80 (14.6%) | 0 (0.0%) |
| 75 Years and over | 4 (0.8%) | 0 (0.0%) |
| Total | 3,490 (55.8%) | 223 (6.4%) |
Employment Status by Educational Attainment in Travelers Rest
According to labor force statistics for Travelers Rest, 83.8% of individuals (1,846) out of the total population between 25 and 64 years of age (2,203) are in the labor force, with 5.4% or 100 of them being unemployed. The group with the highest labor force participation rate are those with the educational attainment of bachelor's degree or higher, with 93.4% or 940 individuals in the labor force. Within the labor force, individuals with high school diploma education have the highest percentage of unemployment, with 24.6% or 57 of them being unemployed.
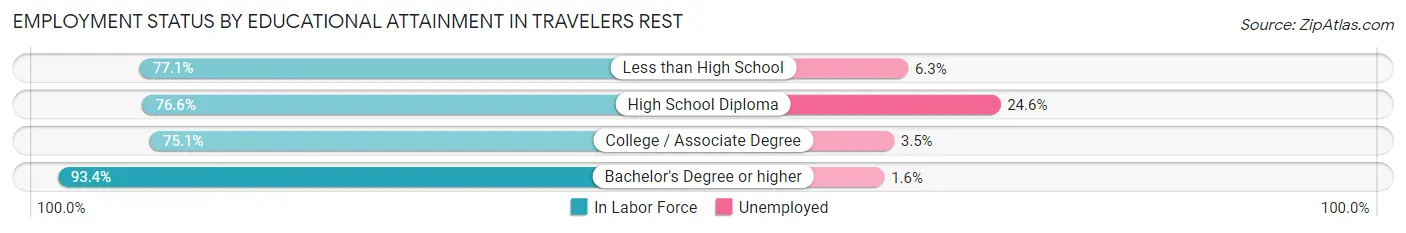
| Educational Attainment | In Labor Force | Unemployed |
| Less than High School | 128 (77.1%) | 10 (6.3%) |
| High School Diploma | 232 (76.6%) | 75 (24.6%) |
| College / Associate Degree | 547 (75.1%) | 25 (3.5%) |
| Bachelor's Degree or higher | 940 (93.4%) | 16 (1.6%) |
| Total | 1,846 (83.8%) | 119 (5.4%) |
Employment Occupations by Sex in Travelers Rest
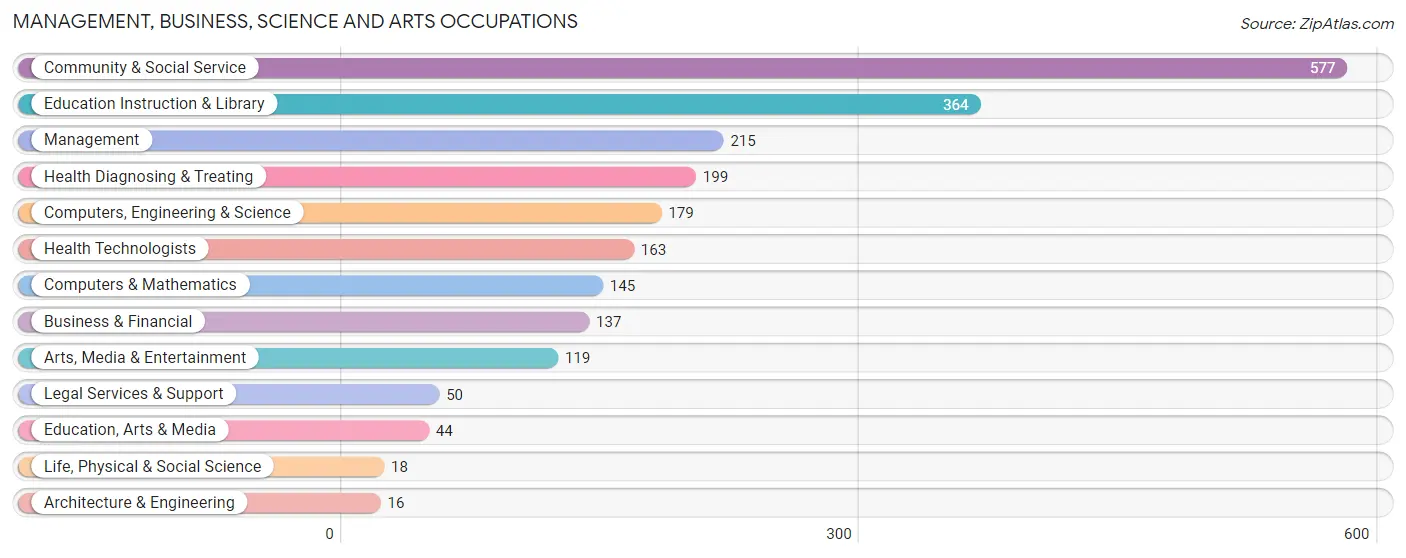
Management, Business, Science and Arts Occupations
The most common Management, Business, Science and Arts occupations in Travelers Rest are Community & Social Service (577 | 17.7%), Education Instruction & Library (364 | 11.1%), Management (215 | 6.6%), Health Diagnosing & Treating (199 | 6.1%), and Computers, Engineering & Science (179 | 5.5%).
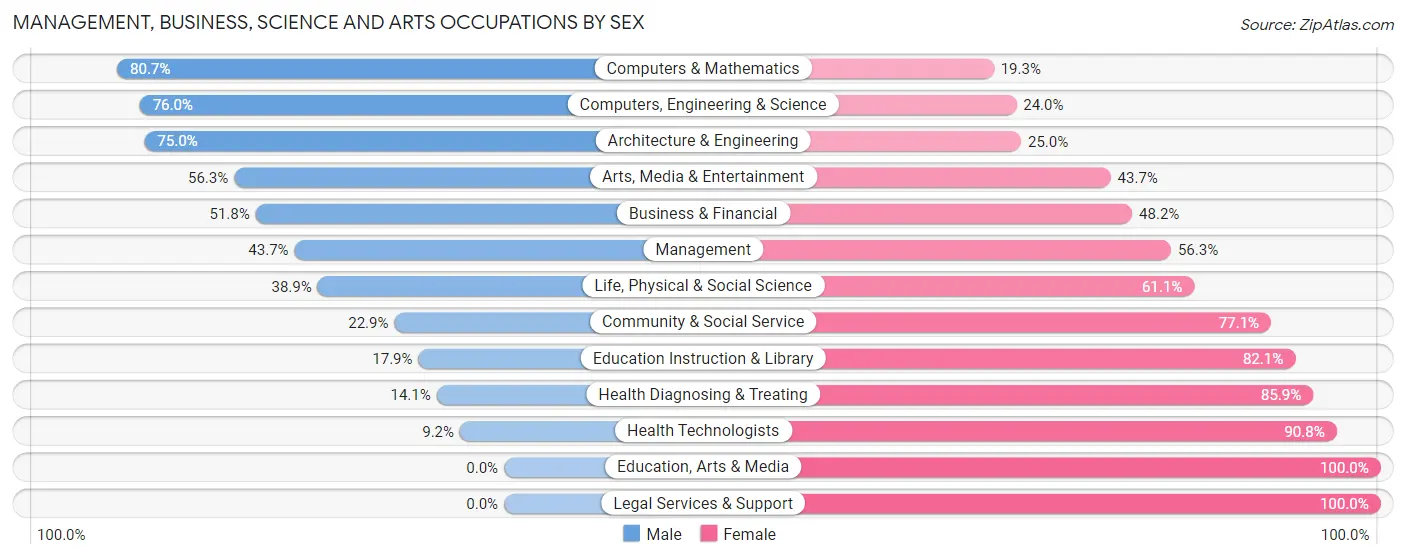
Management, Business, Science and Arts Occupations by Sex
Within the Management, Business, Science and Arts occupations in Travelers Rest, the most male-oriented occupations are Computers & Mathematics (80.7%), Computers, Engineering & Science (76.0%), and Architecture & Engineering (75.0%), while the most female-oriented occupations are Education, Arts & Media (100.0%), Legal Services & Support (100.0%), and Health Technologists (90.8%).
| Occupation | Male | Female |
| Management | 94 (43.7%) | 121 (56.3%) |
| Business & Financial | 71 (51.8%) | 66 (48.2%) |
| Computers, Engineering & Science | 136 (76.0%) | 43 (24.0%) |
| Computers & Mathematics | 117 (80.7%) | 28 (19.3%) |
| Architecture & Engineering | 12 (75.0%) | 4 (25.0%) |
| Life, Physical & Social Science | 7 (38.9%) | 11 (61.1%) |
| Community & Social Service | 132 (22.9%) | 445 (77.1%) |
| Education, Arts & Media | 0 (0.0%) | 44 (100.0%) |
| Legal Services & Support | 0 (0.0%) | 50 (100.0%) |
| Education Instruction & Library | 65 (17.9%) | 299 (82.1%) |
| Arts, Media & Entertainment | 67 (56.3%) | 52 (43.7%) |
| Health Diagnosing & Treating | 28 (14.1%) | 171 (85.9%) |
| Health Technologists | 15 (9.2%) | 148 (90.8%) |
| Total (Category) | 461 (35.3%) | 846 (64.7%) |
| Total (Overall) | 1,282 (39.2%) | 1,986 (60.8%) |
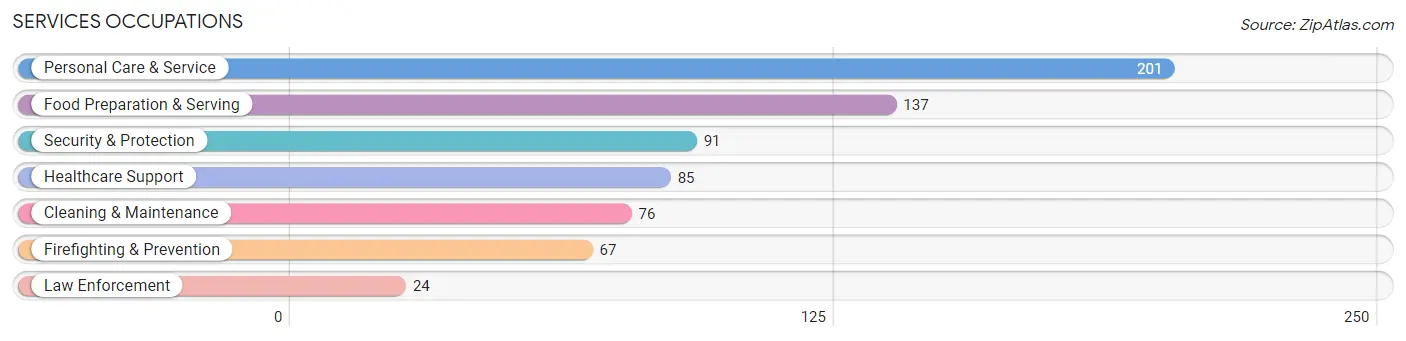
Services Occupations
The most common Services occupations in Travelers Rest are Personal Care & Service (201 | 6.1%), Food Preparation & Serving (137 | 4.2%), Security & Protection (91 | 2.8%), Healthcare Support (85 | 2.6%), and Cleaning & Maintenance (76 | 2.3%).
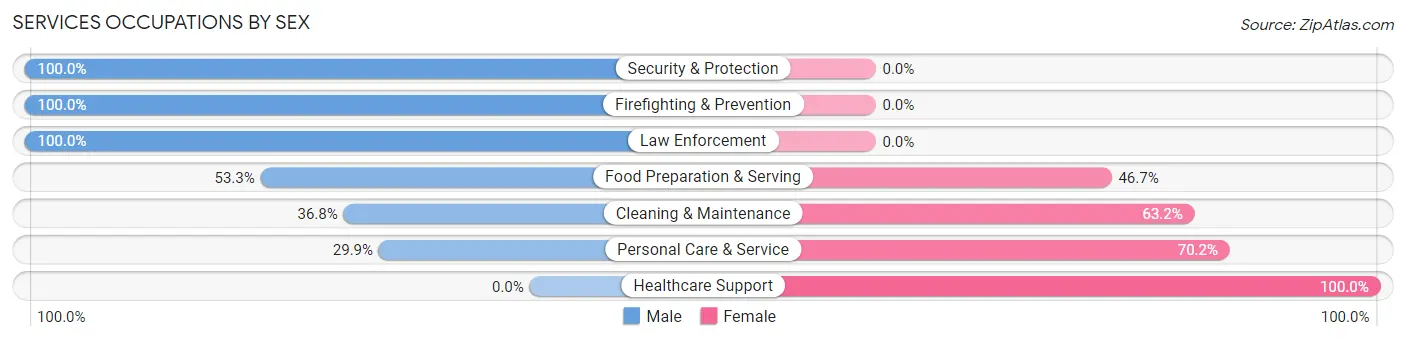
Services Occupations by Sex
Within the Services occupations in Travelers Rest, the most male-oriented occupations are Security & Protection (100.0%), Firefighting & Prevention (100.0%), and Law Enforcement (100.0%), while the most female-oriented occupations are Healthcare Support (100.0%), Personal Care & Service (70.2%), and Cleaning & Maintenance (63.2%).
| Occupation | Male | Female |
| Healthcare Support | 0 (0.0%) | 85 (100.0%) |
| Security & Protection | 91 (100.0%) | 0 (0.0%) |
| Firefighting & Prevention | 67 (100.0%) | 0 (0.0%) |
| Law Enforcement | 24 (100.0%) | 0 (0.0%) |
| Food Preparation & Serving | 73 (53.3%) | 64 (46.7%) |
| Cleaning & Maintenance | 28 (36.8%) | 48 (63.2%) |
| Personal Care & Service | 60 (29.8%) | 141 (70.2%) |
| Total (Category) | 252 (42.7%) | 338 (57.3%) |
| Total (Overall) | 1,282 (39.2%) | 1,986 (60.8%) |
Sales and Office Occupations
The most common Sales and Office occupations in Travelers Rest are Sales & Related (423 | 12.9%), and Office & Administration (334 | 10.2%).
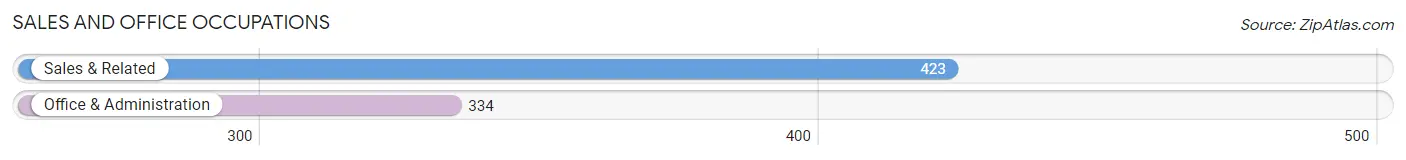
Sales and Office Occupations by Sex

| Occupation | Male | Female |
| Sales & Related | 155 (36.6%) | 268 (63.4%) |
| Office & Administration | 11 (3.3%) | 323 (96.7%) |
| Total (Category) | 166 (21.9%) | 591 (78.1%) |
| Total (Overall) | 1,282 (39.2%) | 1,986 (60.8%) |
Natural Resources, Construction and Maintenance Occupations
The most common Natural Resources, Construction and Maintenance occupations in Travelers Rest are Construction & Extraction (106 | 3.2%), and Installation, Maintenance & Repair (105 | 3.2%).
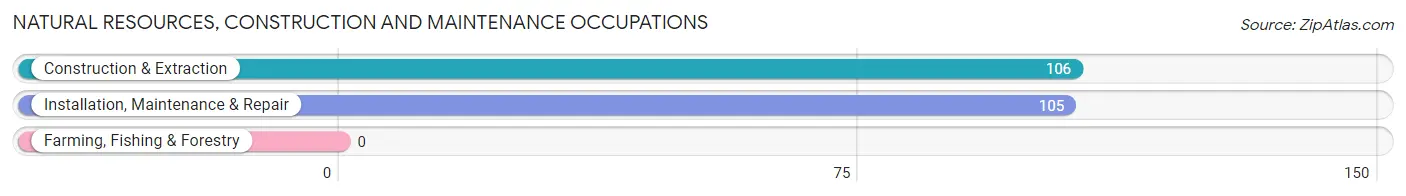
Natural Resources, Construction and Maintenance Occupations by Sex
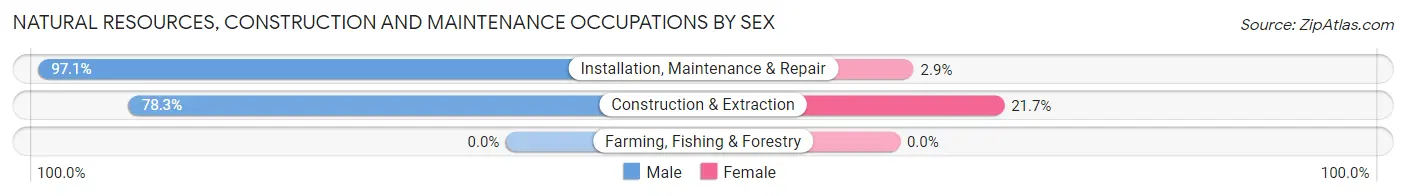
| Occupation | Male | Female |
| Farming, Fishing & Forestry | 0 (0.0%) | 0 (0.0%) |
| Construction & Extraction | 83 (78.3%) | 23 (21.7%) |
| Installation, Maintenance & Repair | 102 (97.1%) | 3 (2.9%) |
| Total (Category) | 185 (87.7%) | 26 (12.3%) |
| Total (Overall) | 1,282 (39.2%) | 1,986 (60.8%) |
Production, Transportation and Moving Occupations
The most common Production, Transportation and Moving occupations in Travelers Rest are Production (211 | 6.5%), Material Moving (150 | 4.6%), and Transportation (42 | 1.3%).
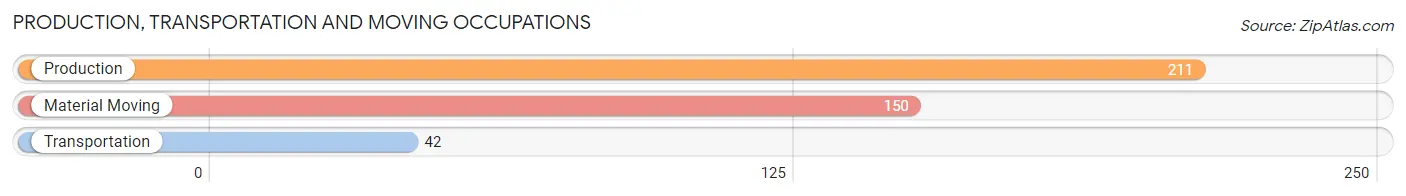
Production, Transportation and Moving Occupations by Sex
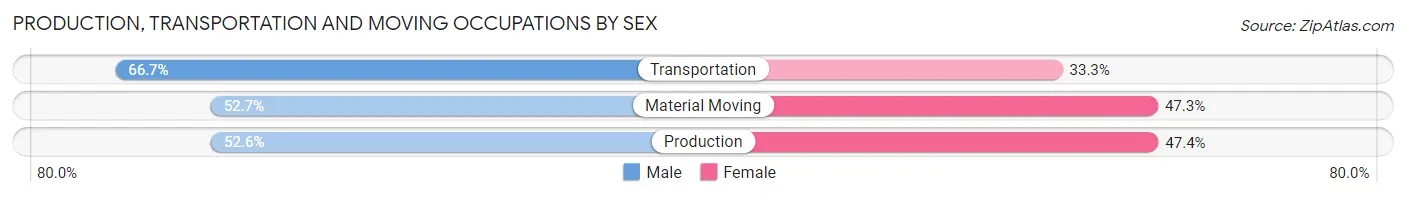
| Occupation | Male | Female |
| Production | 111 (52.6%) | 100 (47.4%) |
| Transportation | 28 (66.7%) | 14 (33.3%) |
| Material Moving | 79 (52.7%) | 71 (47.3%) |
| Total (Category) | 218 (54.1%) | 185 (45.9%) |
| Total (Overall) | 1,282 (39.2%) | 1,986 (60.8%) |
Employment Industries by Sex in Travelers Rest
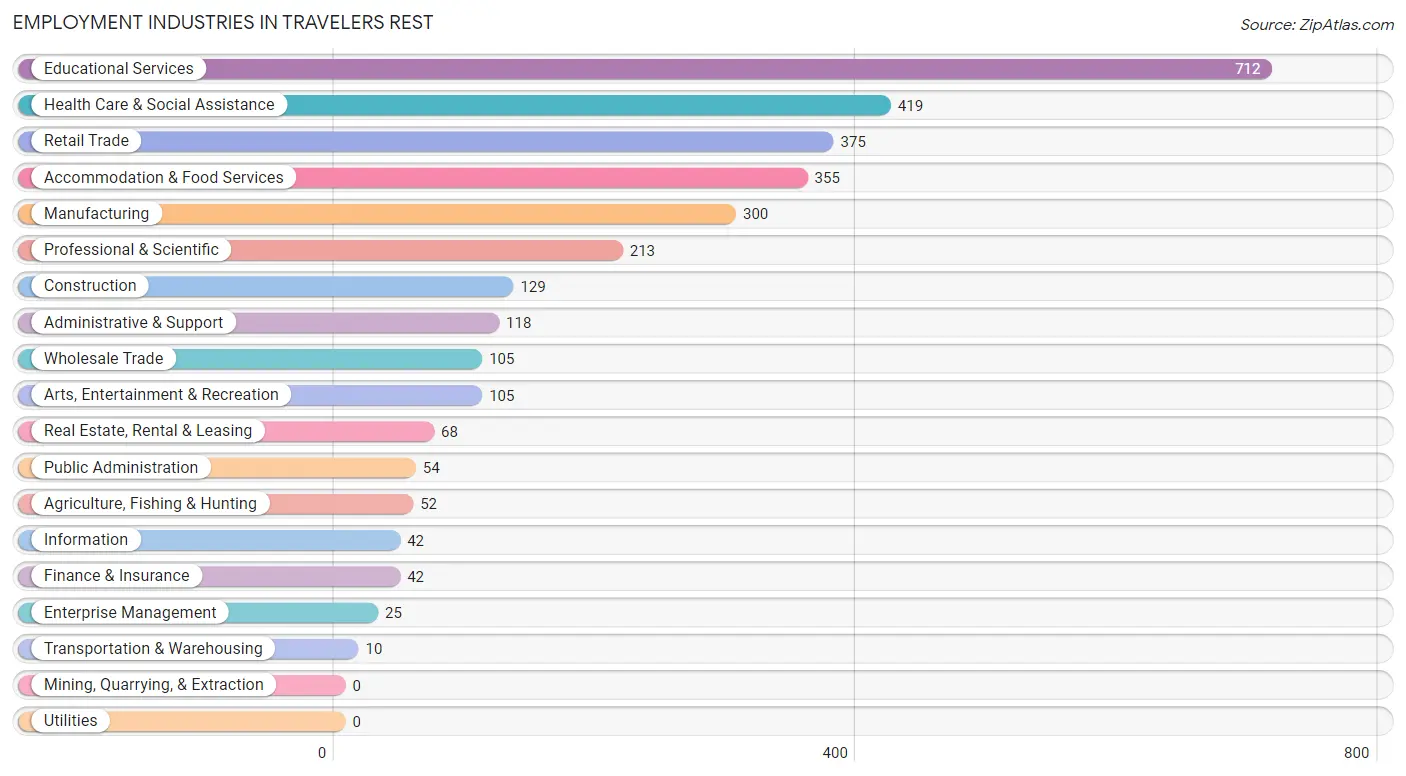
Employment Industries in Travelers Rest
The major employment industries in Travelers Rest include Educational Services (712 | 21.8%), Health Care & Social Assistance (419 | 12.8%), Retail Trade (375 | 11.5%), Accommodation & Food Services (355 | 10.9%), and Manufacturing (300 | 9.2%).
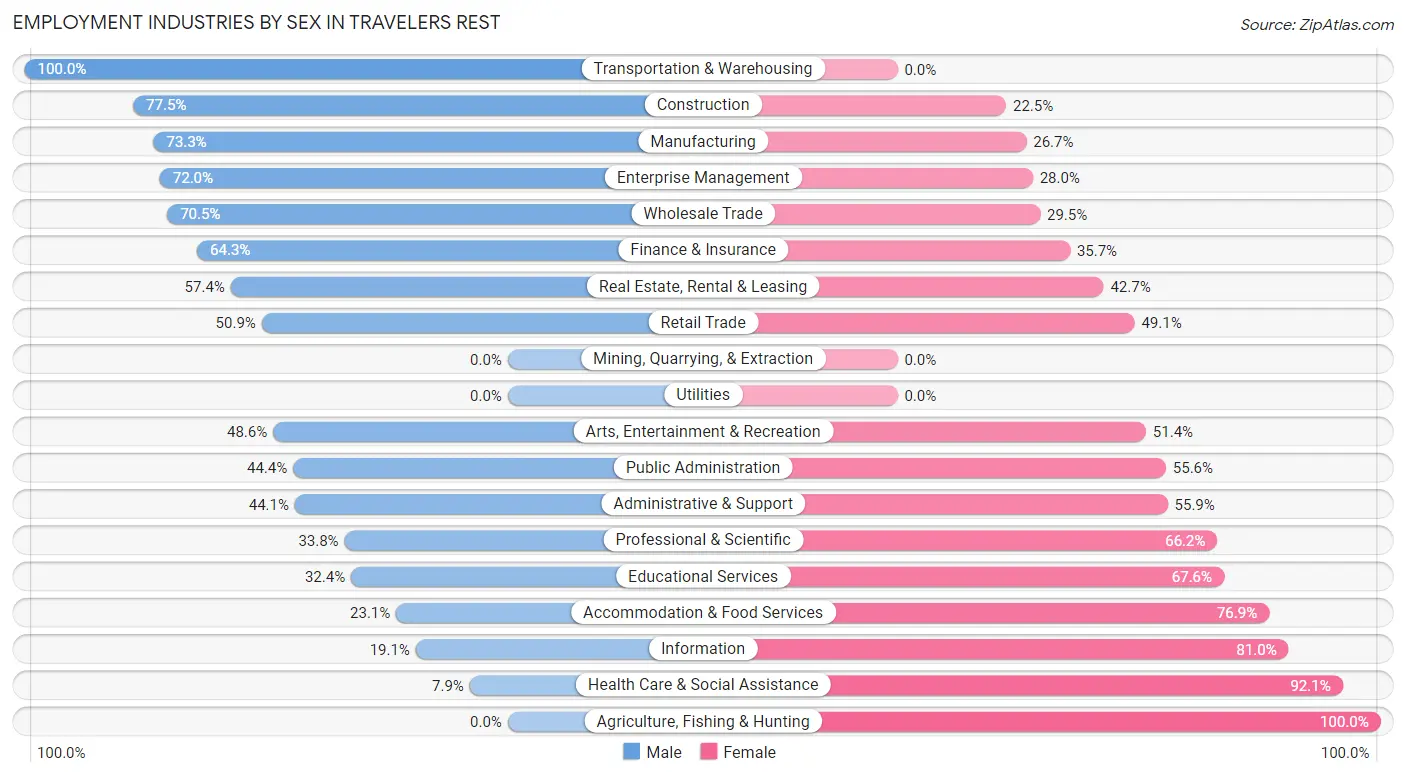
Employment Industries by Sex in Travelers Rest
The Travelers Rest industries that see more men than women are Transportation & Warehousing (100.0%), Construction (77.5%), and Manufacturing (73.3%), whereas the industries that tend to have a higher number of women are Agriculture, Fishing & Hunting (100.0%), Health Care & Social Assistance (92.1%), and Information (80.9%).
| Industry | Male | Female |
| Agriculture, Fishing & Hunting | 0 (0.0%) | 52 (100.0%) |
| Mining, Quarrying, & Extraction | 0 (0.0%) | 0 (0.0%) |
| Construction | 100 (77.5%) | 29 (22.5%) |
| Manufacturing | 220 (73.3%) | 80 (26.7%) |
| Wholesale Trade | 74 (70.5%) | 31 (29.5%) |
| Retail Trade | 191 (50.9%) | 184 (49.1%) |
| Transportation & Warehousing | 10 (100.0%) | 0 (0.0%) |
| Utilities | 0 (0.0%) | 0 (0.0%) |
| Information | 8 (19.1%) | 34 (80.9%) |
| Finance & Insurance | 27 (64.3%) | 15 (35.7%) |
| Real Estate, Rental & Leasing | 39 (57.4%) | 29 (42.6%) |
| Professional & Scientific | 72 (33.8%) | 141 (66.2%) |
| Enterprise Management | 18 (72.0%) | 7 (28.0%) |
| Administrative & Support | 52 (44.1%) | 66 (55.9%) |
| Educational Services | 231 (32.4%) | 481 (67.6%) |
| Health Care & Social Assistance | 33 (7.9%) | 386 (92.1%) |
| Arts, Entertainment & Recreation | 51 (48.6%) | 54 (51.4%) |
| Accommodation & Food Services | 82 (23.1%) | 273 (76.9%) |
| Public Administration | 24 (44.4%) | 30 (55.6%) |
| Total | 1,282 (39.2%) | 1,986 (60.8%) |
Education in Travelers Rest
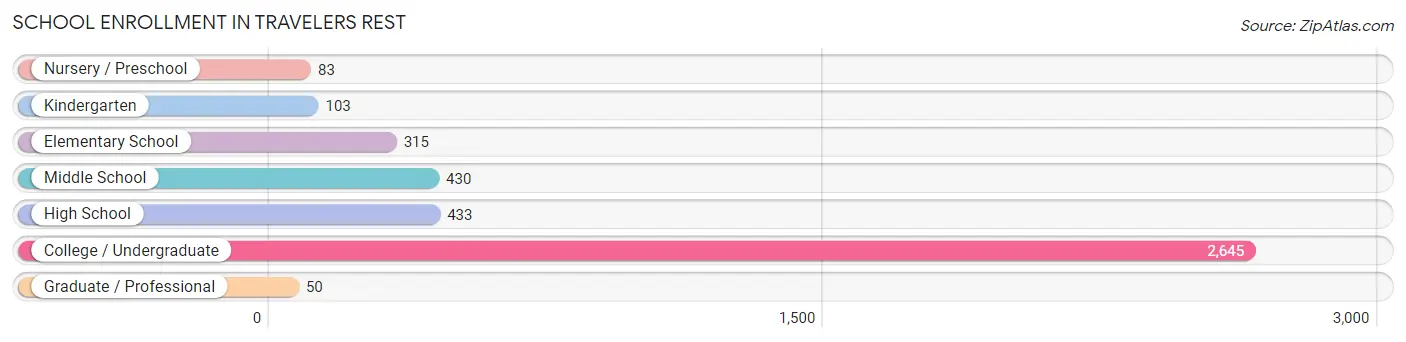
School Enrollment in Travelers Rest
The most common levels of schooling among the 4,059 students in Travelers Rest are college / undergraduate (2,645 | 65.2%), high school (433 | 10.7%), and middle school (430 | 10.6%).
| School Level | # Students | % Students |
| Nursery / Preschool | 83 | 2.0% |
| Kindergarten | 103 | 2.5% |
| Elementary School | 315 | 7.8% |
| Middle School | 430 | 10.6% |
| High School | 433 | 10.7% |
| College / Undergraduate | 2,645 | 65.2% |
| Graduate / Professional | 50 | 1.2% |
| Total | 4,059 | 100.0% |
School Enrollment by Age by Funding Source in Travelers Rest
Out of a total of 4,059 students who are enrolled in schools in Travelers Rest, 2,602 (64.1%) attend a private institution, while the remaining 1,457 (35.9%) are enrolled in public schools. The age group of 18 to 19 year olds has the highest likelihood of being enrolled in private schools, with 1,068 (93.6% in the age bracket) enrolled. Conversely, the age group of 35 years and over has the lowest likelihood of being enrolled in a private school, with 76 (91.6% in the age bracket) attending a public institution.
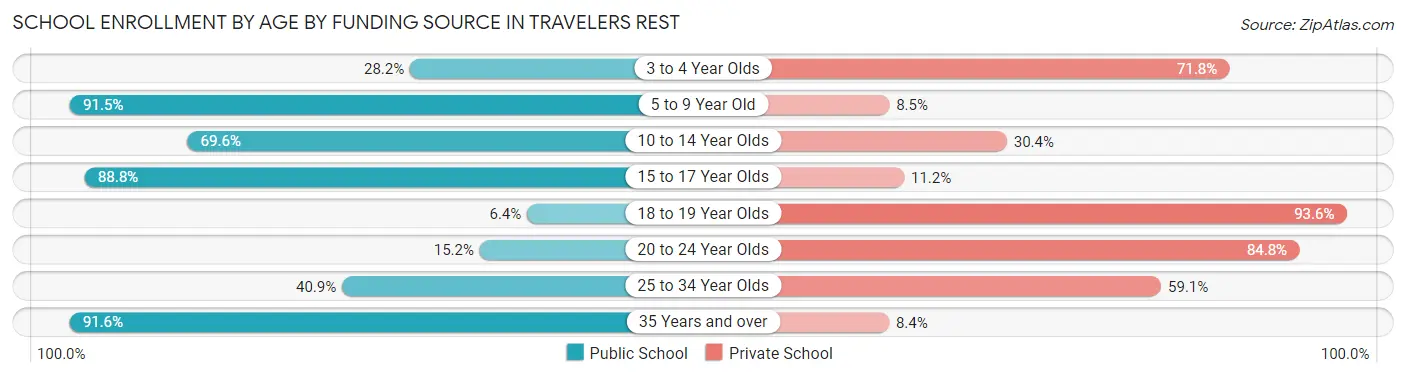
| Age Bracket | Public School | Private School |
| 3 to 4 Year Olds | 22 (28.2%) | 56 (71.8%) |
| 5 to 9 Year Old | 356 (91.5%) | 33 (8.5%) |
| 10 to 14 Year Olds | 440 (69.6%) | 192 (30.4%) |
| 15 to 17 Year Olds | 237 (88.8%) | 30 (11.2%) |
| 18 to 19 Year Olds | 73 (6.4%) | 1,068 (93.6%) |
| 20 to 24 Year Olds | 206 (15.2%) | 1,148 (84.8%) |
| 25 to 34 Year Olds | 47 (40.9%) | 68 (59.1%) |
| 35 Years and over | 76 (91.6%) | 7 (8.4%) |
| Total | 1,457 (35.9%) | 2,602 (64.1%) |
Educational Attainment by Field of Study in Travelers Rest
Liberal arts & history (243 | 16.4%), science & technology (165 | 11.1%), social sciences (160 | 10.8%), education (152 | 10.2%), and engineering (130 | 8.7%) are the most common fields of study among 1,485 individuals in Travelers Rest who have obtained a bachelor's degree or higher.
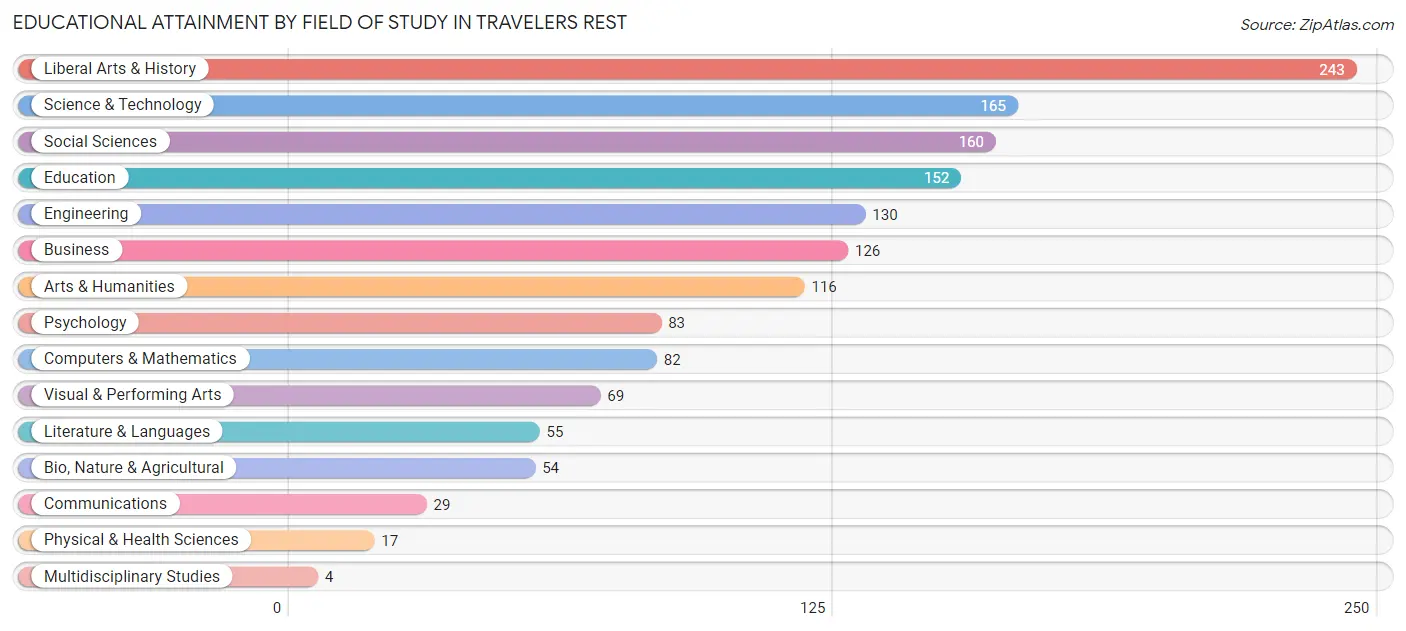
| Field of Study | # Graduates | % Graduates |
| Computers & Mathematics | 82 | 5.5% |
| Bio, Nature & Agricultural | 54 | 3.6% |
| Physical & Health Sciences | 17 | 1.1% |
| Psychology | 83 | 5.6% |
| Social Sciences | 160 | 10.8% |
| Engineering | 130 | 8.7% |
| Multidisciplinary Studies | 4 | 0.3% |
| Science & Technology | 165 | 11.1% |
| Business | 126 | 8.5% |
| Education | 152 | 10.2% |
| Literature & Languages | 55 | 3.7% |
| Liberal Arts & History | 243 | 16.4% |
| Visual & Performing Arts | 69 | 4.6% |
| Communications | 29 | 1.9% |
| Arts & Humanities | 116 | 7.8% |
| Total | 1,485 | 100.0% |
Transportation & Commute in Travelers Rest
Vehicle Availability by Sex in Travelers Rest
The most prevalent vehicle ownership categories in Travelers Rest are males with 2 vehicles (357, accounting for 41.5%) and females with 2 vehicles (427, making up 28.6%).
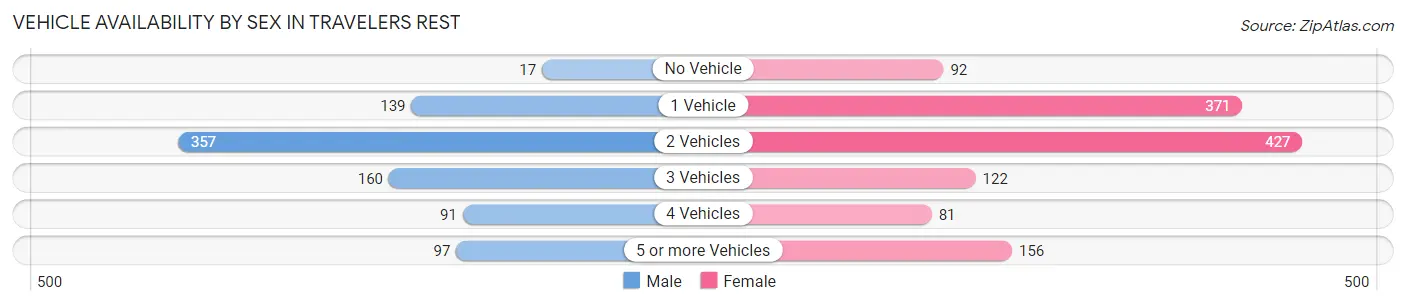
| Vehicles Available | Male | Female |
| No Vehicle | 17 (2.0%) | 92 (7.4%) |
| 1 Vehicle | 139 (16.1%) | 371 (29.7%) |
| 2 Vehicles | 357 (41.5%) | 427 (34.2%) |
| 3 Vehicles | 160 (18.6%) | 122 (9.8%) |
| 4 Vehicles | 91 (10.6%) | 81 (6.5%) |
| 5 or more Vehicles | 97 (11.3%) | 156 (12.5%) |
| Total | 861 (100.0%) | 1,249 (100.0%) |
Commute Time in Travelers Rest
The most frequently occuring commute durations in Travelers Rest are 5 to 9 minutes (649 commuters, 22.6%), 30 to 34 minutes (585 commuters, 20.3%), and 15 to 19 minutes (364 commuters, 12.7%).
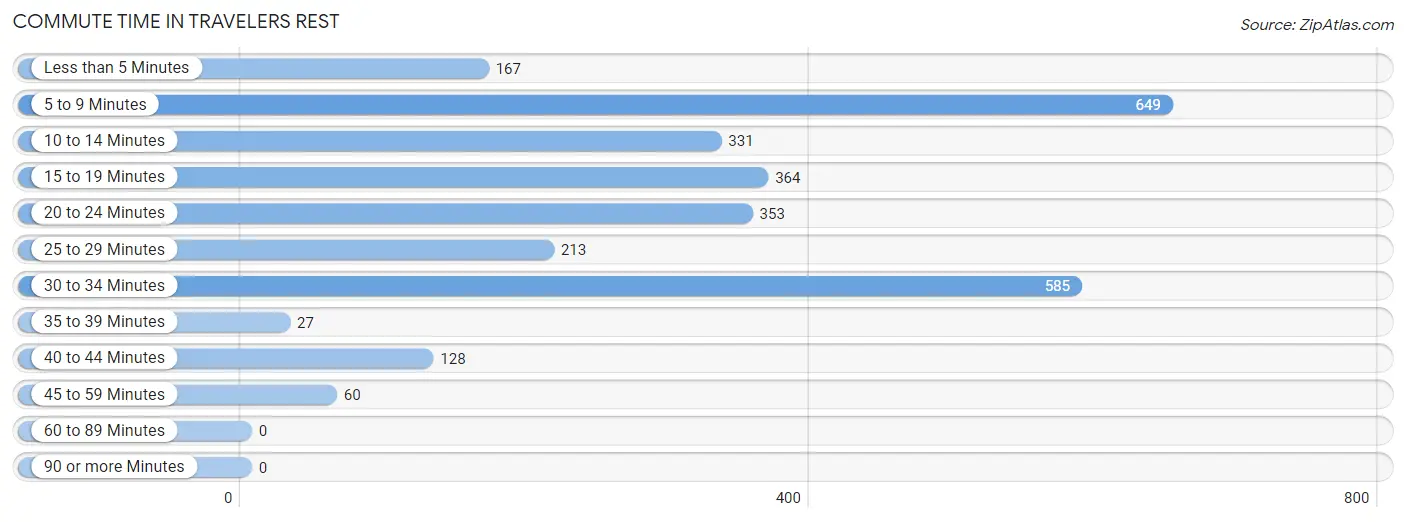
| Commute Time | # Commuters | % Commuters |
| Less than 5 Minutes | 167 | 5.8% |
| 5 to 9 Minutes | 649 | 22.6% |
| 10 to 14 Minutes | 331 | 11.5% |
| 15 to 19 Minutes | 364 | 12.7% |
| 20 to 24 Minutes | 353 | 12.3% |
| 25 to 29 Minutes | 213 | 7.4% |
| 30 to 34 Minutes | 585 | 20.3% |
| 35 to 39 Minutes | 27 | 0.9% |
| 40 to 44 Minutes | 128 | 4.4% |
| 45 to 59 Minutes | 60 | 2.1% |
| 60 to 89 Minutes | 0 | 0.0% |
| 90 or more Minutes | 0 | 0.0% |
Commute Time by Sex in Travelers Rest
The most common commute times in Travelers Rest are 5 to 9 minutes (280 commuters, 24.1%) for males and 5 to 9 minutes (369 commuters, 21.5%) for females.
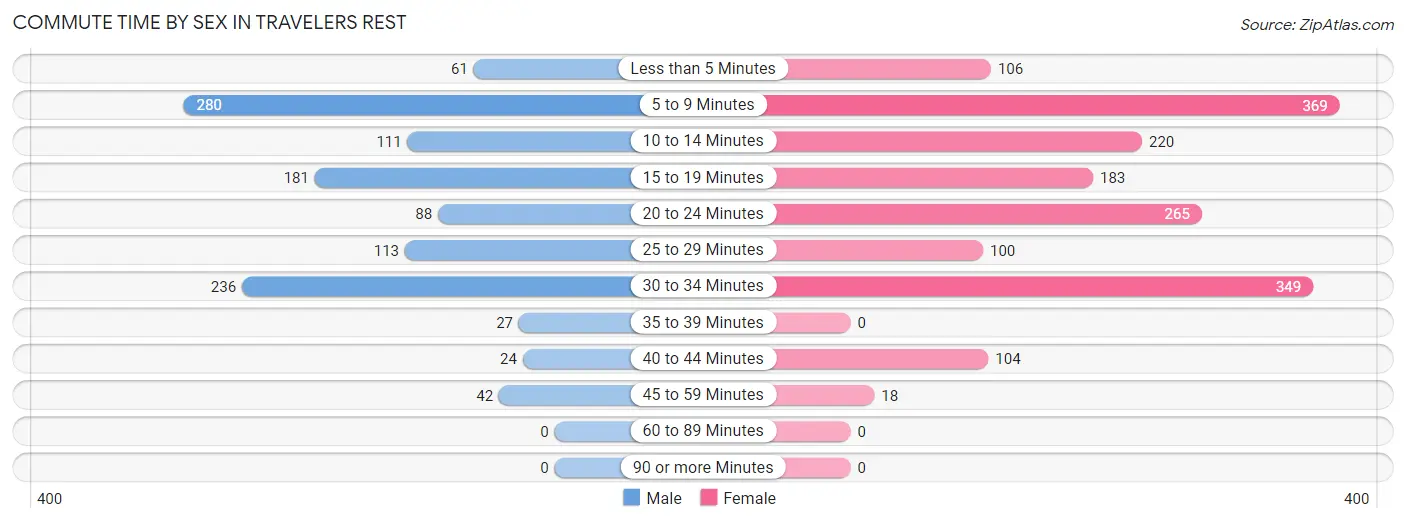
| Commute Time | Male | Female |
| Less than 5 Minutes | 61 (5.2%) | 106 (6.2%) |
| 5 to 9 Minutes | 280 (24.1%) | 369 (21.5%) |
| 10 to 14 Minutes | 111 (9.5%) | 220 (12.8%) |
| 15 to 19 Minutes | 181 (15.6%) | 183 (10.7%) |
| 20 to 24 Minutes | 88 (7.6%) | 265 (15.5%) |
| 25 to 29 Minutes | 113 (9.7%) | 100 (5.8%) |
| 30 to 34 Minutes | 236 (20.3%) | 349 (20.4%) |
| 35 to 39 Minutes | 27 (2.3%) | 0 (0.0%) |
| 40 to 44 Minutes | 24 (2.1%) | 104 (6.1%) |
| 45 to 59 Minutes | 42 (3.6%) | 18 (1.1%) |
| 60 to 89 Minutes | 0 (0.0%) | 0 (0.0%) |
| 90 or more Minutes | 0 (0.0%) | 0 (0.0%) |
Time of Departure to Work by Sex in Travelers Rest
The most frequent times of departure to work in Travelers Rest are 4:00 PM to 11:59 PM (174, 15.0%) for males and 12:00 PM to 3:59 PM (301, 17.6%) for females.
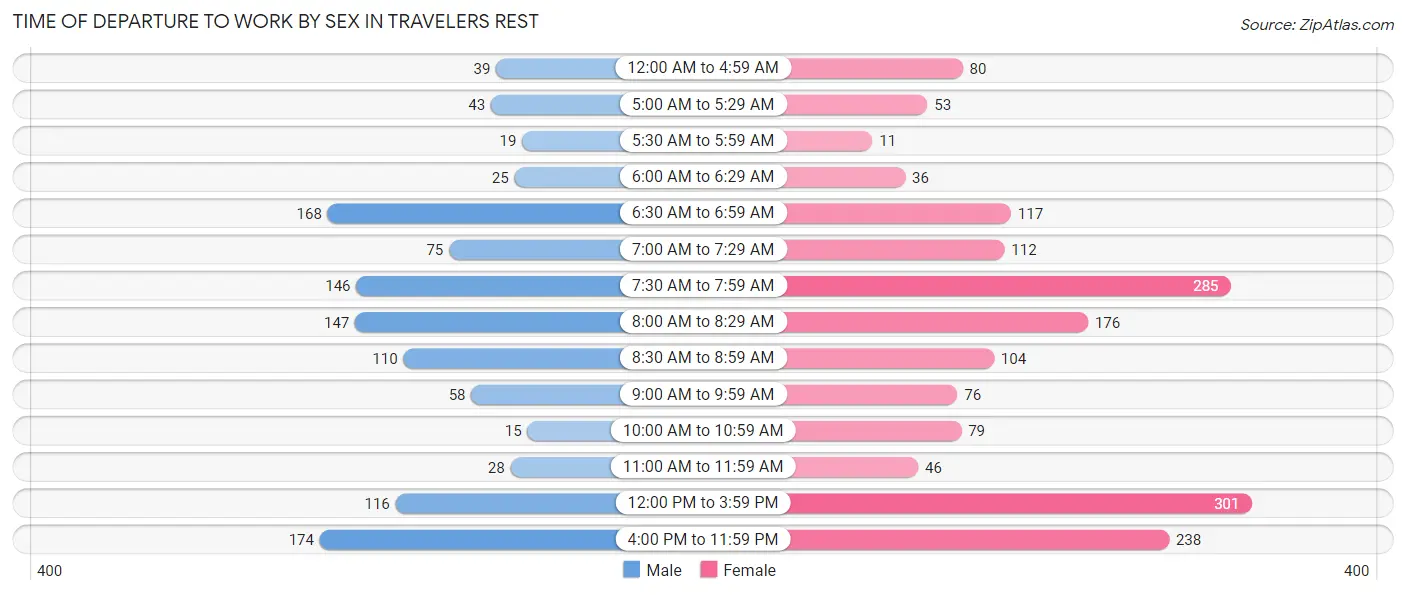
| Time of Departure | Male | Female |
| 12:00 AM to 4:59 AM | 39 (3.4%) | 80 (4.7%) |
| 5:00 AM to 5:29 AM | 43 (3.7%) | 53 (3.1%) |
| 5:30 AM to 5:59 AM | 19 (1.6%) | 11 (0.6%) |
| 6:00 AM to 6:29 AM | 25 (2.1%) | 36 (2.1%) |
| 6:30 AM to 6:59 AM | 168 (14.4%) | 117 (6.8%) |
| 7:00 AM to 7:29 AM | 75 (6.5%) | 112 (6.5%) |
| 7:30 AM to 7:59 AM | 146 (12.6%) | 285 (16.6%) |
| 8:00 AM to 8:29 AM | 147 (12.6%) | 176 (10.3%) |
| 8:30 AM to 8:59 AM | 110 (9.5%) | 104 (6.1%) |
| 9:00 AM to 9:59 AM | 58 (5.0%) | 76 (4.4%) |
| 10:00 AM to 10:59 AM | 15 (1.3%) | 79 (4.6%) |
| 11:00 AM to 11:59 AM | 28 (2.4%) | 46 (2.7%) |
| 12:00 PM to 3:59 PM | 116 (10.0%) | 301 (17.6%) |
| 4:00 PM to 11:59 PM | 174 (15.0%) | 238 (13.9%) |
| Total | 1,163 (100.0%) | 1,714 (100.0%) |
Housing Occupancy in Travelers Rest
Occupancy by Ownership in Travelers Rest
Of the total 2,095 dwellings in Travelers Rest, owner-occupied units account for 1,089 (52.0%), while renter-occupied units make up 1,006 (48.0%).
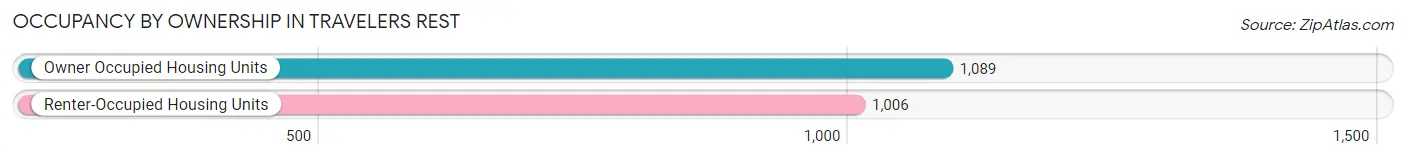
| Occupancy | # Housing Units | % Housing Units |
| Owner Occupied Housing Units | 1,089 | 52.0% |
| Renter-Occupied Housing Units | 1,006 | 48.0% |
| Total Occupied Housing Units | 2,095 | 100.0% |
Occupancy by Household Size in Travelers Rest
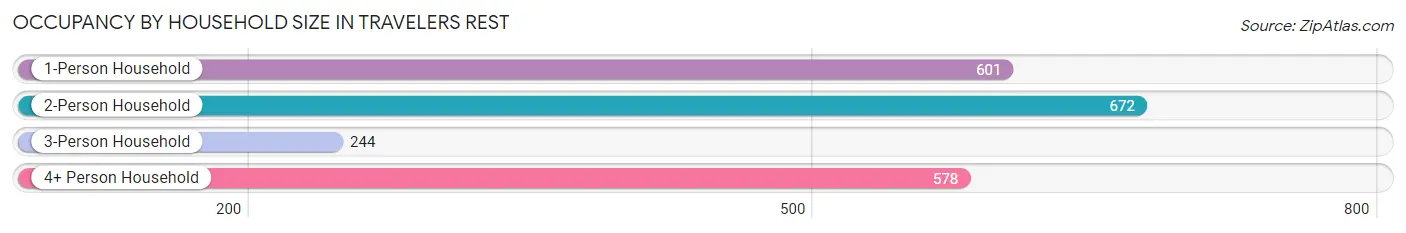
| Household Size | # Housing Units | % Housing Units |
| 1-Person Household | 601 | 28.7% |
| 2-Person Household | 672 | 32.1% |
| 3-Person Household | 244 | 11.7% |
| 4+ Person Household | 578 | 27.6% |
| Total Housing Units | 2,095 | 100.0% |
Occupancy by Ownership by Household Size in Travelers Rest
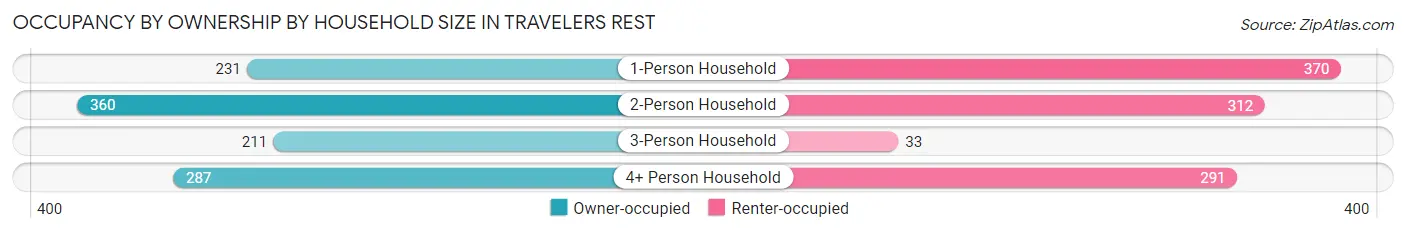
| Household Size | Owner-occupied | Renter-occupied |
| 1-Person Household | 231 (38.4%) | 370 (61.6%) |
| 2-Person Household | 360 (53.6%) | 312 (46.4%) |
| 3-Person Household | 211 (86.5%) | 33 (13.5%) |
| 4+ Person Household | 287 (49.6%) | 291 (50.3%) |
| Total Housing Units | 1,089 (52.0%) | 1,006 (48.0%) |
Occupancy by Educational Attainment in Travelers Rest
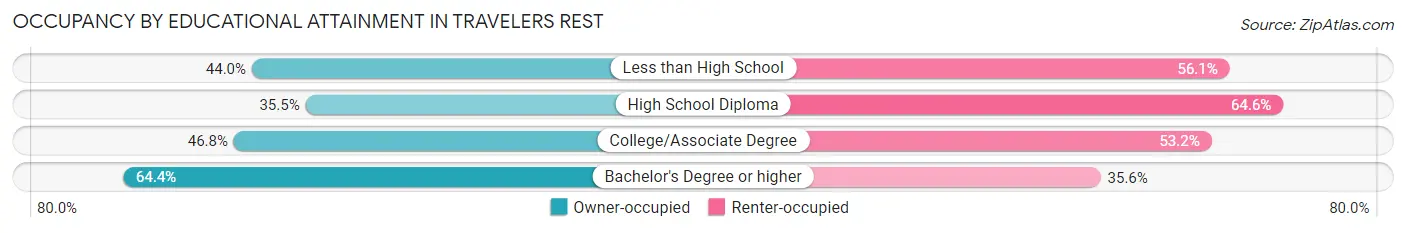
| Household Size | Owner-occupied | Renter-occupied |
| Less than High School | 69 (44.0%) | 88 (56.0%) |
| High School Diploma | 117 (35.4%) | 213 (64.5%) |
| College/Associate Degree | 353 (46.8%) | 401 (53.2%) |
| Bachelor's Degree or higher | 550 (64.4%) | 304 (35.6%) |
Occupancy by Age of Householder in Travelers Rest
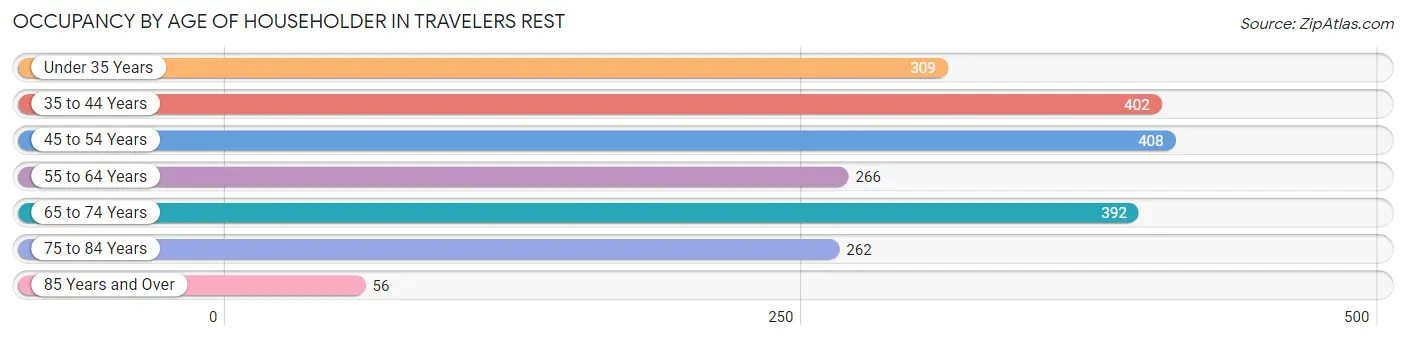
| Age Bracket | # Households | % Households |
| Under 35 Years | 309 | 14.7% |
| 35 to 44 Years | 402 | 19.2% |
| 45 to 54 Years | 408 | 19.5% |
| 55 to 64 Years | 266 | 12.7% |
| 65 to 74 Years | 392 | 18.7% |
| 75 to 84 Years | 262 | 12.5% |
| 85 Years and Over | 56 | 2.7% |
| Total | 2,095 | 100.0% |
Housing Finances in Travelers Rest
Median Income by Occupancy in Travelers Rest
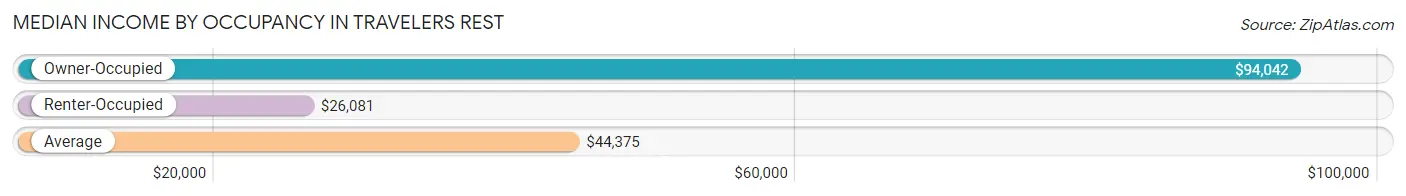
| Occupancy Type | # Households | Median Income |
| Owner-Occupied | 1,089 (52.0%) | $94,042 |
| Renter-Occupied | 1,006 (48.0%) | $26,081 |
| Average | 2,095 (100.0%) | $44,375 |
Occupancy by Householder Income Bracket in Travelers Rest
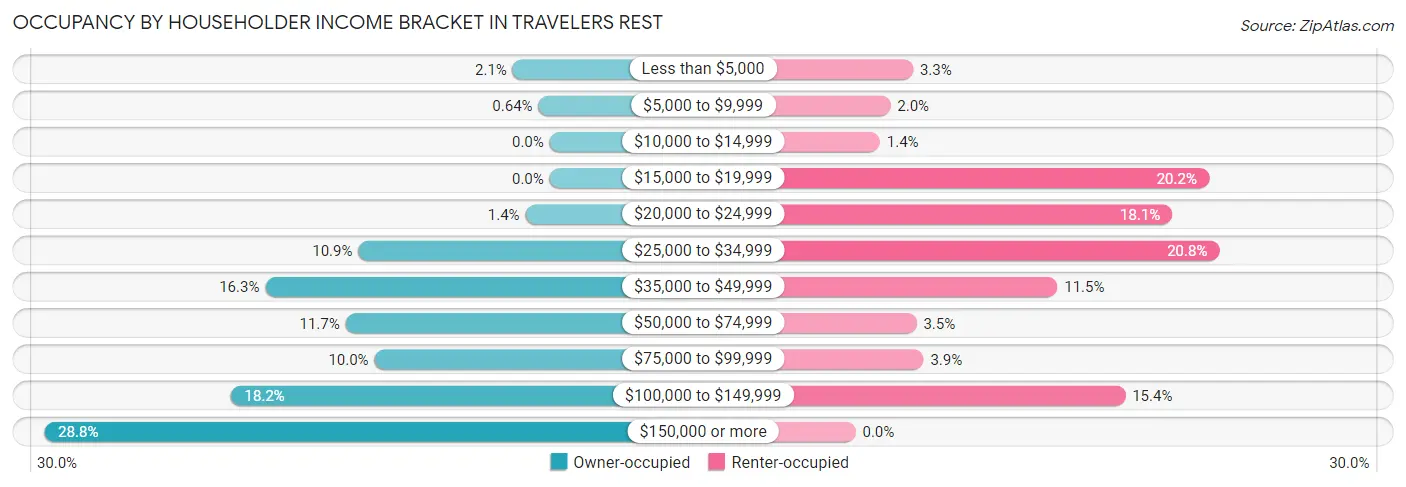
| Income Bracket | Owner-occupied | Renter-occupied |
| Less than $5,000 | 23 (2.1%) | 33 (3.3%) |
| $5,000 to $9,999 | 7 (0.6%) | 20 (2.0%) |
| $10,000 to $14,999 | 0 (0.0%) | 14 (1.4%) |
| $15,000 to $19,999 | 0 (0.0%) | 203 (20.2%) |
| $20,000 to $24,999 | 15 (1.4%) | 182 (18.1%) |
| $25,000 to $34,999 | 119 (10.9%) | 209 (20.8%) |
| $35,000 to $49,999 | 177 (16.3%) | 116 (11.5%) |
| $50,000 to $74,999 | 127 (11.7%) | 35 (3.5%) |
| $75,000 to $99,999 | 109 (10.0%) | 39 (3.9%) |
| $100,000 to $149,999 | 198 (18.2%) | 155 (15.4%) |
| $150,000 or more | 314 (28.8%) | 0 (0.0%) |
| Total | 1,089 (100.0%) | 1,006 (100.0%) |
Monthly Housing Cost Tiers in Travelers Rest
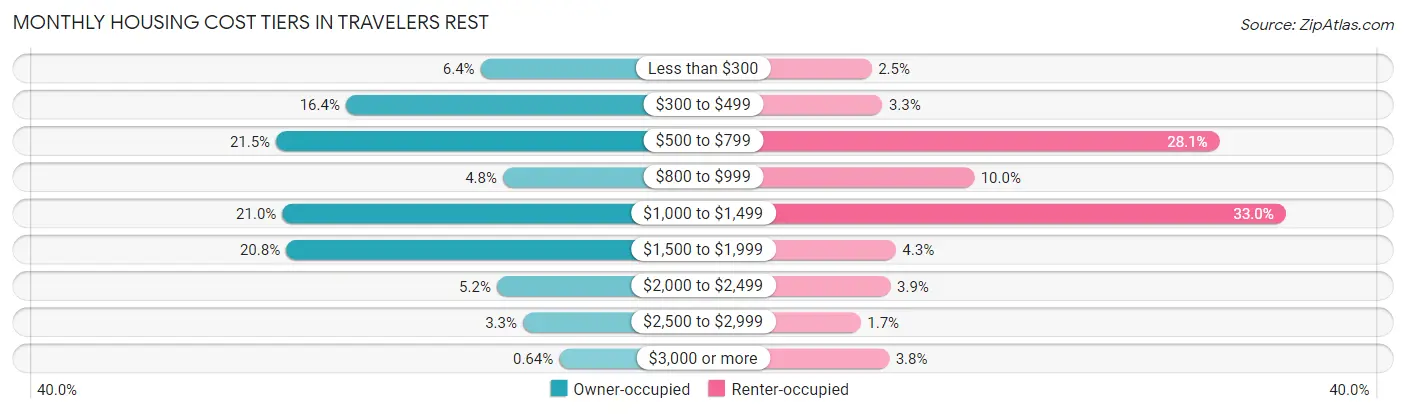
| Monthly Cost | Owner-occupied | Renter-occupied |
| Less than $300 | 70 (6.4%) | 25 (2.5%) |
| $300 to $499 | 178 (16.4%) | 33 (3.3%) |
| $500 to $799 | 234 (21.5%) | 283 (28.1%) |
| $800 to $999 | 52 (4.8%) | 101 (10.0%) |
| $1,000 to $1,499 | 229 (21.0%) | 332 (33.0%) |
| $1,500 to $1,999 | 226 (20.7%) | 43 (4.3%) |
| $2,000 to $2,499 | 57 (5.2%) | 39 (3.9%) |
| $2,500 to $2,999 | 36 (3.3%) | 17 (1.7%) |
| $3,000 or more | 7 (0.6%) | 38 (3.8%) |
| Total | 1,089 (100.0%) | 1,006 (100.0%) |
Physical Housing Characteristics in Travelers Rest
Housing Structures in Travelers Rest
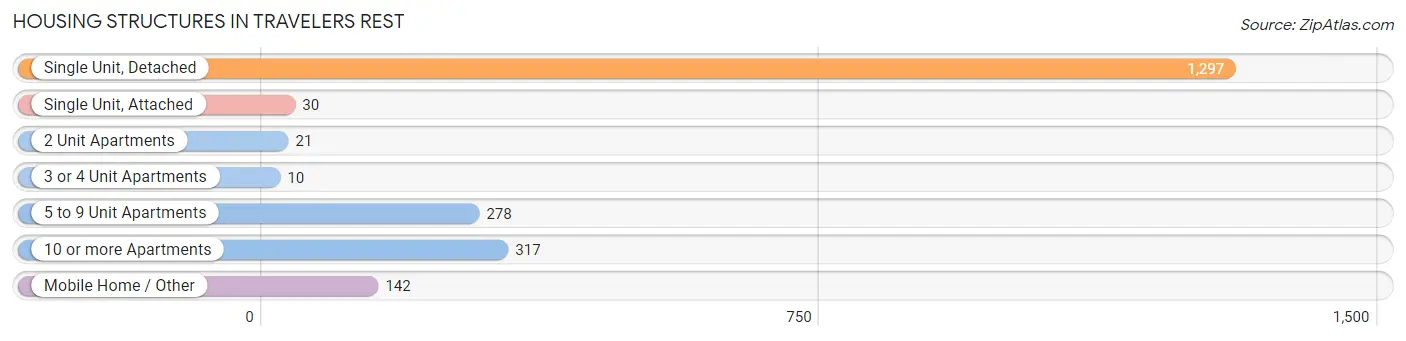
| Structure Type | # Housing Units | % Housing Units |
| Single Unit, Detached | 1,297 | 61.9% |
| Single Unit, Attached | 30 | 1.4% |
| 2 Unit Apartments | 21 | 1.0% |
| 3 or 4 Unit Apartments | 10 | 0.5% |
| 5 to 9 Unit Apartments | 278 | 13.3% |
| 10 or more Apartments | 317 | 15.1% |
| Mobile Home / Other | 142 | 6.8% |
| Total | 2,095 | 100.0% |
Housing Structures by Occupancy in Travelers Rest
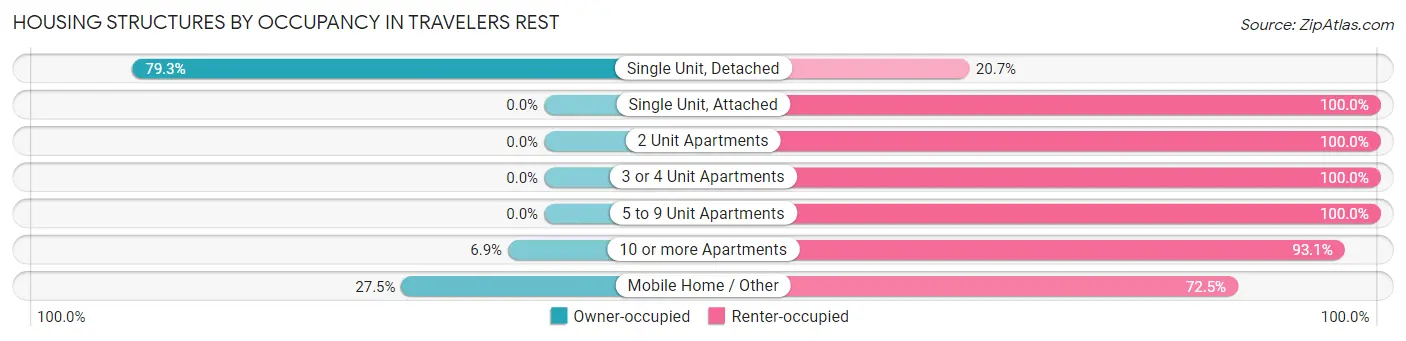
| Structure Type | Owner-occupied | Renter-occupied |
| Single Unit, Detached | 1,028 (79.3%) | 269 (20.7%) |
| Single Unit, Attached | 0 (0.0%) | 30 (100.0%) |
| 2 Unit Apartments | 0 (0.0%) | 21 (100.0%) |
| 3 or 4 Unit Apartments | 0 (0.0%) | 10 (100.0%) |
| 5 to 9 Unit Apartments | 0 (0.0%) | 278 (100.0%) |
| 10 or more Apartments | 22 (6.9%) | 295 (93.1%) |
| Mobile Home / Other | 39 (27.5%) | 103 (72.5%) |
| Total | 1,089 (52.0%) | 1,006 (48.0%) |
Housing Structures by Number of Rooms in Travelers Rest
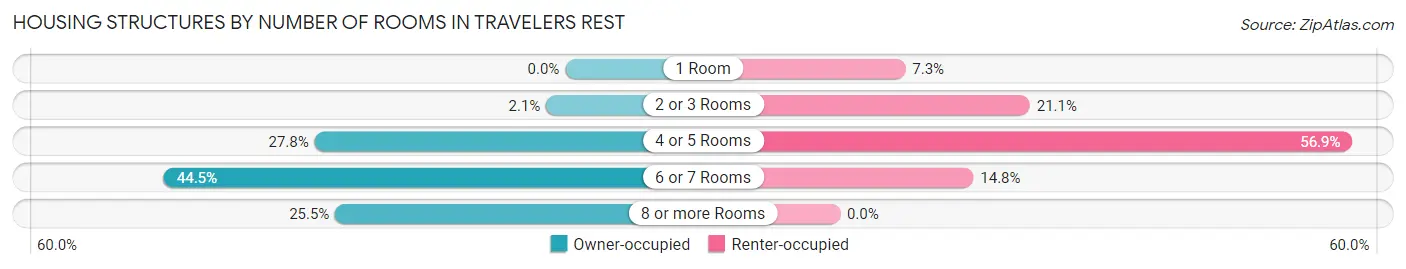
| Number of Rooms | Owner-occupied | Renter-occupied |
| 1 Room | 0 (0.0%) | 73 (7.3%) |
| 2 or 3 Rooms | 23 (2.1%) | 212 (21.1%) |
| 4 or 5 Rooms | 303 (27.8%) | 572 (56.9%) |
| 6 or 7 Rooms | 485 (44.5%) | 149 (14.8%) |
| 8 or more Rooms | 278 (25.5%) | 0 (0.0%) |
| Total | 1,089 (100.0%) | 1,006 (100.0%) |
Housing Structure by Heating Type in Travelers Rest
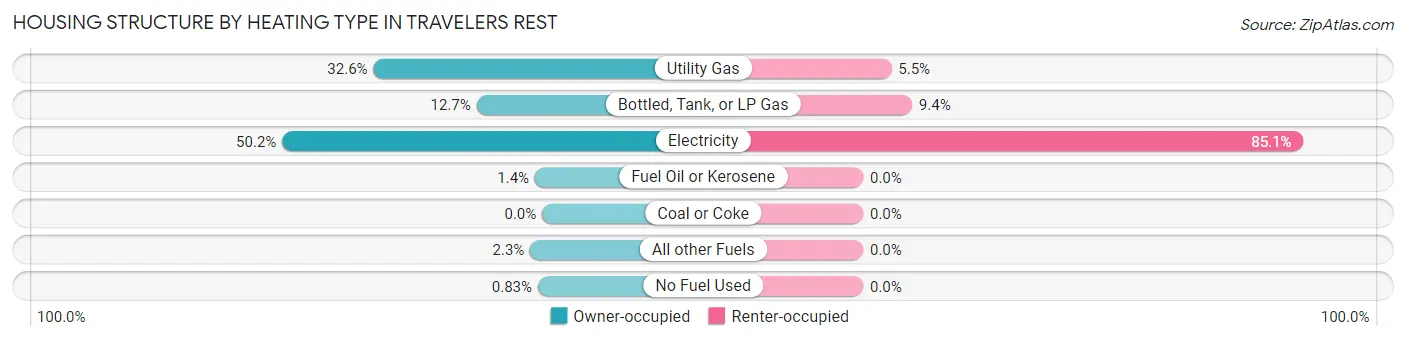
| Heating Type | Owner-occupied | Renter-occupied |
| Utility Gas | 355 (32.6%) | 55 (5.5%) |
| Bottled, Tank, or LP Gas | 138 (12.7%) | 95 (9.4%) |
| Electricity | 547 (50.2%) | 856 (85.1%) |
| Fuel Oil or Kerosene | 15 (1.4%) | 0 (0.0%) |
| Coal or Coke | 0 (0.0%) | 0 (0.0%) |
| All other Fuels | 25 (2.3%) | 0 (0.0%) |
| No Fuel Used | 9 (0.8%) | 0 (0.0%) |
| Total | 1,089 (100.0%) | 1,006 (100.0%) |
Household Vehicle Usage in Travelers Rest
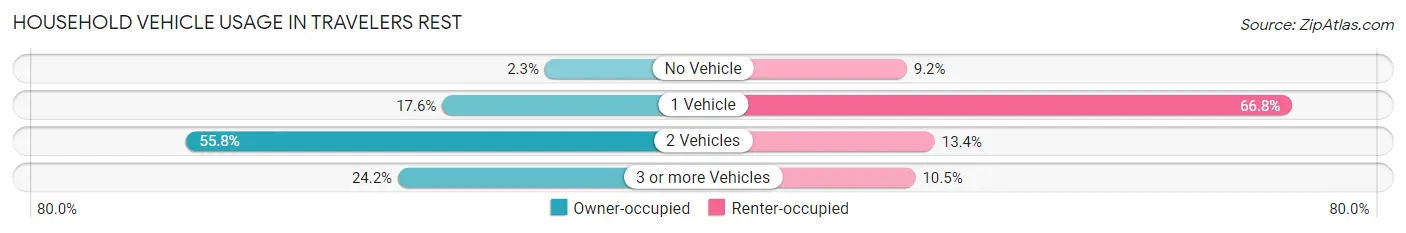
| Vehicles per Household | Owner-occupied | Renter-occupied |
| No Vehicle | 25 (2.3%) | 93 (9.2%) |
| 1 Vehicle | 192 (17.6%) | 672 (66.8%) |
| 2 Vehicles | 608 (55.8%) | 135 (13.4%) |
| 3 or more Vehicles | 264 (24.2%) | 106 (10.5%) |
| Total | 1,089 (100.0%) | 1,006 (100.0%) |
Real Estate & Mortgages in Travelers Rest
Real Estate and Mortgage Overview in Travelers Rest
| Characteristic | Without Mortgage | With Mortgage |
| Housing Units | 402 | 687 |
| Median Property Value | $260,600 | $277,900 |
| Median Household Income | $39,487 | $276 |
| Monthly Housing Costs | $415 | $7 |
| Real Estate Taxes | $1,537 | $22 |
Property Value by Mortgage Status in Travelers Rest
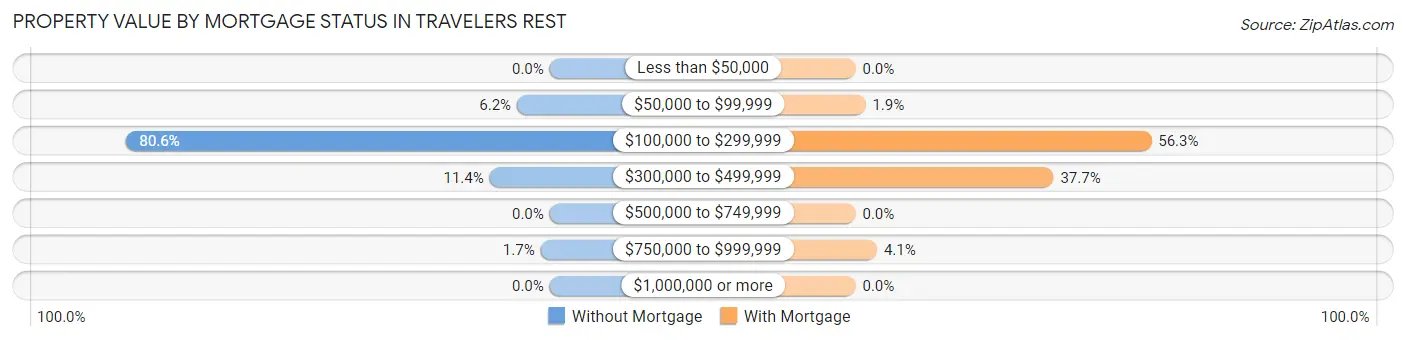
| Property Value | Without Mortgage | With Mortgage |
| Less than $50,000 | 0 (0.0%) | 0 (0.0%) |
| $50,000 to $99,999 | 25 (6.2%) | 13 (1.9%) |
| $100,000 to $299,999 | 324 (80.6%) | 387 (56.3%) |
| $300,000 to $499,999 | 46 (11.4%) | 259 (37.7%) |
| $500,000 to $749,999 | 0 (0.0%) | 0 (0.0%) |
| $750,000 to $999,999 | 7 (1.7%) | 28 (4.1%) |
| $1,000,000 or more | 0 (0.0%) | 0 (0.0%) |
| Total | 402 (100.0%) | 687 (100.0%) |
Household Income by Mortgage Status in Travelers Rest
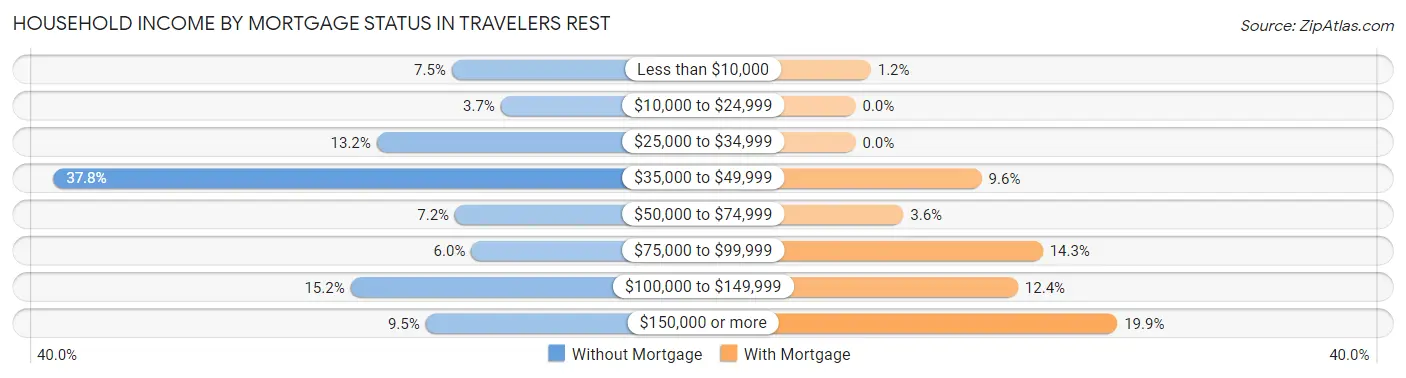
| Household Income | Without Mortgage | With Mortgage |
| Less than $10,000 | 30 (7.5%) | 8 (1.2%) |
| $10,000 to $24,999 | 15 (3.7%) | 0 (0.0%) |
| $25,000 to $34,999 | 53 (13.2%) | 0 (0.0%) |
| $35,000 to $49,999 | 152 (37.8%) | 66 (9.6%) |
| $50,000 to $74,999 | 29 (7.2%) | 25 (3.6%) |
| $75,000 to $99,999 | 24 (6.0%) | 98 (14.3%) |
| $100,000 to $149,999 | 61 (15.2%) | 85 (12.4%) |
| $150,000 or more | 38 (9.5%) | 137 (19.9%) |
| Total | 402 (100.0%) | 687 (100.0%) |
Property Value to Household Income Ratio in Travelers Rest
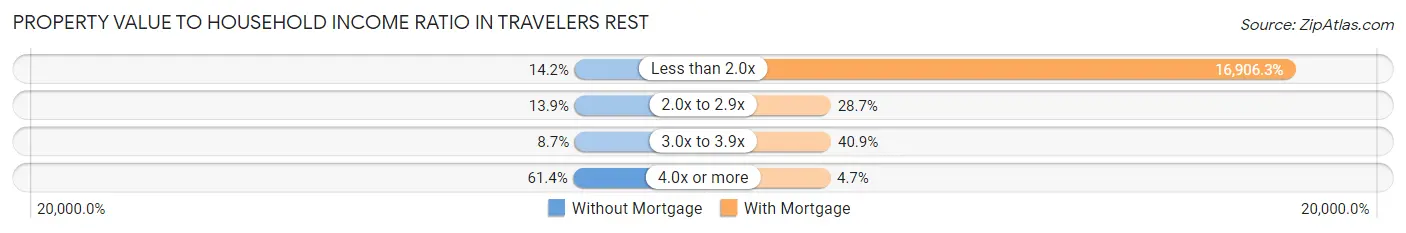
| Value-to-Income Ratio | Without Mortgage | With Mortgage |
| Less than 2.0x | 57 (14.2%) | 116,146 (16,906.3%) |
| 2.0x to 2.9x | 56 (13.9%) | 197 (28.7%) |
| 3.0x to 3.9x | 35 (8.7%) | 281 (40.9%) |
| 4.0x or more | 247 (61.4%) | 32 (4.7%) |
| Total | 402 (100.0%) | 687 (100.0%) |
Real Estate Taxes by Mortgage Status in Travelers Rest
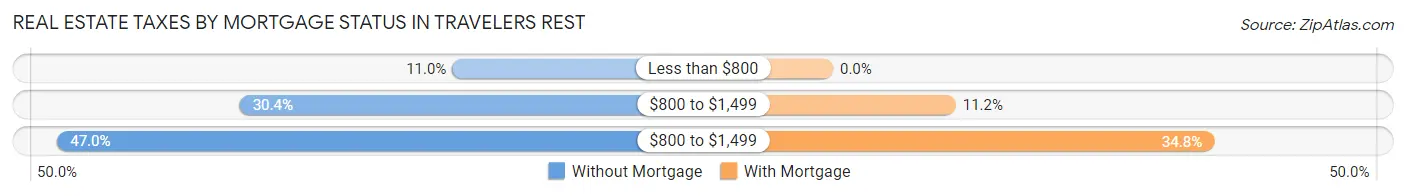
| Property Taxes | Without Mortgage | With Mortgage |
| Less than $800 | 44 (11.0%) | 0 (0.0%) |
| $800 to $1,499 | 122 (30.3%) | 77 (11.2%) |
| $800 to $1,499 | 189 (47.0%) | 239 (34.8%) |
| Total | 402 (100.0%) | 687 (100.0%) |
Health & Disability in Travelers Rest
Health Insurance Coverage by Age in Travelers Rest
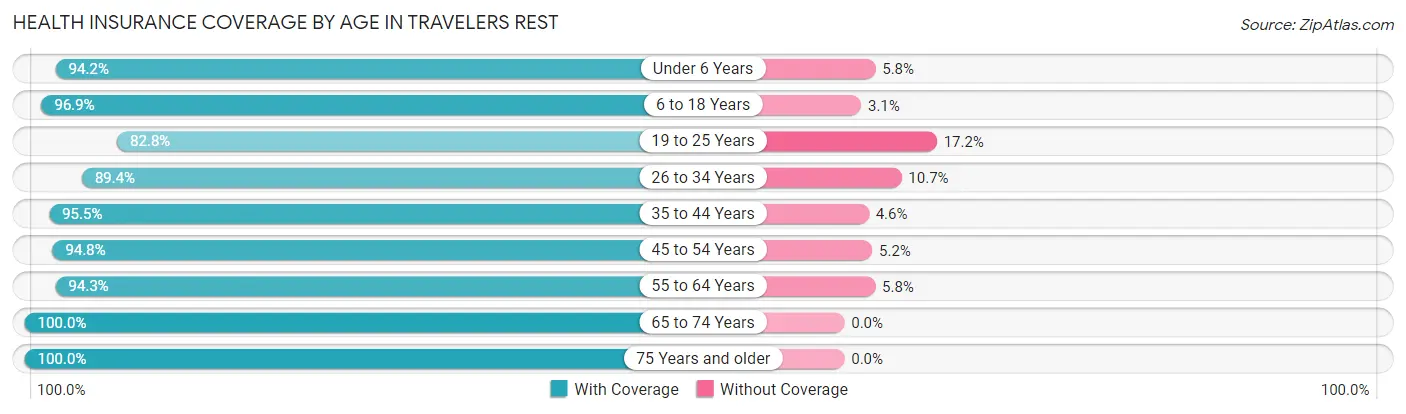
| Age Bracket | With Coverage | Without Coverage |
| Under 6 Years | 620 (94.2%) | 38 (5.8%) |
| 6 to 18 Years | 1,553 (96.9%) | 50 (3.1%) |
| 19 to 25 Years | 2,042 (82.8%) | 425 (17.2%) |
| 26 to 34 Years | 428 (89.3%) | 51 (10.6%) |
| 35 to 44 Years | 546 (95.5%) | 26 (4.5%) |
| 45 to 54 Years | 659 (94.8%) | 36 (5.2%) |
| 55 to 64 Years | 344 (94.3%) | 21 (5.8%) |
| 65 to 74 Years | 537 (100.0%) | 0 (0.0%) |
| 75 Years and older | 499 (100.0%) | 0 (0.0%) |
| Total | 7,228 (91.8%) | 647 (8.2%) |
Health Insurance Coverage by Citizenship Status in Travelers Rest
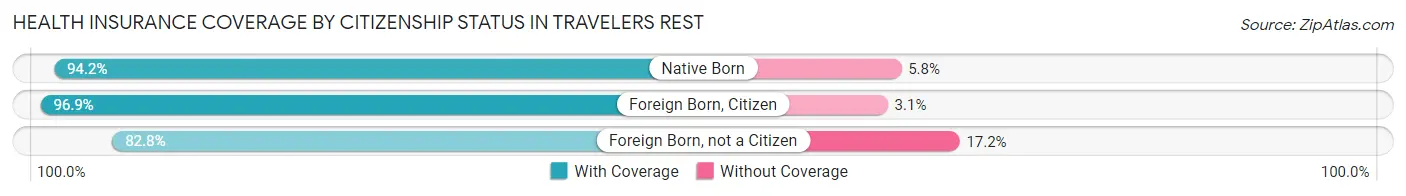
| Citizenship Status | With Coverage | Without Coverage |
| Native Born | 620 (94.2%) | 38 (5.8%) |
| Foreign Born, Citizen | 1,553 (96.9%) | 50 (3.1%) |
| Foreign Born, not a Citizen | 2,042 (82.8%) | 425 (17.2%) |
Health Insurance Coverage by Household Income in Travelers Rest
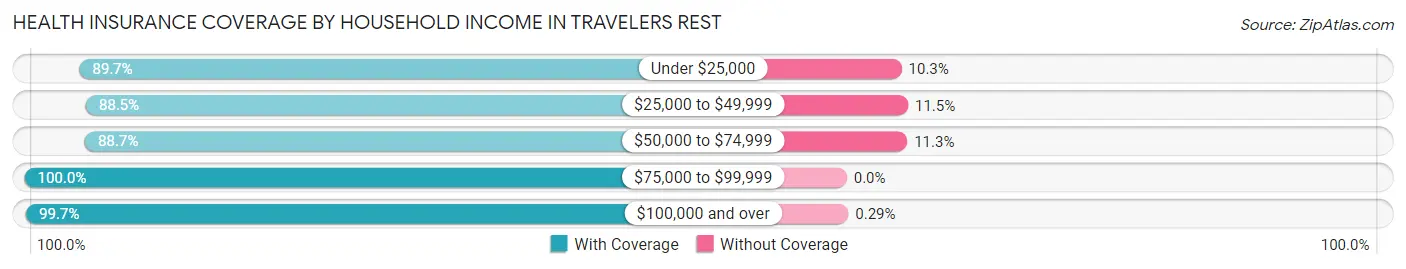
| Household Income | With Coverage | Without Coverage |
| Under $25,000 | 786 (89.7%) | 90 (10.3%) |
| $25,000 to $49,999 | 1,457 (88.5%) | 189 (11.5%) |
| $50,000 to $74,999 | 376 (88.7%) | 48 (11.3%) |
| $75,000 to $99,999 | 396 (100.0%) | 0 (0.0%) |
| $100,000 and over | 2,099 (99.7%) | 6 (0.3%) |
Public vs Private Health Insurance Coverage by Age in Travelers Rest
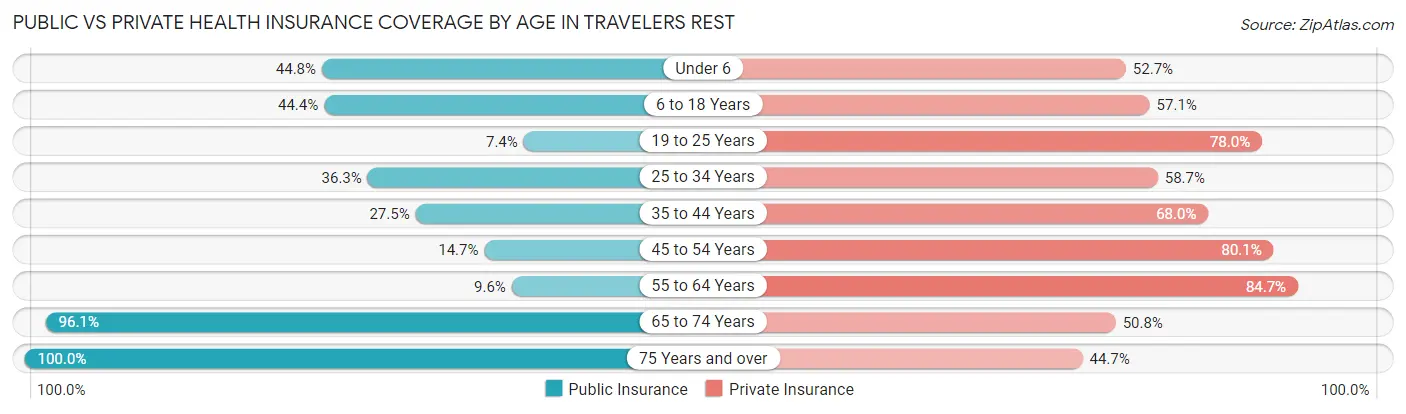
| Age Bracket | Public Insurance | Private Insurance |
| Under 6 | 295 (44.8%) | 347 (52.7%) |
| 6 to 18 Years | 712 (44.4%) | 916 (57.1%) |
| 19 to 25 Years | 182 (7.4%) | 1,924 (78.0%) |
| 25 to 34 Years | 174 (36.3%) | 281 (58.7%) |
| 35 to 44 Years | 157 (27.5%) | 389 (68.0%) |
| 45 to 54 Years | 102 (14.7%) | 557 (80.1%) |
| 55 to 64 Years | 35 (9.6%) | 309 (84.7%) |
| 65 to 74 Years | 516 (96.1%) | 273 (50.8%) |
| 75 Years and over | 499 (100.0%) | 223 (44.7%) |
| Total | 2,672 (33.9%) | 5,219 (66.3%) |
Disability Status by Sex by Age in Travelers Rest
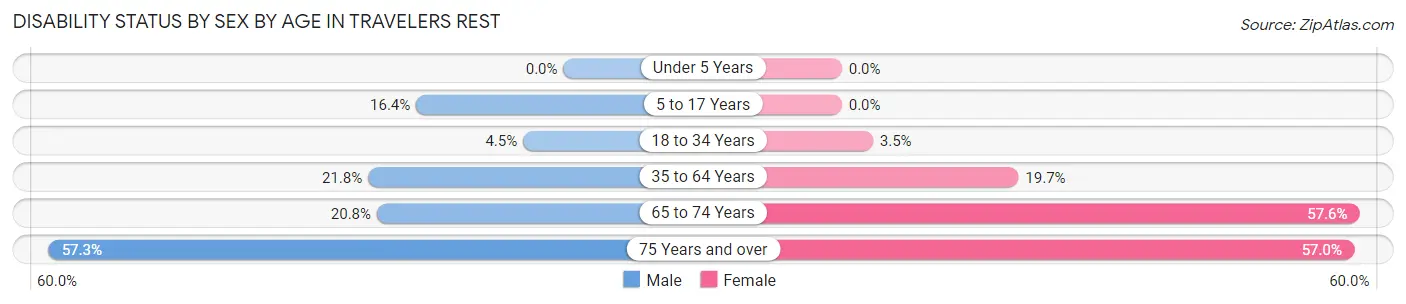
| Age Bracket | Male | Female |
| Under 5 Years | 0 (0.0%) | 0 (0.0%) |
| 5 to 17 Years | 134 (16.4%) | 0 (0.0%) |
| 18 to 34 Years | 59 (4.5%) | 70 (3.5%) |
| 35 to 64 Years | 147 (21.7%) | 188 (19.7%) |
| 65 to 74 Years | 38 (20.8%) | 204 (57.6%) |
| 75 Years and over | 98 (57.3%) | 187 (57.0%) |
Disability Class by Sex by Age in Travelers Rest
Disability Class: Hearing Difficulty
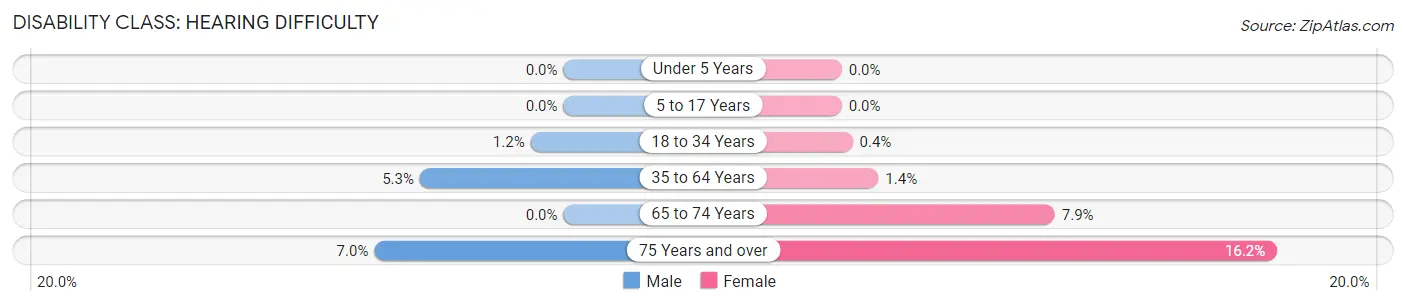
| Age Bracket | Male | Female |
| Under 5 Years | 0 (0.0%) | 0 (0.0%) |
| 5 to 17 Years | 0 (0.0%) | 0 (0.0%) |
| 18 to 34 Years | 16 (1.2%) | 8 (0.4%) |
| 35 to 64 Years | 36 (5.3%) | 13 (1.4%) |
| 65 to 74 Years | 0 (0.0%) | 28 (7.9%) |
| 75 Years and over | 12 (7.0%) | 53 (16.2%) |
Disability Class: Vision Difficulty
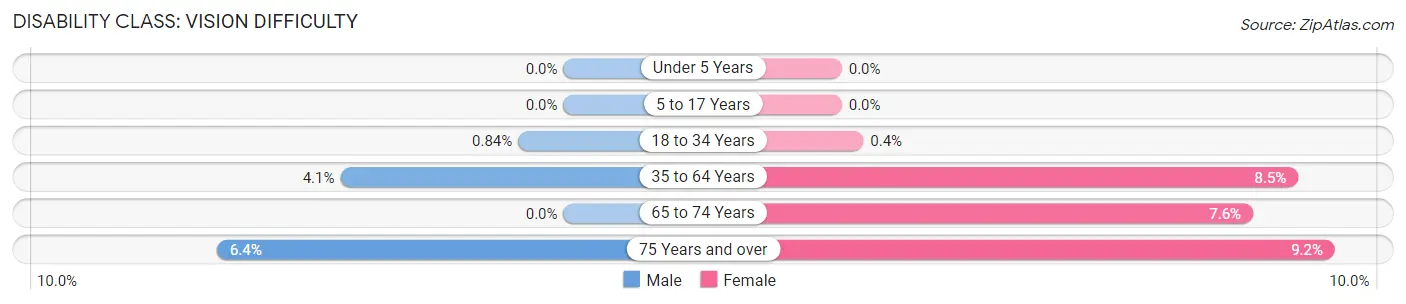
| Age Bracket | Male | Female |
| Under 5 Years | 0 (0.0%) | 0 (0.0%) |
| 5 to 17 Years | 0 (0.0%) | 0 (0.0%) |
| 18 to 34 Years | 11 (0.8%) | 8 (0.4%) |
| 35 to 64 Years | 28 (4.1%) | 81 (8.5%) |
| 65 to 74 Years | 0 (0.0%) | 27 (7.6%) |
| 75 Years and over | 11 (6.4%) | 30 (9.1%) |
Disability Class: Cognitive Difficulty
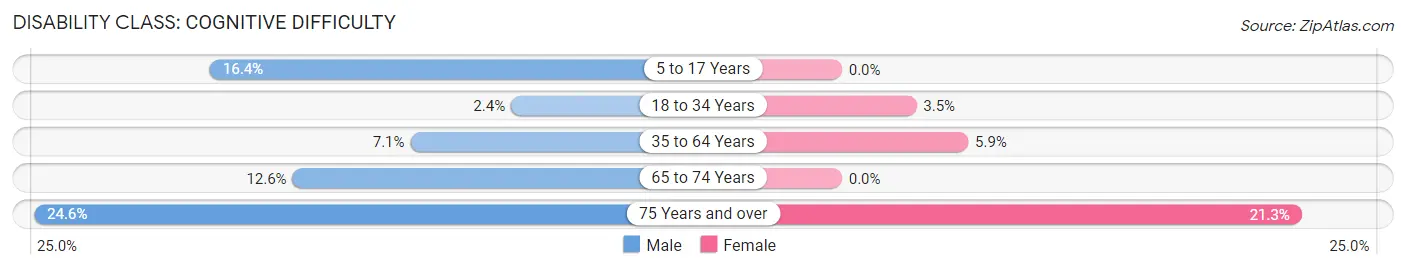
| Age Bracket | Male | Female |
| 5 to 17 Years | 134 (16.4%) | 0 (0.0%) |
| 18 to 34 Years | 32 (2.4%) | 70 (3.5%) |
| 35 to 64 Years | 48 (7.1%) | 56 (5.9%) |
| 65 to 74 Years | 23 (12.6%) | 0 (0.0%) |
| 75 Years and over | 42 (24.6%) | 70 (21.3%) |
Disability Class: Ambulatory Difficulty
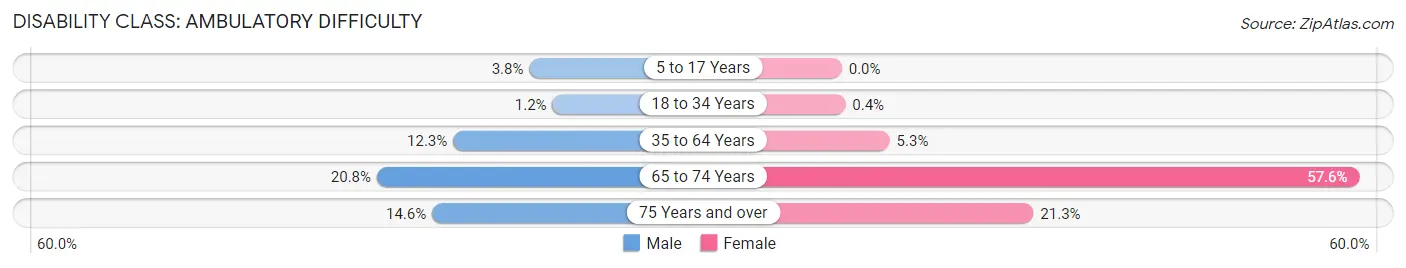
| Age Bracket | Male | Female |
| 5 to 17 Years | 31 (3.8%) | 0 (0.0%) |
| 18 to 34 Years | 16 (1.2%) | 8 (0.4%) |
| 35 to 64 Years | 83 (12.3%) | 51 (5.3%) |
| 65 to 74 Years | 38 (20.8%) | 204 (57.6%) |
| 75 Years and over | 25 (14.6%) | 70 (21.3%) |
Disability Class: Self-Care Difficulty
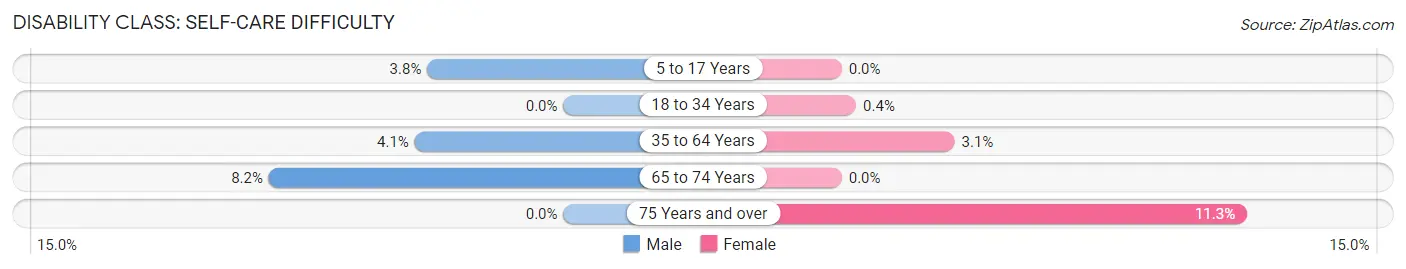
| Age Bracket | Male | Female |
| 5 to 17 Years | 31 (3.8%) | 0 (0.0%) |
| 18 to 34 Years | 0 (0.0%) | 8 (0.4%) |
| 35 to 64 Years | 28 (4.1%) | 30 (3.1%) |
| 65 to 74 Years | 15 (8.2%) | 0 (0.0%) |
| 75 Years and over | 0 (0.0%) | 37 (11.3%) |
Technology Access in Travelers Rest
Computing Device Access in Travelers Rest
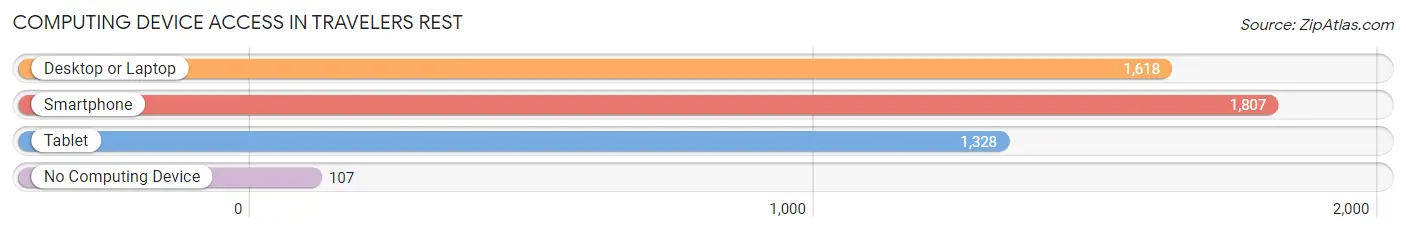
| Device Type | # Households | % Households |
| Desktop or Laptop | 1,618 | 77.2% |
| Smartphone | 1,807 | 86.3% |
| Tablet | 1,328 | 63.4% |
| No Computing Device | 107 | 5.1% |
| Total | 2,095 | 100.0% |
Internet Access in Travelers Rest
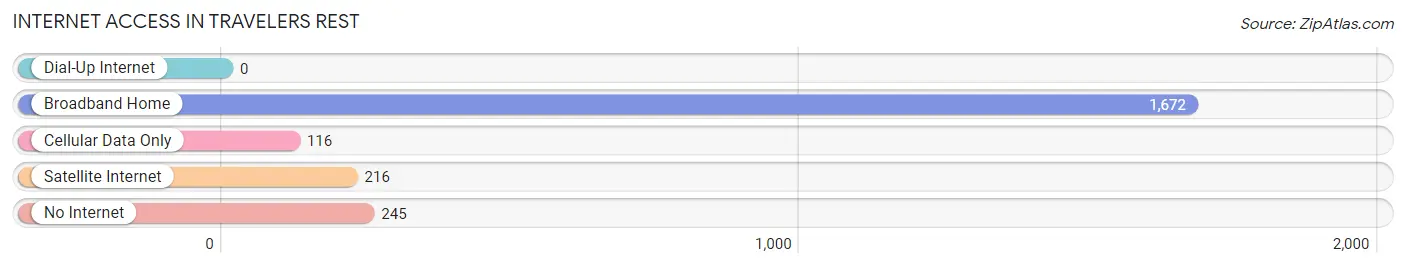
| Internet Type | # Households | % Households |
| Dial-Up Internet | 0 | 0.0% |
| Broadband Home | 1,672 | 79.8% |
| Cellular Data Only | 116 | 5.5% |
| Satellite Internet | 216 | 10.3% |
| No Internet | 245 | 11.7% |
| Total | 2,095 | 100.0% |
Travelers Rest Summary
Travelers Rest, South Carolina is a small town located in the foothills of the Blue Ridge Mountains in Greenville County. It is situated along the banks of the Reedy River and is approximately 15 miles north of Greenville. The town was founded in 1781 and has a population of approximately 4,000 people.
History
Travelers Rest was founded in 1781 by a group of settlers from Virginia. The town was originally known as “Travlers Rest” and was a popular stopover for travelers on their way to the western part of the state. The town was officially incorporated in 1856 and was named after the nearby Reedy River.
The town was a popular stop for travelers on the stagecoach route between Greenville and Asheville. The town was also a popular stop for Confederate soldiers during the Civil War. In the late 1800s, the town was a popular destination for wealthy families from the North who were looking to escape the cold winters.
The town experienced a period of growth in the early 1900s when the railroad came to town. The railroad brought new businesses and industries to the area, including a cotton mill and a furniture factory. The town also became a popular tourist destination, with many people coming to visit the nearby mountains and lakes.
Geography
Travelers Rest is located in the foothills of the Blue Ridge Mountains in Greenville County. The town is situated along the banks of the Reedy River and is approximately 15 miles north of Greenville. The town is surrounded by the cities of Greer, Taylors, and Marietta. The town is located at an elevation of 1,000 feet and has a total area of 2.2 square miles.
The town is located in a temperate climate with mild winters and hot summers. The average temperature in the summer is around 80 degrees Fahrenheit and the average temperature in the winter is around 40 degrees Fahrenheit. The town receives an average of 45 inches of rain per year.
Economy
Travelers Rest has a diverse economy that is largely based on tourism and manufacturing. The town is home to several manufacturing companies, including a furniture factory and a cotton mill. The town is also home to several restaurants, shops, and other businesses.
The town is also home to several tourist attractions, including the Reedy River Falls, the Travelers Rest Historic District, and the Travelers Rest Speedway. The town is also home to several parks and recreational areas, including the Paris Mountain State Park and the Furman University Golf Course.
Demographics
As of the 2010 census, the population of Travelers Rest was 4,039. The population is largely white (83.3%) and African American (14.2%). The median household income is $41,945 and the median age is 38.7 years.
The town is home to several churches, including the First Baptist Church of Travelers Rest, the Travelers Rest Presbyterian Church, and the Travelers Rest United Methodist Church. The town is also home to several schools, including the Travelers Rest High School and the Travelers Rest Elementary School.
Conclusion
Travelers Rest, South Carolina is a small town located in the foothills of the Blue Ridge Mountains in Greenville County. The town was founded in 1781 and has a population of approximately 4,000 people. The town has a diverse economy that is largely based on tourism and manufacturing. The town is also home to several tourist attractions, churches, and schools. The population is largely white and African American and the median household income is $41,945.
Common Questions
What is Per Capita Income in Travelers Rest?
Per Capita income in Travelers Rest is $20,908.
What is the Median Family Income in Travelers Rest?
Median Family Income in Travelers Rest is $61,750.
What is the Median Household income in Travelers Rest?
Median Household Income in Travelers Rest is $44,375.
What is Income or Wage Gap in Travelers Rest?
Income or Wage Gap in Travelers Rest is 28.5%.
Women in Travelers Rest earn 71.5 cents for every dollar earned by a man.
What is Inequality or Gini Index in Travelers Rest?
Inequality or Gini Index in Travelers Rest is 0.45.
What is the Total Population of Travelers Rest?
Total Population of Travelers Rest is 7,929.
What is the Total Male Population of Travelers Rest?
Total Male Population of Travelers Rest is 3,381.
What is the Total Female Population of Travelers Rest?
Total Female Population of Travelers Rest is 4,548.
What is the Ratio of Males per 100 Females in Travelers Rest?
There are 74.34 Males per 100 Females in Travelers Rest.
What is the Ratio of Females per 100 Males in Travelers Rest?
There are 134.52 Females per 100 Males in Travelers Rest.
What is the Median Population Age in Travelers Rest?
Median Population Age in Travelers Rest is 21.4 Years.
What is the Average Family Size in Travelers Rest
Average Family Size in Travelers Rest is 3.2 People.
What is the Average Household Size in Travelers Rest
Average Household Size in Travelers Rest is 2.6 People.
How Large is the Labor Force in Travelers Rest?
There are 3,490 People in the Labor Forcein in Travelers Rest.
What is the Percentage of People in the Labor Force in Travelers Rest?
55.8% of People are in the Labor Force in Travelers Rest.
What is the Unemployment Rate in Travelers Rest?
Unemployment Rate in Travelers Rest is 6.4%.